VOLUME 37, ARTICLE 42, PAGES 1351
,
1382
PUBLISHED 2 NOVEMBER 2017
http://www.demographic-research.org/Volumes/Vol37/42/ DOI: 10.4054/DemRes.2017.37.42
Research Article
A mixed-methods framework for analyzing text
data: Integrating computational techniques with
qualitative methods in demography
Parijat Chakrabarti
Margaret Frye
© 2017 Parijat Chakrabarti & Margaret Frye.
This open-access work is published under the terms of the Creative Commons Attribution 3.0 Germany (CC BY 3.0 DE), which permits use, reproduction, and distribution in any medium, provided the original author(s) and source are given credit.
1 Introduction 1352
2 Data challenges for qualitative demography 1353
2.1 Problems of excess 1353
2.2 Problems of external comparisons 1354
2.3 Problems of opacity 1355
2.4 Automated text analysis as a supplement to conventional qualitative methods
1356
3 Data and methodology 1357
3.1 The Malawi Journals Project 1357
3.2 Methodological approach: Structural topic models 1358
3.3 From text as narrative to text as data 1359
4 Results 1361
4.1 Addressing problems of excess 1361
4.1.1 Discovering topics of interest 1361
4.1.2 Sample selection 1364
4.2 Addressing problems of external comparisons 1366
4.2.1 A ‘blind’ alternative to blind coding 1366
4.2.2 Contextualizing findings in time 1368
4.3 Addressing problems of opacity 1369
4.3.1 Data sharing 1370
4.3.2 Supporting making transparent claims 1372
5 Conclusions 1375
A mixed-methods framework for analyzing text data: Integrating
computational techniques with qualitative methods in demography
Parijat Chakrabarti1 Margaret Frye2
Abstract
BACKGROUND
Automated text analysis is widely used across the social sciences, yet the application of these methods has largely proceeded independently of qualitative analysis.
OBJECTIVE
This paper explores the advantages of applying automated text analysis to augment traditional qualitative methods in demography. Computational text analysis does not replace close reading or subjective theorizing, but it can provide a complementary set of tools that we believe will be appealing for qualitative demographers.
METHODS
We apply topic modeling to text data from the Malawi Journals Project as a case study.
RESULTS
We examine three common issues that demographers face in analyzing qualitative data: large samples, the challenge of comparing qualitative data across external categories, and making data analysis transparent and readily accessible to other scholars. We discuss ways that new tools from machine learning and computer science might help qualitative scholars to address these issues.
CONCLUSIONS
We believe that there is great promise in mixed-method approaches to analyzing text. New methods that allow better access to data and new ways to approach qualitative data are likely to be fertile ground for research.
CONTRIBUTIONS
No research, to our knowledge, has used automated text analysis to take an explicitly mixed-method approach to the analysis of textual data. We develop a framework that allows qualitative researchers to do so.
1. Introduction
While demography is often viewed from the outside as consisting only of quantitative research, qualitative research and data have long been vital to the field (Coast, Hampshire, and Randall 2007; Elder 1974; Knodel 1974; Obermeyer 1997; Randall and Koppenhaver 2004; Schatz 2012). Recent advances in data collection, including the digitization of vital records such as marriage and death certificates, the use of software to ‘scrape’ data from websites, the ability to easily download and digitally analyze books, newspaper articles, government reports, and court transcripts, and the increasing prevalence of qualitative data accompanying surveys (Schatz 2012; Trinidad et al. 2016) have considerably expanded the text data available to demographers. Yet traditional methods for qualitative inquiry present some important limitations in the digital age.
This paper demonstrates the advantages of automated text analysis for analyzing qualitative data, with a specific focus on concerns often confronted by qualitative demographers. Automated text analysis was first developed at the intersection of computer science and the humanities, and is routinely used across the social sciences. Yet, to date the application of these methods to text data has proceeded independently of qualitative analysis. No research, to our knowledge, has taken an explicitly mixed-methods approach to the analysis of textual data. In this paper we take the perspective of qualitative researchers and illustrate the advantages of using automated text analysis3
in order to supplement deep reading and coding of texts. Computational text analysis does not replace close reading or subjective theorizing, but it can provide a complementary set of tools that we believe will be appealing for qualitative demographers.
Specifically, automated text analysis can help demographic researchers address three sets of problems that scholars often grapple with when analyzing qualitative data. First, this set of methods can help address problems of excess: there is simply too much data to read and analyze in depth, and it can be difficult to identify topics of interest and select a manageable subset of documents that are pertinent to a given topic. Second, automated text analysis can help scholars to minimize issues of bias related to problems of external comparisons: the difficulty of accurately assessing how qualitative themes vary across easily identifiable variables such as time, author, or location. And third, automated text analysis can help researchers grapple with problems of opacity – the challenges that qualitative researchers face when trying to make their analyses transparent and accessible to other researchers. We explore each set of methodological priorities and concerns below. We then use qualitative data from the Malawi Journals
3 While we take the case of topic modeling in this paper, the framework we develop is broadly applicable to
Project to demonstrate the utility of automated text analysis in addressing these and other problems.
2. Data challenges for qualitative demography
In this section we highlight the three sets of challenges mentioned above. For each, we describe both how these challenges are common in qualitative social science and how they particularly impact demographers.
2.1 Problems of excess
In recent decades, new methods of gathering data (such as web scraping and optical recognition software) alongside a move to store documents in publicly available online databases have together produced a proliferation of readily accessible textual data (Grimmer and Stewart 2013). Qualitative data is increasingly linked to large-scale surveys or comes from newspaper accounts, court transcripts, and other historical records previously inaccessible to researchers. Yet the qualitative methods available to most researchers are ill equipped to deal with the sheer volume of available data. Interesting insights are at risk of becoming buried in the mountains of data – in short, we face problems of excess (Abbott 2014).
Problems of excess can be distilled into two specific analytic challenges. First, researchers often struggle to discover topics of interest within large corpora of text – even a superficial skim to discover major themes proves daunting as the size of a corpus increases. Platforms such as Atlas.ti and NVivo enable researchers to systematically organize analyses of textual data in a searchable format, which allows for some exploratory analysis of large corpora. However, these faculties are limited, requiring the researcher to pre-specify which terms to search for. More broadly, these commercial packages were designed to facilitate traditional qualitative methods – linking coded passages together and simultaneously storing multiple layers of analysis in the form of memos, annotations, and highlighted passages – rather than facilitating the discovery of new topics in large databases (Friese 2014; Woods et al. 2016).
(Small 2009). In particular, if one or more themes are substantively important but present in only a minority of cases, the random sample may lead to underdeveloped theories or inaccurate representations.
2.2 Problems of external comparisons
Demographers are often interested in how ideas or themes expressed in qualitative data vary by external variables such as race, gender, or time. This type of inquiry, particularly in the context of large text corpora, introduces three specific challenges.
First, researchers struggle to avoid biasing their results through preconceptions formed during the coding process. The same advantages that make qualitative analysis particularly generative of new theories – that it is reflexive, nuanced, and full of rich detail – make it difficult to objectively evaluate conclusions according to an external set of contrasts. Partway through the arduous task of reading and coding our data, we develop a hunch of what our argument might be – for example, that a theme emerged at a particular time, or that a topic is more often discussed by people of a certain ethnicity. From this point forward, future readings are colored by our vision of our future conclusions, and we are more likely to notice examples that confirm our hunch than those that contradict it. These biases, of course, are not unique to demography, but given our proclivity to make comparisons across easily distinguishable categories – country, gender, race – this tendency to read a story into our analysis is particularly difficult to avoid in our field.
Researchers often try to solve this problem through ‘blind coding,’ masking these external variables during the analysis (e.g., Kolbe and Burnett 1991). Yet this technique is rendered moot when the variables are discernable from the text itself; for example, a respondent’s socioeconomic background may be discussed during the interview and thus cannot be “blinded” from the analyst (Biernacki 2012). Another strategy for reducing this type of bias is to work in teams and to establish inter-rater reliability across individuals (Armstrong et al. 1997; Campbell et al. 2013), but all readings (and readers) of qualitative data may be subject to similar subjective biases.
when there are discrete events or periods around which one wishes to organize qualitative data. However, if researchers are interested in the slow creep of cultural change or the diffusion of norms over time – for example, changing attitudes towards AIDS in rural Malawi – groupings such as an ‘early’ and ‘late’ period may muddle analyses of temporal processes.
Lastly, because the analytic process is so laborious, qualitative researchers rarely have the opportunity to explore how different themes or concepts may be patterned according to combinations of external variables. Greater recombinant possibilities are opened up with increasingly large troves of data, but the size of the corpus itself limits researchers’ ability to explore these possibilities. Researchers may point to the possibility of the ‘intersectional’ or ‘overlapping’ nature of their results, but external variables are rarely systematically analyzed in tandem.
2.3 Problems of opacity
Qualitative demographers who successfully grapple with large volumes of data then face another set of pragmatic challenges: how to make their analysis transparent and their data readily accessible to peers who may be interested in substantiating or building upon the findings. Across disciplines, social scientists are converging around new ethical standards of transparency and replicability, demanding that researchers publicly share their data and analysis files in order to provide an evidentiary basis for claims (Miguel et al. 2014). Despite recognizing the unique challenges that qualitative data poses, including the need to preserve the anonymity of subjects and the likelihood that multiple interpretations will emerge from the same data source, qualitative researchers have also been called upon to focus on the twin problems of transparency of data and transparency of making claims (Abramson and Dohan 2015; Elman and Kapiszewski 2014; Freese 2007; King, Keohane, and Verba 1994).
Access to confidential data has long been a point of contention in qualitative research, particularly for interview and ethnographic studies (Duneier 1999; Jerolmack and Murphy 2017). Without access to data, researchers cannot independently evaluate claims made from the data, and so, critics contend, the scope for bias and misrepresentation becomes unacceptably large. On the other hand, sensitive subjects and vulnerable populations often require anonymity. Researchers can resolve this issue by redacting names or personally identifiable information, but sometimes context clues in the text of the raw data threaten anonymity even after proper nouns are removed.
classification occurs is often idiosyncratic and rarely made explicit (Ryan and Bernard 2003). Even when coding and classification schemes are clearly specified they can be laborious to replicate – a problem amplified by the ever-increasing surfeit of qualitative data. This absence of a widely shared and directly replicable methodology leaves qualitative claims susceptible to criticisms of validity. Does the interpretation suit the data or does the data suit the interpretation? Are the main interpretive points central to the text or peripheral? Moreover, given the stylistic and formatting constraints of academic writing, researchers rely on limited excerpts of text data to illustrate their points. Most researchers seek to ensure that these excerpts are not idiosyncratic and are illustrative of broader trends, but the ability to make their selection process more transparent and to bolster assertions of generalizability would strengthen the evidentiary basis of interpretive claims.
Problems of opacity thus revolve around two axes: data sharing and transparency in the process of making claims. Anxieties around claims based on privately held data continue to haunt the field, while the absence of a standardized qualitative methodology can obfuscate the process through which qualitative claims are generated and, in so doing, undermine them.
2.4 Automated text analysis as a supplement to conventional qualitative methods
In the remainder of this paper we present a partial solution to these challenges: supplementing conventional qualitative research methods with automated text analysis. While quantitative computational methodologists have made inroads into the analysis of text, communication between these scholars and experts of qualitative data analysis has thus far been limited. Yet these new methods have their greatest potential when combined with a close and informed reading of the texts themselves. We provide a framework to link automated text analysis with the qualitative analysis of text.
techniques that qualitative researchers already use makes the process of discovering themes fast, systematic, and replicable.
The discovery of themes in text is crucial to qualitative research; however, it is usually only a first step in the research process. Interpretation of themes is the hinge on which analysis turns. Direct application of automated text analysis is highly successful at discovering patterns in the data, but simply reporting the output of models leaves the researcher vulnerable to oversimplification and naïve conclusions.4 On the other hand,
the key strengths of qualitative text analysis include depth of analysis and a nuanced appreciation of context, but conventional methods quickly compound in difficulty as categories of comparison and size of textual corpora increase. Using a mixed methods approach can help address the limitations of each method alone.
Automated text analysis can aid qualitative researchers in addressing problems of excess, external comparisons, and opacity. When analyzing large text corpora, qualitative researchers can use automated text analysis to discover topics of interest and identify corresponding text passages before turning to conventional qualitative methods to interpret these topics. Automated text analysis can also help researchers make inference based on external variables by mitigating bias formed through preconceptions or arbitrarily discrete categories of comparison. Finally, automated text analysis provides tools to help with questions of transparency that plague qualitative research. We now present a case study showing in practice how this set of methods can help address these problems.
3. Data and methodology
3.1 The Malawi Journals Project
The Malawi Journals Project (henceforth MJP), which began in 1999 and is ongoing, was first designed as a qualitative supplement to a longitudinal household survey (Watkins and Swidler 2009). Frustrated by the limitations of the survey format, the investigators hired local participant observers (‘journalists’) to document informal conversations related to AIDS that took place around them, while shopping at the market, drinking in a bar, or attending a church service. Journalists were paid $30 for each completed notebook. Between 1999 and 2012 the project produced 1,054 notebooks that average 7,500 words in length. Most are publicly available online, with
4 To be clear, methodologists of automated text analysis do not advocate simply reporting outputs of topic
all proper names anonymized.5 Each notebook contains multiple conversations recorded
by the journalist over a period of a few days or a few months. Our sample of 1,054 notebooks yielded 4,080 unique ‘conversational incidents’ (exchanges between two or more people that are bounded by time and space, see Angotti et al. 2014) between 2000 and 2012.
The journals are an incredibly rich source of information about daily life in rural Malawi (Watkins and Swidler 2009). These data are ideal for understanding meaning-making as a collective process, as they capture people’s opinions as expressed organically, rather than in a formal interview setting, and incorporate the disputes, humor, and contradictions inherent to informal talk. Because Malawian journalists select the episodes to write about and the details to include, the data reveals which concepts are salient and which ideas are conjoined in this cultural context. The conversational journals have thus far provided insights into various aspects of sexual life and experience with AIDS in Malawi, including cultural narratives around death and dying (Ashforth and Watkins 2015), gendered schemas of sexuality (Schatz 2005), strategies for avoiding HIV infection (Watkins 2004), local perceptions of HIV testing and antiretroviral treatment (Conroy, Yeatman, and Dovel 2013), semiotic meanings surrounding condoms (Tavory and Swidler 2009), and the contrasting moral understandings of AIDS in newspapers versus everyday life (Angotti et al. 2014).
With over 4,000 texts, however, it is infeasible to read each conversation closely, and thus the MJP is an ideal candidate for automated text analysis. The journals also contain idiosyncrasies common across textual corpora: words are misspelled or written in foreign languages, grammar is often poor, and they frequently start or stop mid-story. Moreover, the rich literature developed from the MJP offers an opportunity to examine whether computational methods can 1) substantiate existing findings, and 2) offer anything beyond conventional qualitative methods. This data thus constitutes an excellent test case for whether automated text analysis will be of use to qualitative demographers.
3.2 Methodological approach: Structural topic models
Automated text analysis requires the transformation of qualitative text into statistical data. The metaphor of turning a document into a ‘bag of words’ is often used to describe this transformation. Word order, punctuation, meaning, and grammar are ignored, and documents are represented as frequency counts of discrete words. Most automated text analysis methods aim to identify ‘co-occurrence’ – whether and how
5 See http://investinknowledge.org/projects/research/malawian_journals_project for information about
often two words occur together within documents. Despite being an “incorrect model of language” (Grimmer and Stewart 2013), simple co-occurrence of words often roughly approximate the existence of certain themes, topics, or other relevant categories of description.
In-depth discussions of the various methods of quantitative text analysis are available elsewhere (in particular see Grimmer and Stewart 2013). In our case study we make use of one method, the structural topic model (Roberts et al. 2014; Roberts, Stewart, and Tingley 2017), which, as we describe below, is especially well suited to qualitative demographic research.6 Structural topic models (STM) fall within the larger
class of methods known as topic modeling. Topic modeling assumes that each document can be characterized as a distribution of topics and that each topic, in turn, can be characterized as a distribution of words. A topic model algorithm works backwards, first analyzing the co-occurrence of words within documents to estimate topics and then estimating the proportion of topics within each document. This nested hierarchical structure is the fundamental approach of topic models. Topic models thus take an inductive approach to identifying patterns and themes, and infer rather than assume the content of documents. This flexibility allows for the automated discovery of categories of interest; the researcher need not specify the topics ahead of time.
The primary advantage of structural topic models is that they show how topics vary by metadata – external variables associated with each document.7 For instance, a
researcher might be interested in metadata such as the date a source was generated, the gender, race, or age of authors or respondents, and the location of the episode. We see structural topic models as particularly useful to qualitative demographers because such external variables are often central to demographic analysis.
3.3 From text as narrative to text as data
Preparing corpora for automated text analysis requires some level of comfort with coding. In this section we provide an overview of the process we undertook to prepare the MJP corpus for structural topic modeling, such that qualitative researchers with limited experience with computer programming can understand the steps involved. We also provide the code necessary to replicate our specific pre-analysis process in an online supplement.
6 The researchers behind the method have developed an excellent R package, which we use in this paper. The
package can be downloaded from http://www.structuraltopicmodel.com/ or https://cran.r-project.org/web/ packages/stm/index.html. Refer to the STM vignette (Roberts, Stewart, and Tingley 2017) for a detailed description of the package. The website also contains a wealth of additional supporting information.
7 For a full range of STM’s functionalities, we refer readers to Roberts, Stewart, and Tingley (2017) and to
The basic requirements for a corpus to be a good candidate for topic modeling are twofold. First, the corpus should have a sufficient number of documents for the algorithm to effectively identify topics. In most cases this criterion will be easily met, as researchers are unlikely to turn to automated methods if the corpus is small enough to be analyzed by hand.
Second, each document should be relatively short and roughly consistent in length. If the researcher inputs book-length documents, relevant and meaningful topics may not emerge, and consistency in document length improves the consistency of the topic model in describing documents. We developed a ‘text splitter’ tool to assist in partitioning longer texts into short documents roughly consistent in length (300–600 words).8 In our models we account for the hierarchical structure of having multiple
shorter excerpts come from the same original conversational entry.
Third, for most topic models the researcher must choose a specified number of topics, K, for the analysis. Choosing too low a number yields topics that are overly general, while choosing too high a number may fracture otherwise interesting topics into incoherent statistical correlations or into hyper-specific topics that are impossible to generalize over the corpus. Scholars have developed computational metrics to inform researchers’ choice ofK (Taddy 2012; Wallach et al. 2009), many of which are built into the structural topic model package in R. While these are helpful as a starting point, we found iterative exploration – investigating the output, making minor adjustments to
K, and assessing whether additional interesting topics emerge – to be a useful supplement to these computational tests. Ultimately, we set the number of topics at 35 for our main model, which was supported both by computational tests and iterative exploration.
Fourth, the researcher must remove ‘stopwords,’ or words that are not substantively meaningful and do not contribute to the identification of themes of interest. Some examples of stopwords in our corpus include articles and pronouns, common operative words such as ‘said’ and ‘went,’ conjunctions and prepositions such as ‘although’ and ‘after,’ and proper nouns such as ‘Michael’ and ‘Ganizani.’ These can be removed iteratively as the researcher continues to refine her model. In our main model we remove a list of 139 stopwords, along with all words less than four letters long.
Lastly, the researcher has the option to ‘stem’ words. Stemming a word means the model will only consider the base form of a word; for example, ‘thinking’ and ‘thinker’ would each be treated as ‘think.’ Stemming usually improves model fit. There are, of course, exceptions; for example, in the context of Malawi, ‘aid’ and ‘AIDS’ are quite distinct in meaning, and if either or both are of interest to the researcher, stemming may muddle results. We ran the model using both stemmed and unstemmed words and
found that the stemmed output was more informative for our substantive interests, but that they were quite similar overall.
4. Results
4.1 Addressing problems of excess
In this section we show how automated text analysis can augment qualitative methods to help address problems of excess. First, given increasingly large volumes of text, researchers often struggle to discover topics of interest. Second, based on the discovery of topics of interest, researchers need a way to select substantively relevant documents for in-depth qualitative analysis.
4.1.1 Discovering topics of interest
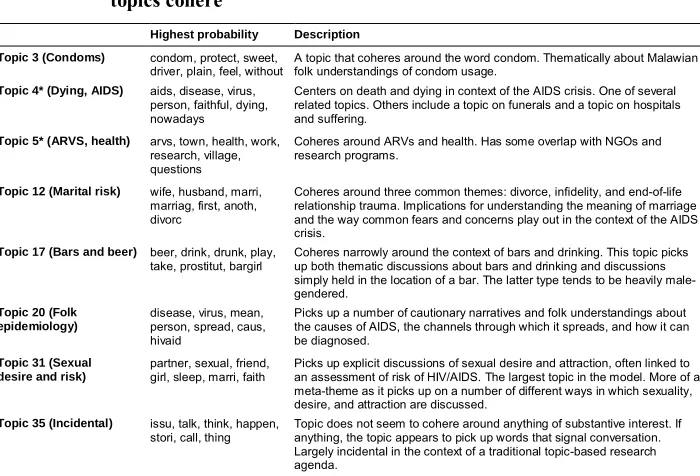
We begin by providing an overview of four ideal-typical ways that a set of words might cohere into a ‘topic’: around one word; around a narrow theme or set of words; around a meta-theme or set of broadly related themes; or around nothing thematically apparent, what we term an ‘incidental’ topic. Table 1 offers a summary description for each topic that we discuss in this paper, each of which can be characterized as one of these four types. We discuss four such topics below.
Topic 3 coheres around a single word: condom. Some words that are likely to emerge in the topic with high probability are ‘condom,’ ‘protect,’ ‘sweet,’ ‘plain,’ and ‘feel.’ The association between ‘condom,’ ‘protect,’ and ‘feel’ is relatively unsurprising in an American context. Two words that stand out are ‘sweet’ and ‘plain.’ What might they mean in the context of everyday discussions of condoms in rural Malawi? Are they significant or simply an idiosyncratic result of the model?
Table 1: Topic model results of selected topics that show distinct ways that topics cohere
Highest probability Description
Topic 3 (Condoms) condom, protect, sweet,
driver, plain, feel, without A topic that coheres around the word condom. Thematically about Malawianfolk understandings of condom usage. Topic 4* (Dying, AIDS) aids, disease, virus,
person, faithful, dying, nowadays
Centers on death and dying in context of the AIDS crisis. One of several related topics. Others include a topic on funerals and a topic on hospitals and suffering.
Topic 5* (ARVS, health) arvs, town, health, work, research, village, questions
Coheres around ARVs and health. Has some overlap with NGOs and research programs.
Topic 12 (Marital risk) wife, husband, marri, marriag, first, anoth, divorc
Coheres around three common themes: divorce, infidelity, and end-of-life relationship trauma. Implications for understanding the meaning of marriage and the way common fears and concerns play out in the context of the AIDS crisis.
Topic 17 (Bars and beer) beer, drink, drunk, play,
take, prostitut, bargirl Coheres narrowly around the context of bars and drinking. This topic picksup both thematic discussions about bars and drinking and discussions simply held in the location of a bar. The latter type tends to be heavily male-gendered.
Topic 20 (Folk epidemiology)
disease, virus, mean, person, spread, caus, hivaid
Picks up a number of cautionary narratives and folk understandings about the causes of AIDS, the channels through which it spreads, and how it can be diagnosed.
Topic 31 (Sexual desire and risk)
partner, sexual, friend,
girl, sleep, marri, faith Picks up explicit discussions of sexual desire and attraction, often linked toan assessment of risk of HIV/AIDS. The largest topic in the model. More of a meta-theme as it picks up on a number of different ways in which sexuality, desire, and attraction are discussed.
Topic 35 (Incidental) issu, talk, think, happen, stori, call, thing
Topic does not seem to cohere around anything of substantive interest. If anything, the topic appears to pick up words that signal conversation. Largely incidental in the context of a traditional topic-based research agenda.
Notes: Topic numbers correspond to our main model, the stemmed structural topic model output with 35 topics. Words are ‘stemmed’ in the topic model, meaning that only the root of the word is used. This reduces redundancy in topic model outputs, though clearly the automated process is not perfect (e.g., the inclusion of both ‘marri’ and ‘marriag.’)
* The exceptions are Topics 4 and 5, which emerged most cleanly in an unstemmed topic model output of 30 topics. We use topics 4 and 5 mostly to demonstrate the utility of automated text analysis for exploring time trends, but it also highlights the fact that some topics are model-dependent. We discuss further in the footnote when we introduce Figure 3.
The column ‘highest probability’ represents the words with the highest probability of being drawn from the distribution of words that comprise the topic. There are other measures such as FREX, a combined measure of frequency and exclusivity to a topic. These are direct outputs from the topic model. We stress that the descriptive label applied to each topic along with the description of each topic do not emerge from the topic model; it is our qualitative interpretation of the statistical topic model.
Topic 12 coheres around a narrow theme: marital risk. Words most frequently observed in Topic 12 include ‘wife,’ ‘husband,’ ‘marriage,’ ‘divorce,’ and ‘first.’ A close reading of documents that score high in Topic 12 – that is, documents that contain a high percentage of words relating to Topic 12 – reveals a focus on the implications of HIV for marriage. Three common subjects found in this topic are divorce, infidelity, and end-of-life relationship trauma. This type of topic coherence is perhaps closest to our colloquial understanding of what a theme is. Schatz (2005) builds on this theme to explore the ways in which women in rural Malawi exercise agency in dealing with marital conflicts.
are frequently observed in this topic include ‘disease’ ‘virus’ ‘cause,’ ‘HIV/AIDS,’ and ‘spread.’ At first glance, this list of words seems quite general and not very promising. Yet a qualitative investigation of documents that score high on this topic shows that they involve discussions about how AIDS came to Malawi, who is responsible for its spread, and how to identify an infected person. An example of a document highly relevant to Topic 20 is one where two men have a conversation about how to spot someone who has AIDS. One suggests that “soft hair” is a giveaway; the other agrees, but also points out that sometimes women can get “soft hair” from hair products, and moreover, with widespread ARVs, attractive and “healthy” women increasingly have AIDS.
While investigations of condoms and marital risk could arguably be discovered and categorized according to simple and intuitive search words – ‘condom,’ ‘marriage,’ and ‘divorce’ – no such obvious a-priori search terms exist for an investigation of folk narratives about the epidemiology of AIDS. Information about this topic is of great interest to demographers, yet trying to find relevant texts by hand within the larger MJP corpus would likely prove intractable. What patterns might the researcher look for as they begin to search for such texts? The ability of automated text analysis to identify latent themes thus opens the possibility of discovering new topics for investigation that would likely elude hand coding.
Finally, Topic 35 is an ‘incidental’ topic. Words that are central to this topic include ‘issue,’ ‘talk,’ ‘think,’ ‘happen,’ ‘call,’ and ‘thing.’ The topic coheres due to a statistical co-occurrence of words – here, words that are used in describing conversation. Such topics often appear to identify linguistic or stylistic relationships, but we would consider them incidental to traditional topic- or theme-based qualitative inquiry. In addition to ‘incidental’ topics, topic model outputs may include topics that, while thematically meaningful, are trivial or orthogonal to the research question.
We use a list of frequently observed words as reported by our topic model to summarize the content of each topic in Table 1. Such lists on their own provide limited insight into the content of the topics, and researchers should not solely rely on this initial output to discover topics of substantive interest. Several visualization tools exist that facilitate a deeper exploration of topics, allowing the researcher to examine how the topics appear in the texts themselves.
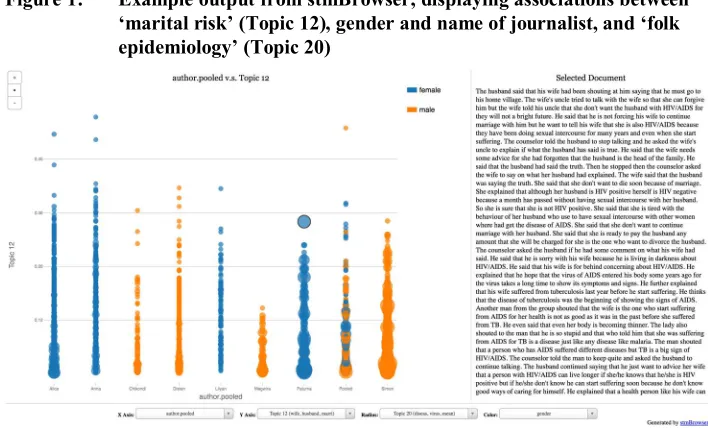
epidemiology. When a researcher clicks on a dot, the text of the document appears in the right-hand panel. This interactive visualization tool allows researchers to browse documents highly relevant to a topic, to examine associations between a given topic and metadata, and to investigate relationships between topics.
Figure 1: Example output from stmBrowser, displaying associations between
‘marital risk’ (Topic 12), gender and name of journalist, and ‘folk epidemiology’ (Topic 20)
Notes: stmBrowser is a visualization package in R that creates interactive graphs to facilitate the exploration of topics from a structural topic model. Topic numbers correspond to the structural topic model output with 35 topics. Each colored dot represents one document.
Its location with respect to the Y-axis corresponds to the document proportion of Topic 12 (Marital Risk). The size of the dot corresponds with the document proportion of Topic 20 (Folk Epidemiology).
Thecolor of the dot corresponds to the gender of the journalist (orange for men, blue for women), and the corpus is grouped by journalist along the X-axis.
The dot with a black outline (in the upper right quadrant) is the document that we selected and can be viewed on the right hand side of the screenshot. We selected this document for illustrative purposes, as it is high in both topics (marital risk and narratives for causes/transmissions)
4.1.2 Sample selection
The most straightforward way to sample documents is to draw a sample from the subset of documents that contain a high proportion of the topic of interest – in other words, those documents that contain a substantial percentage of the words linked to the topic of interest.9 For all topics identified by our model we observe a steep drop-off in
documents as topic proportions increase. For example, for Topic 20, folk narratives of epidemiology, roughly 80% of the documents in the MJP corpus have less than 5% relevance to the topic, and 90% of documents have less than 10% topical relevance. Less than a half-percent of documents are highly relevant (above 30%) to folk epidemiology, and the maximum relevance is 50%. Similar patterns were observed for all topics we discuss here (summarized in Table 1). In other words, most documents do not mention a given topic, or do so peripherally, and only a minority of documents in the corpus is meaningfully related to any given topic.
In light of this finding, random selection is a poor strategy for qualitatively analyzing a topic of interest: the researcher would want to focus on the small subset of documents that are highly relevant to the topic of interest. The documents that discuss topics of interest peripherally are not to be ignored, but the rare documents that provide an in-depth narrative exposition of a topic are critical in providing an anchor point for analysis. Topic proportions provide a simple measure of the salience of a document to a given topic, thus allowing the researcher to substantively sample documents of interest. This measure can also be combined with metadata to create systematic samples across other dimensions of interest. For instance, in selecting a sample to investigate marital risk a researcher may sample topics that have a high topical relevance, stratified by gender of journalist or by year.
To be sure, topic proportion may not always be a good measure of the relevance of the document to the researcher’s substantive interest. One one hand, if the researcher is interested in dynamics of marriage and divorce in rural Malawi, the topic proportion measure for the topic of marital risk is likely to be an excellent signal for identifying documents of interest. However, if the researcher is interested in the ways in which narratives of divorce are influenced by the changing arsenal of AIDS treatments, the topic proportion measure may only capture a part of the researcher’s interest. For example, a document could be 5% ‘about’ marital risk but include an interesting link to ARVs or other treatment options. This document is likely to be of greater interest to the researcher than a document with a higher proportion of telling the story of a divorce without referencing treatment. In these cases, examining proportions of multiple topics
9 In our corpus, documents with topic proportions above 30% are almost exclusively about that topic;
in tandem (here, topics on marital risk and treatment) would be a useful strategy in selecting an appropriate subset of documents.
4.2 Addressing problems of external comparisons
In the previous section we discussed ways that automated text analysis can help qualitative researchers address problems of excess – discovering and exploring topics and selecting documents related to a topic. Next comes the analysis of these documents. We show here how automated text analysis can help address problems related to assessing themes in reference to external categories of comparison. By automatically and systematically linking topics to metadata, automated text analysis can 1) provide a truly ‘blind’ alternative to blind coding to address the problem of preconceptions and 2) address the problem of assessing temporal trends in the absence of a clear discontinuity.
4.2.1 A ‘blind’ alternative to blind coding
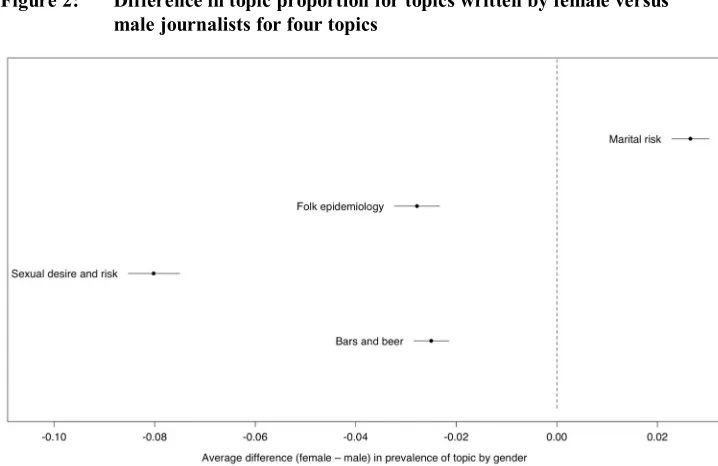
Despite our best attempts at blind coding, sometimes context clues in the text give away the external variable that we are interested in assessing. For example, in Malawi, social life is strongly stratified by gender, with some activities (washing clothes, cooking) almost exclusively female and others (sitting in a bar) almost exclusively male, and thus it would be impossible to conceal the gender of the journalist from the analyst. If we hypothesize that gender affects how a particular topic is discussed, it is difficult to avoid unintentionally biasing our results to confirm this hypothesis through our reading of the texts. Automated text analysis helps address this issue by independently testing the hypothesis that topics may be patterned by gender.
Figure 2: Difference in topic proportion for topics written by female versus male journalists for four topics
Notes: Topics used more frequently by female journalists appear on the right side of the dashed line while topics used more frequently by male journalists appear on the left side of the dashed line. The x-axis represents the difference by gender in average document topic proportion of the labeled topic.
The lines around the dot represent the 95% confidence interval.
While topic use by journalist’s gender doesn’t necessarily reflect the gender of the actual speaker within the journal (e.g., it could be a male speaker but a female journalist of the document), because of the gendered nature of both public space and friendship in Malawi there is a strong correlation between the gender of the journalist and the gender of the speakers within the documents themselves.
Among the most common words in the ‘Marital risk’ topic are: husband, marriage, divorce, another, unfaithful. Among the most common words in the ‘Folk epidemiology’ topic are: virus, spread, cause, intercourse, razor. Among the most common words in the ‘Sexual desire and risk’ topic are: partner, sexual, friend, girl, sleep, marri, faith Among the most common words in the ‘Bars and beer’ topic are: beer, drink, drunk, play, take, prostitut, bargirl
4.2.2 Contextualizing findings in time
Temporal trends are of special interest to demographers, as they reveal changes in fundamental processes such as fertility and mortality, as well as changes in the determinants of these processes. Yet assessing temporal trends is tricky in qualitative data: analyzing gradual cultural or thematic changes is particularly subject to the problem of preconceptions and is also challenging to demonstrate via hand coding. We show how automated text analysis can aid the process of describing and analyzing temporal trends in qualitative data.10
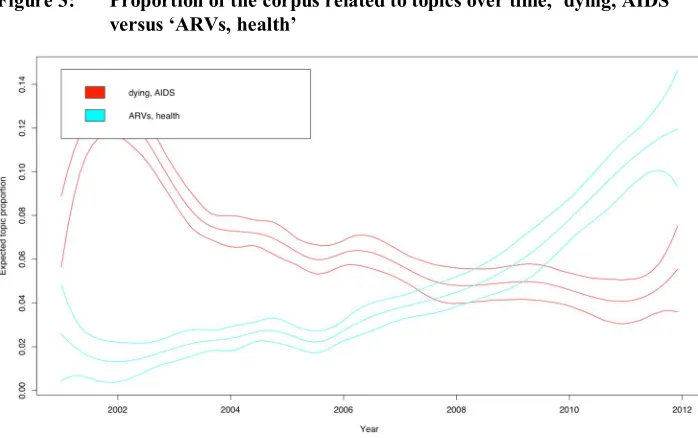
Figure 3 shows how the prevalence of public discussions about treatment of AIDS increased over time, while discussions around death decreased.11 The time trend
apparent in Figure 3 is a compelling one: it corresponds to the findings in Angotti et al. (2014) that awareness of biomedical care has increased over the time period that the MJP has been active. Yet what is driving the trend that we are seeing? One possibility might be that the topic itself is changing over time; that is, the very language that people use to discuss death and AIDS has evolved. If so, that might explain the decline in the topic as language shifts. Another possible explanation is that public discourse about AIDS has shifted in content: are narratives about suffering in decline while narratives of recovery and treatment are ascendant? And if so, does this shift translate into increasing knowledge of, access to, or receptivity towards treatment? Or does the increasing frequency of discussion reflect suspicion regarding new treatment options (Kaler and Watkins 2010)? Further qualitative analysis would be necessary to understand how Malawians interpret treatment and ARVs beyond the rhetoric of development agencies, and whether and how these understandings of treatment are linked to the decreasing prevalence of the topic of death and AIDS. Discovering the topic-metadata relationship – in this case, a temporal trend assessed by year – could serve to motivate further qualitative inquiry.
10 See DiMaggio, Nag, and Blei (2013) for a case study in cultural sociology.
11 We use a 30-topic unstemmed model for this specific analysis, as opposed to the 35-topic stemmed model
Figure 3: Proportion of the corpus related to topics over time, ‘dying, AIDS’ versus ‘ARVs, health’
Notes:The lines represent smoothed trends, with 95% confidence intervals represented by the outer lines.
The Y-axis represents the proportion of the corpus that relates to this topic at a particular point in time. The X-axis represents the date on which the journalist wrote about the conversational incident – within a few days of when the incident itself occurred. Among the most common words in the ‘dying, AIDS’ topic are: AIDS, disease, dying.
Among the most common words in the ‘ARVs, health’ topic are: ARVs, town, health, work, village, research.
Lastly, although we have only presented analyses along single external variables (gender in Figure 2 and time in Figure 3), we can imagine conducting analysis of combinations of external variables, such as viewing trends in gender or journalist over time. Given the numerous ways in which external variables can be combined and recombined, analyzing all the different patterns in combinations of external variables by hand is impractical. Automated text analysis enables the researcher to study such patterns and adjudicate among them.
4.3 Addressing problems of opacity
4.3.1 Data sharing
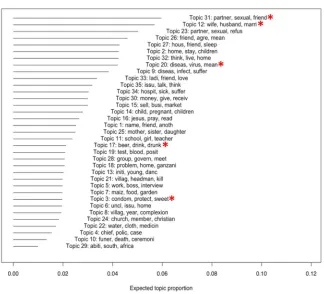
Qualitative researchers who wish to make data accessible often face restrictions due to the need to maintain confidentiality. While these concerns about privacy are themselves the subject of intense debate (Duneier 1999; Jerolmack and Murphy 2017), automated text analysis may be able to provide at least some measure of transparency, even for highly sensitive data. By making the results of topic models publicly available, researchers may be able to share the basic structure of text data – broader trends and topical content – without sacrificing anonymity. This would be especially useful in cases where the privacy of identifiable subjects may be compromised by sharing full blocks of text. As an example, Figure 4 presents a ‘summary’ output of our key topic model. It describes the MJP corpus in terms of a distribution of topics: for example, we see that Topic 31, ‘Sexual desire and risk,’ comprises an estimated 6% of the full MJP corpus. We mark the topics we report in this paper with red asterisks.
Crucially, Figure 4 also allows for comparison of relative proportions of different topics within the corpus. We found that ‘Sexual Desire & Risk,’ ‘Marital Risk,’ and ‘Folk Epidemiology’ are among the most discussed topics in the corpus. This description lends weight to the qualitative analysis of these topics not as marginal issues but as central to rural cultural understandings of AIDS. Sharing this output reveals something of the structure of the data, without giving away any information about its content.
Figure 4 demonstrates but one of the many ways automated text analysis allows researchers to share information about the structure of the data without revealing sensitive information. Each of the other figures we report could also be used as a way to share partial information about otherwise sensitive data.
Figure 4: Summary of all 35 ‘topics’ from our main model, the stemmed structural topic model, showing the three most frequent words and the average document topic proportion in the corpus, with key topics discussed in this article marked by a red asterisk
Notes: The horizontal lines to the left represent the proportion of the corpus that is related to each topic. Topic numbers correspond to the stemmed structural topic model output with 35 topics. Topics discussed in this article are highlighted in red and correspond to the following names used throughout the manuscript:
4.3.2 Supporting making transparent claims
In addition to making the data accessible, a problem that plagues qualitative researchers is how to make analysis transparent given the lack of a widely shared and directly replicable methodology. To address this, we suggest sharing the code12 used to perform
the automated text analysis. The researcher may even point to intermediary analysis that led her to pursue one analytic path as opposed to others. This allows for an easy-to-share organization of large amounts of qualitative data. Interested researchers can sift through topics and metadata patterns to independently assess data, claims, and possible alternative interpretations, and they can try to reconstruct the particular path the author took in her analysis. We imagine interactive data visualizers such as stmBrowser (Figure 1) will be helpful for this process.
In addition to addressing the problem of external comparisons during the research process, automated text analysis can be employed post hoc to support the validity of qualitative claims. A common critique of qualitative analysis is that quotes are ‘cherry-picked’ or that the excerpts that a researcher chooses to highlight may not be representative of the corpus as a whole. For example, if some interviewees express their ideas more eloquently than others it is tempting to use quotations primarily from these individuals. While this may be perfectly valid, it is incumbent on the researcher to ensure that alternate perspectives are not left out, or at least to be forthright when drawing examples from a limited set of interviewees. In the MJP, some journalists are simply better writers than others and can recreate a scene more vividly, and a few highly prolific journalists contribute substantially more texts than all others combined. Automated text analysis facilitates the process of “inconvenience sampling” (Duneier 2011) by making legible the relative distribution of documents according to metadata, ensuring that documents from particular authors, time periods, and genders are not left out.
These methods can also support broader claims of generalizability, for example, by showing that a given theme was discussed across interviewees or time without requiring a researcher to include quotes from each source or period. Returning to Figure 1, we see that while female journalists discuss ‘marital risk’ more frequently, the topic is evenly distributed across author and gender, confirming that this topic is not idiosyncratic to a single journalist or gender. This is reassuring, as a study of marital risk would greatly benefit from the varied perspectives of both men and women. Finally, a topic that is influenced largely by a single individual does not sound a death knell for qualitative analysis of this topic; instead, it is something the researcher should take into consideration when conducting and reporting their analysis.
12 We do so in the replicable material provided on theDemographic Research website to supplement this
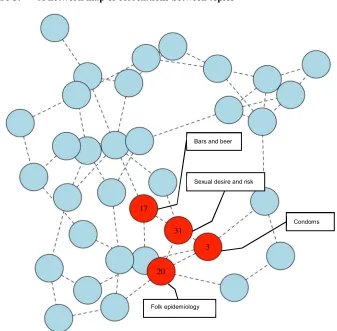
In addition to contextualizing the prevalence of themes or topics according to metadata variables, automated text analysis can assist in making more complex claims transparent. For example, Frye and Gheihman (2015) document how men assemble categories of risk, work out alternative understandings of female attractiveness, and engage in collective responses to the perceived threat of attractive women. We identify a topic in our model output centering on discussions of sexual desire, attraction, and risk – a topic which, as Figure 3 shows, skews heavily male, consistent with the analysis of Frye and Gheihman (2015). Figure 5 presents a network of topic correlations and shows a close correlation between ‘Folk epidemiology’ (Topic 20) and ‘Sexual desire and risk’ (Topic 31), again consistent with the analysis of Frye and Gheihman (2015). Interestingly, Figure 5 also points to several other topics that appear to be connected to the topic of ‘Sexual desire and risk.’ ‘Condoms’ (Topic 3) is perhaps not surprising. Though ‘Bars and beer’ (Topic 17) may seem odd at first glance, this correlation is again consistent with Frye and Gheihman (2015), in that many such discussions took place in male-gendered spaces such as bars and markets.
Figure 5: A network map of correlations between topics
Notes:This network map visualizes the topic correlation matrix from our key topic model. High correlation between topics implies that the topics often appear in the same document; if one topic is observed, the correlation gives a measure of the chance that the other topic will also be observed in the same document. The dotted lines link topics that are correlated at at least a=0.05 level of significance.
Frye and Gheihman (2015) focus on the relationship between Folk Epidemiology (Topic 20) and Sexual Desire & Risk (Topic 31). Interestingly, we also find a topic cohering around drinking and bars (Topic 17) to be closely related to the topic of sexual risk – consistent with the understanding that topics about female beauty, sexuality, and risk often take place in male-dominated settings such as bars.
Among the most common words in the ‘Bars and beer’ topic (#17) are: beer, drink, prostitute, bottle, enjoy.
Among the most common words in the ‘Sexual desire and risk’ topic (#31) are: partner, sexual, friend, girl, sleep, marri, faith. Among the most common words in the ‘Condoms’ topic (#3) are: condom, protect, sweet, driver, plain, feel, without Among the most common words in the ‘Folk epidemiology’ topic (#20) are: virus, spread, cause, intercourse, razor.
Bars and beer
Sexual desire and risk
Folk epidemiology
5. Conclusions
In this article we analyze the text corpus of the Malawi Journals Project, using structural topic models to offer a conceptual framework for linking quantitative text analysis to traditional qualitative analysis of text. We aim to provide a touchstone for a mixed methods approach to the analysis of text. While general enough to be applied to qualitative data beyond demography, we suggest that automated text analysis has special application to qualitative demographic research due to its ability to facilitate analysis of large data sets and to incorporate metadata into the analytic process.
Automated text analysis has three key advantages over traditional qualitative methods in identifying themes: it is significantly faster, it is systematic, and it offers techniques for transparent communication of method and claims. These three advantages, in turn, help address three pervasive sets of problems in qualitative methodology: problems of excess, problems of external comparisons, and problems of opacity. Quantitative text analysis provides an inroad for qualitative researchers to make use of ‘big data’ in text without becoming overwhelmed by the sheer magnitude of available data. Systematic association of documents with metadata will help qualitative researchers address the problems of preconception and temporality commonly associated with external comparisons. Lastly, quantitative text analysis can help qualitative research move in the direction of more ‘open’ research by facilitating data sharing, transparency of method, and transparency of making claims.
We see a number of implications stemming from a mixed methods approach to qualitative analysis. First, greater cross-methodological collaboration will help qualitative researchers in pre-processing text, a stage that may pose a challenge to researchers unfamiliar with coding. Such collaboration would also help developers of tools of quantitative text analysis to engage with the specific needs of qualitative researchers. For example, we suggest that software developers could construct a tool to help researchers with limited coding experience substantively sample documents based on topic, topic correlations, and/or metadata relationships.
Second, quantitative text analysis not only opens up new sources of ‘big data’ to qualitative research but also allows researchers to revisit old data and old research questions. It may help validate old findings, and it may also assist researchers in uncovering previously unreported patterns or findings. For example, in our exploration of the MJP corpus, a corpus well-mined in the literature, we were able to systematically tease out documents related to folk epidemiology, an understudied topic in the MJP literature relative to its importance in demography.
be time trends, relationships between themes, or relationships between themes and metadata. For example, the increase in discussion of ARVs shown in Figure 3 does not necessarily imply a positive reception of ARVs in rural Malawi. Qualitative analysis of the text could uncover the different ways in which rural Malawians interpret the role of ARVs in the AIDS crisis.
Lastly, we wish to emphasize that structural topic modeling is but one particular approach to quantitative text analysis. Virtually any rule-based approach to the analysis of text can be incorporated into a quantitative text model, and numerous other tools already exist that will enable qualitative researchers to creatively and productively interface with computational analysis. For example, supervised methods allow a researcher to qualitatively code a subsample of text, ‘train’ an automated text model on the researcher’s own classification scheme, and apply the model to the remainder of the sample frame of text (Thomas, Pang, and Lee 2006). Such methods work best if the researcher knows what she is looking for in the text and if the subsample and full sample are guaranteed to be similar enough to generate valid results. Another promising class of methods is sentiment analysis (Pang and Lee 2008), which allows the researcher to classify texts based on the emotional valence of the language used. In each case, it will be important to take an explicitly mixed-methods approach and to consider how these new tools can augment the methods and analytic perspectives that qualitative researchers already employ.
References
Abbott, A. (2014). The problem of excess.Sociological Theory 32(1): 1–26.doi:10.11 77/0735275114523419.
Abramson, C.M. and Dohan, D. (2015). Beyond text: Using arrays to represent and analyze ethnographic data. Sociological Methodology 45(1): 272–319. doi:10. 1177/0081175015578740.
Angotti, N., Frye, M., Kaler, A., Poulin, M., Watkins, S.C. and Yeatman, S. (2014). Popular moralities and institutional rationalities in Malawi’s struggle against AIDS. Population and Development Review 40(3): 447–473. doi:10.1111/j. 1728-4457.2014.00693.x.
Armstrong, D., Gosling, A., Weinman, J., and Marteau, T. (1997). The place of inter-rater reliability in qualitative research: An empirical study. Sociology 31(3): 597–606.doi:10.1177/0038038597031003015.
Ashforth, A. and Watkins, S. (2015). Narratives of death in rural Malawi in the time of AIDS.Africa 85(2): 245–268.doi:10.1017/S0001972015000017.
Biernacki, R. (2012). Reinventing evidence in social inquiry: Decoding facts and variables. New York: Palgrave Macmillan.doi:10.1057/9781137007285. Campbell, J.L., Quincy, C., Osserman, J., and Pedersen, O.K. (2013). Coding in-depth
semistructured interviews: Problems of unitization and intercoder reliability and agreement. Sociological Methods and Research 42(3): 294–320. doi:10.1177/ 0049124113500475.
Chang, J., Gerrish, S., Wang, C., Boyd-Graber, J.L., and Blei, D.M. (2009). Reading tea leaves: How humans interpret topic models. In: Bengio, Y., Schuurmans, D., Lafferty, J.D., Williams, C.K.I., and Culotta, A. (eds.). Advances in neural information processing systems 22. 288–296.
Chimbiri, A.M. (2007). The condom is an ‘intruder’ in marriage: Evidence from rural Malawi. Social Science and Medicine 64(5): 1102–1115. doi:10.1016/j.socsci med.2006.10.012.
Conroy, A., Yeatman, S., and Dovel, K. (2013). The social construction of AIDS during a time of evolving access to antiretroviral therapy in rural Malawi. Culture, Health and Sexuality 15(8): 924–937.doi:10.1080/13691058.2013.791057. DiMaggio, P., Nag, M., and Blei, D.M. (2013). Exploiting affinities between topic
models and the sociological perspective on culture: Applications to newspaper coverage of U.S. government arts funding.Poetics 41: 570–606.
Duneier, M. (1999).Sidewalk. New York: Farrar, Straus and Giroux.
Duneier, M. (2011). How not to lie with ethnography.Sociological Methodology 41(1): 1–11.doi:10.1111/j.1467-9531.2011.01249.x.
Elder, G.H., Jr. (1974). Children of the Great Depression: Social change in life experience. Chicago: University of Chicago Press.
Elman, C. and Kapiszewski, D. (2014). Data access and research transparency in the qualitative tradition. PS: Political Science and Politics 47(1): 43–47. doi:10.10 17/S1049096513001777.
Freeman, M.K., Chuang, J., Roberts, M.E., Stewart, B.M., and Tingley, D. (2016). stmBrowser: Structural Topic Model Browser. R Package Version 1.0 [electronic resource].http://www.structuraltopicmodel.com.
Freese, J. (2007). Replication standards for quantitative social science: Why not sociology? Sociological Methods and Research 36(2): 153–172. doi:10.1177/ 0049124107306659.
Friese, S. (2014).Qualitative data analysis with ATLAS.ti. Thousand Oaks: Sage. Frye, M. and Gheihman, N. (2015). Bees to a flower: Men’s activation of sexual culture
in Malawi. Paper presented at the Union of African Population Scientists African Population Conference, Johannesburg, South Africa, November 30– December 4, 2015.
Grimmer, J. and Stewart, B.M. (2013). Text as data: The promise and pitfalls of automatic content analysis methods for political texts. Political Analysis 21(3): 267–297.doi:10.1093/pan/mps028.
Hoffman-Goetz, L., Friedman, D.B., and Clarke, J.N. (2005). HIV/AIDS risk factors as portrayed in mass media targeting First Nations, Métis, and Inuit peoples of Canada. Journal of Health Communication 10(2): 145–162. doi:10.1080/108 10730590915119.
Jerolmack, C. and Murphy, A.K. (2017). The ethical dilemmas and social scientific trade-offs of masking in ethnography. Sociological Methods and Research.
doi:10.1177/0049124117701483.
Kaler, A. and Watkins, S. (2010). Asking God about the date you will die: HIV testing as a zone of uncertainty in rural Malawi. Demographic Research 23(32): 905– 932.doi:10.4054/DemRes.2010.23.32.
King, G., Keohane, R.O., and Verba, S. (1994). Designing social inquiry: Scientific inference in qualitative research. Princeton: Princeton University Press.
Knodel, J.E. (1974). The decline of fertility in Germany, 1871–1939. Princeton: Princeton University Press.
Kolbe, R.H. and Burnett, M.S. (1991). Content-analysis research: An examination of applications with directives for improving research reliability and objectivity.
Journal of Consumer Research 18(2): 243–250.doi:10.1086/209256.
May, C., Allison, G., Chapple, A., Chew-Graham, C., Dixon, C., Gask, L., Graham, R., Rogers, A., and Roland, M. (2004). Framing the doctor-patient relationship in chronic illness: A comparative study of general practitioners’ accounts.
Sociology of Health and Illness 26(2): 135–158.doi:10.1111/j.1467-9566.2004. 00384.x.
Miguel, E., Camerer, C., Casey, K., Cohen, J., Esterling, K.M., Gerber, A., Glennerster, R., Green, D.P., Humphreys, M., Imbens, G., Laitin, D., Madon, T., Nelson, L., Nosek, B.A., Peterson, M., Sedlmayr, R., Simmons, J.P., Simonsohn, U., and Van der Laan, M. (2014). Promoting transparency in social science research.
Science 343(6166): 30–31.doi:10.1126/science.1245317.
Obermeyer, C.M. (1997). Qualitative methods: A key to a better understanding of demographic behavior? Population and Development Review 23(4): 813–818.
doi:10.2307/2137381.
Randall, S. and Koppenhaver, T. (2004). Qualitative data in demography: The sound of silence and other problems. Demographic Research 11(3): 57–94. doi:10.4054/ DemRes.2004.11.3.
Roberts, M.E., Stewart, B.M., and Tingley, D. (2017). stm: R package for structural topic models. R Package Version 1.2.2 [electronic resource].
http://www.structuraltopicmodel.com.
Roberts, M.E., Stewart, B.M., Tingley, D., Lucas, C., Leder-Luis, J., Gadarian, S.K., Albertson, B., and Rand, D.G. (2014). Structural topic models for open-ended survey responses. American Journal of Political Science 58(4): 1064–1082.
doi:10.1111/ajps.12103.
Ryan, G.W. and Bernard, H.R. (2003). Techniques to identify themes.Field Methods
15(1): 85–109.doi:10.1177/1525822X02239569.
Schatz, E. (2005). ‘Take your mat and go!’: Rural Malawian women’s strategies in the HIV/AIDS era. Culture, Health and Sexuality 7(5): 479–492.doi:10.1080/1369 1050500151255.
Schatz, E. (2012). Nesting semi-structured interviews in surveys or censuses: More than the sum of the parts.Population Studies 66(2): 183–195.doi:10.1080/00324728. 2012.658851.
Small, M.L. (2009). ‘How many cases do I need?’: On science and the logic of case selection in field-based research. Ethnography 10(1): 5–38. doi:10.1177/1466 138108099586.
Smith, K.P. and Watkins, S.C. (2005). Perceptions of risk and strategies for prevention: Responses to HIV/AIDS in rural Malawi. Social Science and Medicine 60(3): 649–660.doi:10.1016/j.socscimed.2004.06.009.
Stadler, J.J. (2003). The young, the rich, and the beautiful: Secrecy, suspicion and discourses of AIDS in the South African lowveld. African Journal of AIDS Research 2(2): 127–139.doi:10.2989/16085906.2003.9626567.
Taddy, M. (2012). On estimation and selection for topic models. In: Lawrence, N.D. and Girolami, M. (eds.).Proceedings of the Fifteenth International Conference on Artificial Intelligence and Statistics. 1184–1193.
Thomas, M., Pang, B., and Lee, L. (2006). Get out the vote: Determining support or opposition from Congressional floor-debate transcripts. In: Proceedings of the 2006 Conference on Empirical Methods in Natural Language Processing. 327– 335.doi:10.3115/1610075.1610122.
Trinidad, J.P., Warner, M., Bastian, B.A., Minino, A.M., and Hedegaard, H. (2016). Using literal text from the death certificate to enhance mortality statistics: Characterizing drug involvement in deaths. National Vital Statistics Reports
65(9): 1–15.
Verheijen, J. (2013).Balancing men, morals and money: Women’s agency between HIV and security in a Malawi village. Leiden: African Studies Centre.
Wallach, H.M., Murray, I., Salakhutdinov, R., and Mimno, D. (2009). Evaluation methods for topic models. In: Bottou, L. and Littman, M. (eds.).Proceedings of the 26th Annual International Conference on Machine Learning. 1105–1112.
doi:10.1145/1553374.1553515.
Watkins, S.C. (2004). Navigating the AIDS epidemic in rural Malawi.Population and Development Review 30(4) 673–705.doi:10.1111/j.1728-4457.2004.00037.x. Watkins, S.C. and Swidler, A. (2009). Hearsay ethnography: Conversational journals as
a method for studying culture in action.Poetics 37(2): 162–184.doi:10.1016/j. poetic.2009.03.002.
Woods, M., Paulus, T., Atkins, D.P., and Macklin, R. (2016). Advancing qualitative research using qualitative data analysis software (QDAS)? Reviewing potential versus practice in published studies using ATLAS.ti and NVivo, 1994–2013.