DEMOGRAPHIC RESEARCH
VOLUME 35, ARTICLE 43, PAGES 1259
−
1302
PUBLISHED 10 NOVEMBER 2016
http://www.demographic-research.org/Volumes/Vol35/43/ DOI: 10.4054/DemRes.2016.35.43
Research Article
Does the number of siblings affect health in
midlife? Evidence from the Swedish Prescribed
Drug Register
Anna Baranowska-Rataj
Xavier de Luna
Anneli Ivarsson
©2016 Anna Baranowska-Rataj, Xavier de Luna & Anneli Ivarsson. This open-access work is published under the terms of the Creative Commons Attribution NonCommercial License 2.0 Germany, which permits use, reproduction & distribution in any medium for non-commercial purposes, provided the original author(s) and source are given credit.
1 Introduction 1260
2 Theoretical background 1261
3 Swedish context 1263
4 Study design 1264
4.1 Data 1264
4.2 Methods 1266
5 Empirical results 1269
5.1 Descriptive statistics 1269
5.2 Instrumental variable models: Results from the first stage 1271 5.3 Instrumental variable models: Results from the second stage 1273
6 Summary and discussion 1277
7 Acknowledgments 1279
References 1280
Does the number of siblings affect health in midlife?
Evidence from the Swedish Prescribed Drug Register
Anna Baranowska-Rataj1
Xavier de Luna2
Anneli Ivarsson3
Abstract
BACKGROUND
In many societies, growing up in a large family is associated with receiving less parental time, attention, and financial support. As a result, children with a large number of siblings may have worse physical and mental health outcomes than children with fewer siblings.
OBJECTIVE
Our objective is to examine the long-term causal effects of sibship size on physical and mental health in modern Sweden.
METHODS
We employ longitudinal data covering the entire Swedish population from the Multigenerational Register and the Medical Birth Register. This data includes information on family size and on potential confounders such as parental background. We use the Prescribed Drug Register to identify the medicines that have been prescribed and dispensed. We use instrumental variable models with multiple births as instruments to examine the causal effects of family size on the health outcomes of children, as measured by receiving medicines at age 45.
RESULTS
Our results indicate that in Sweden, growing up in a large family does not have a detrimental effect on physical and mental health in midlife.
CONTRIBUTION
We provide a systematic overview of the health-related implications of growing up in a large family. We adopt a research design that gives us the opportunity to make causal inferences about the long-term effects of family size. Moreover, our paper provides
evidence on the links between family size and health outcomes in the context of a developed country that implements policies oriented towards reducing social inequalities in health and other living conditions.
1. Introduction
The relationship between family size and child well-being has been a central topic in population studies (Steelman et al. 2002; Van Bavel et al. 2011). The issue has also attracted considerable attention from policymakers concerned about the ways in which fertility and population growth affect life chances (Schultz 2007).
According to the most influential theories, parental resources are diluted in a large family because they are distributed across a large number of siblings (Becker and Lewis 1973; Becker and Tomes 1976; Blake 1981; Downey 2001). Hence, parents may face a trade-off between the number of children they have and the life chances of their children. While theoretical models provide clear hypotheses regarding the link between the number of siblings and health, empirical research on this topic has been rather limited (Schultz 2007). The few existing studies have confirmed the assumption that in developing or low- and middle-income countries, large families may indeed face the consequences of resource dilution (Glick, Marini, and Sahn 2007; Millimet and Wang 2011; Rosenzweig and Zhang 2009; Hesketh, Qu, and Tomkins 2003; Smith et al. 2009; Hatton and Martin 2010; Öberg 2015).
These studies have provided a picture of the consequences of growing up in a large family under harsh economic conditions. However, resource dilution in a large family is moderated by the societal and the economic context, and may weaken as a country reaches a higher level of development (Öberg 2015). There has been some research on the question of how family size affects health outcomes in rich, developed countries, but the few existing studies have generated mixed results (for a detailed overview, see Baranowska-Rataj, Barclay, and Kolk 2016). Hence, the question of whether growing up in a large family negatively affects health in affluent societies remains open.
number of siblings on the physical and the mental health of individuals in midlife; i.e., at age 45. We use information on receiving drug prescriptions as a proxy for health outcomes. To take into account the potential endogeneity of the number of siblings, we use instrumental variable models with multiple births as a source of exogenous variation in family size. These models allow us to identify the causal effects under the presence of unobserved characteristics that simultaneously affect family size and health.
2. Theoretical background
Family background is generally seen as being a crucial element of individual well-being, both early in life and in adulthood (Steelman et al. 2002). A number of very well established theoretical models from a range of social science disciplines have examined the mechanisms through which children who are raised in a large family tend to be less advantaged than children with fewer siblings. According to the sociological theories, parental time, attention, and material support are crucial components of child development (Blake 1981; Downey 2001). When parents have additional children to raise, the material and the non-material resources the family can allocate to each child are reduced. Thus, growing up in a large family is associated with lower levels of economic status, health, and other life chances. Economists generally have a similar view of the relationship between sibship size and child well-being. According to economic theories, parents may be expected to make rational decisions regarding both the number of children they have and the investment they make in the human capital of their children, with health representing one of the crucial dimensions of human capital (Becker 2007). These decisions are subject to budget constraints, which means that parents face a trade-off between increasing their family size and investing in the well-being of their children (Becker and Tomes 1976; Becker and Lewis 1973). An implication of this model is that an exogenous increase in family size should result in a decrease in parental investment in each child’s human capital and health.
to devote sufficient attention to monitoring their children’s activities, which may result in injuries (Hjern, Ringbäck-Weitoft, and Andersson 2001). Parents play a key role in helping their children develop and maintain healthy eating and physical activity habits that can prevent them from becoming overweight or obese in adolescence and beyond (Pearson, Biddle, and Gorely 2009; Lindsay et al. 2006). Yet parents who are responsible for a large number of offspring may lack the financial resources and the time needed to ensure that their children eat healthy food. Thus, the nutritional status of children in a large family may be lower than average.
However, some scholars have argued that having a large number of siblings can have a positive impact on child health. For example, according to the hygiene hypothesis, children in a large family may have more exposure than children in a small family to minor infections early in life, which could strengthen their immune systems and help protect them from contracting more serious infections later in life (Strachan 2000). Moreover, siblings can be regarded not only as competitors for parental resources, but also as sources of support: i.e., siblings may protect and care for each other, which could have a positive impact on physical and mental health (Moor and Komter 2011; Eriksen and Gerstel 2002). In addition, siblings may offer each other companionship and support beyond the early life course stages, into adulthood and even into old age (White 2001). Hence, having a large number of siblings may have a positive impact on some dimensions of health. In order to gain a full picture of the health implications of growing up in a large family, our analysis must therefore consider a variety of outcomes in different health domains.
and towards other family members.4 Yet if social policies are designed to raise the rates of return on parental investment in child well-being, such a redistributive effect can be prevented. Thus, it is not just the volume of welfare state financial expenditures on support for the family that moderates the magnitude of the trade-off between the quantity and well-being of children, but also the design of the relevant policies.
3. Swedish context
The Swedish welfare state provides substantial support for families with children, including financial and in-kind benefits designed to ensure that the health and childcare needs of families are met. Families with children have access to parental leave schemes (Hoem 2005; Andersson, Hoem, and Duvander 2006), cash child benefits (Björklund 2006), and high-quality childcare (Andersson, Duvander, and Hank 2004). Sweden has a comprehensive institutional system that offers a range of services, including parental education, family counselling, maternity centres, and childcare centres (Lundqvist 2015). Moreover, because public health care services are universal and comprehensive, levels of socioeconomic inequality in the use of health care are low in Sweden (Burström 2002). The Swedish health care system compares favourably with those of many other developed countries in terms of health outcomes and the availability of services across the country. In addition, Sweden has been a forerunner in reducing levels of child morbidity and mortality, and of child injury (Hjern, Ringbäck-Weitoft, and Andersson 2001; Sandin, Sjoberg, and Sparrman 2012).
The Swedish welfare state not only creates favourable conditions for families with children, but also takes direct action to intervene in a family if the children appear to need support. Unlike in many other developed countries, in Sweden the well-being of children is seen as a matter of public interest, and not just as a private concern of the parents (Sandin 1995). Under the Children and Parents Code, children have the right to care, security, and a good upbringing (Sandin 1995). Furthermore, the law states that children cannot be subjected to physical punishment or other forms of degrading treatment. Thus, the law defines the responsibilities of parents and gives the state the right to intervene if a child’s basic needs are not being respected. In addition to enacting laws intended to ensure that the needs of children are met, the government has invested considerable resources into improving the health of children, by, for example, leading a large-scale child welfare campaign involving a wide range of institutions and organisations (Sandin, Sjoberg, and Sparrman 2012; Bergman and Rivara 1991).
4 The assumption that resources may be redistributed away from children receiving welfare state support is
Ensuring the well-being and safety of children has been integral to local planning and development in Sweden since the 1950s. It could thus be argued that in Sweden the state can provide children who grow up in a large family with the resources they need, even if their parents are unable to do so.
Given these considerations, we expect that any negative effect of growing up in a large family on health would be offset in a supportive welfare setting, such as that of Sweden. We therefore hypothesise that in Sweden the number of siblings an individual has will have no impact on his or her health. Moreover, as we anticipate that the resource dilution effects will be negligible, we expect instead to observe that having a greater number of siblings has a positive impact on health later in life. Following the hygiene hypothesis, we expect to find that individuals who were raised in a large family have stronger immune systems and are thus less susceptible to respiratory system infections than individuals who were raised in a small family. Based on the assumption that siblings frequently protect and care for one another late in life, we expect to find that having a greater number of siblings has a positive impact on mental health.
4. Study design
4.1 DataWhile register data is more detailed and accurate than self-reported data on health, it contains information only on medicines that were prescribed by doctors and dispensed by a pharmacy. Recent research that compared the data from the Prescribed Drug Registry with disease incidence and prevalence showed that in Sweden, medicines are largely prescribed and dispensed according to need (Nordin, Dackehag, and Gerdtham 2013; Weitoft et al. 2008). There are, however, some exceptions; for example, antibiotics, hormone replacement drugs, and anti-migraine drugs are used by some socioeconomic subgroups more frequently than would be predicted based on disease incidence and prevalence data. We take this evidence into account when interpreting our findings according to the ATC categories of drugs analysed in this paper.
We examine the impact of family size on the use of drugs according to the ATC categories. Specifically, we look at usage patterns for the following categories of drugs: alimentary tract and metabolism medications (category A); blood and blood-forming organ drugs (category B); dermatologicals (category D); systemic hormonal preparations, excluding sex hormones and insulins (category H); anti-infectives for systemic use (category J); musculoskeletal system medications (category M); antiparasitic products, insecticides, and repellents (category P); respiratory system medications (category R); sensory organ drugs (category S); and psycholeptics and psychoanalepics (category N). Investigating the use of drugs in categories A-S gives us the opportunity to gain insight into the impact of the number of siblings on physical health, and looking at the use of drugs in category N allows us to measure the relationship between family size and the incidence of mental health problems. The dependent variable takes a value of one if an individual was being prescribed drugs of a given category in the calendar year when he or she reached age 45; otherwise, it takes a value of zero.5 Since we use indicators of annual prescriptions of drugs of a given category, we do not capture the degree of the severity of diseases. Obviously, individual symptoms of the diseases in any of these categories can range from very mild and episodic to serious and long lasting. We try to take the severity of symptoms into account in the sensitivity analysis, in which we look at the volume of the prescribed drugs (compare Tables A-2−A-4 in the appendix).
We control for a number of characteristics related to both the child and his or her parental background. We control for the year of birth and the gender of each child. We also include an indicator of birth order, because previous research has shown that children born at higher parities tend to be disadvantaged in terms of health outcomes
5 It would be desirable to examine the health outcomes at a more advanced age; e.g., at age 65 or older.
(Bernsen, de Jongste, and van der Wouden 2003; Modin 2002; Elliott 1992). We control for the mother’s age at the birth of the child. Finally, we use a measure of parental education that indicates the level of education of the best-educated parent. There are several arguments for taking such an approach. First, since the parents of a child co-operate in raising the child, the parent with a higher level of education may support the child with resources that the less-educated parent lacks. Second, as marital homogamy leads to a high degree of correlation of education within couples, we have used a synthetic indicator to solve the problem of potential multicollinearity. Controlling for parental education allows us to take into account the amount of time, attention, and human capital the parents are able to invest in monitoring their child’s activities and healthy development.
4.2 Methods
Testing the hypothesis that there is a trade-off between family size and child health is challenging, because the decision about whether to have another child may be driven by factors that also affect the child’s health. In addition, it is difficult to predict a priori the direction of the bias related to unobserved heterogeneity among children from families of different sizes. For example, the demographic literature has consistently shown that parents with higher socioeconomic status tend to have less children, and that children raised in a family of a higher social class have better health outcomes (Barthold, Myrskylä, and Jones 2012). This would imply that there is positive selection into the group of children raised in a small family, and a risk of overestimating the negative effect of the number of siblings. However, parental health may positively affect the likelihood of reproduction. Meanwhile, through genetic inheritance, parental health may have a positive impact on the health outcomes of children (Jokela et al. 2007; Ramezanzadeh et al. 2004; Holton, Rowe, and Fisher 2011; Emanuel 1986). This would imply that there is a risk of underestimating the potential negative effects of having a large number of siblings. In such cases, standard regression models might produce misleading results. Previous research on the relationship between family size and child well-being has therefore been criticised on methodological grounds; i.e., on the grounds that the methods used uncovered associations rather than causal effects (Black, Devereux, and Salvanes 2005).
chosen (Moffitt 2005; Rassen et al. 2009). In this paper we examine the effect of the number of siblings on child health (as proxied by receiving drug prescriptions) with instrumental variable models that use multiple births as a source of exogenous variation in the number of siblings. While decisions about higher parity births are non-random, experiencing multiple births may be regarded as the outcome of a random process and not as the result of deliberate decisions driven by a calculus based on future child welfare (Rosenzweig and Wolpin 1980). Thus, information on twin births can be applied to identify the impact of the number of siblings on child health using an instrumental variable design. The estimates from instrumental variable models refer only to the subsample of the population who react to the instrument; i.e., to the compliers (Imbens and Angrist 1994; Angrist, Imbens, and Rubin 1996). In the presence of heterogeneous treatment effects, these estimates may differ from the average treatment effect and the average treatment effect for the treated. However, the salient feature of the instrumental variable used in this paper is that it identifies the effect of treatment on the non-treated, since compliance is perfect when a multiple birth occurs (Angrist, Lavy, and Schlosser 2010).
A potential threat to the internal validity of instruments based on multiple births is that a child delivered in a multiple birth is, on average, more likely than a child delivered in a single birth to have a low birth weight and poor health outcomes later in life. This is problematic for the purposes of our analysis because the instrumental variable we use should not have a direct impact on the child’s health outcomes. We therefore apply the solution proposed by Black, Devereux, and Salvanes (2005); i.e., multiple births are utilised to construct the instrumental variable, and children delivered in a multiple birth are then excluded from the sample. The analytical sample includes first-born children who are the older siblings of children delivered in a multiple birth, and the analysis shows the effects of the number of younger siblings on the older siblings’ health outcomes. Another problem is related to the use of in vitro fertilisation, which has been shown to increase the probability of multiple births and to affect child health outcomes (Bergh et al. 1999). We have therefore chosen to focus our analysis on cohorts born before the introduction of in vitro fertilisation, which has been available in Sweden since 1982. Thus, we use data for cohorts born between 1960 and 1965.
The instrumental variable models are estimated using a two-stage least squares (2SLS) estimation procedure.6 These models consist of two equations, each of which takes the form of a linear regression model. In the first equation the dependent variable is the number of siblings, and the explanatory variables include the instrumental
6 These analyses were carried out using the -ivregress- command for instrumental variable models, available
variable as well as the characteristics of the children and their parents.7 The instrument is constructed as a dummy that indicates whether the mother had a multiple birth after a child was born. The second equation models the health outcomes of children as a function of the covariates used in the first stage and the predicted values from the first equation, instead of the endogenous measure of family size. The procedure adjusts the covariance matrix of the coefficients in the second stage in order to provide correct standard errors of estimates.
A limitation of our quasi-experimental identification strategy is that we cannot capture precisely the effects of an increase in family size by one child (Angrist, Lavy, and Schlosser 2010). Moreover, we can examine the effect on an older child of having an extra younger sibling, but not the effect on a younger child of being born into a larger family. We can, however, provide separate estimates across different family sizes. Thus, we run our models for 1) a sample of first-born children in a family with at least two children (n=208 873); 2) a sample of first- and second-born children in a family with at least three children (n=173 205); and, finally, 3) a sample of first-, second-, and third-born children in a family with at least four children (n=75 178). The number of children delivered in a multiple birth amounted to 2,255 in the first sample, 2,067 in the second sample, and 1,036 in the third sample. Thus, using these three models allows us to investigate whether the dilution of resources is more visible when we shift our focus from families with a small number of children to families with a large number of children.
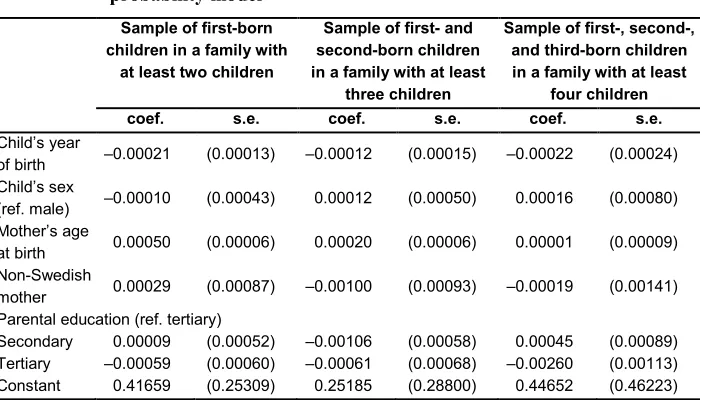
A key assumption in our analysis is that the instrument should be as good as randomly assigned, which means that there should be no association between the parents’ (or the children’s) characteristics and the probability of a multiple birth. In order to provide evidence that there is no such association, we estimated linear regression models with the probability of a multiple birth defined as an outcome, and the parents’ and the children’s characteristics as explanatory variables. We presented the results in Table 1 (the coefficients from regression models were displayed with five decimal points, because otherwise all of them would be equal to zero). The results of this analysis show that even though some of the covariates have a statistically significant impact on the probability of a multiple birth (which is not surprising given the sample size), the strength of the relevant associations is negligible, almost equal to zero. Thus, due to the size of the sample and the negligible effect size, we do not believe this provides evidence against the instrumental assumption.8
7 In principle, if the event of a multiple birth was purely random, including any covariates would not be
necessary. However, the risk of multiple births is known to increase with rising maternal age. Moreover, including covariates increases the precision of instrumental variable estimates (Angrist and Pischke 2008).
Table 1: Dependence between parents’ and children’s characteristics and the probability of having a multiple birth – results from a linear probability model
Sample of first-born children in a family with
at least two children
Sample of first- and second-born children in a family with at least
three children
Sample of first-, second-, and third-born children in a family with at least
four children
coef. s.e. coef. s.e. coef. s.e.
Child’s year
of birth ‒0.00021 (0.00013) ‒0.00012 (0.00015) ‒0.00022 (0.00024) Child’s sex
(ref. male) ‒0.00010 (0.00043) 0.00012 (0.00050) 0.00016 (0.00080) Mother’s age
at birth 0.00050 (0.00006) 0.00020 (0.00006) 0.00001 (0.00009) Non-Swedish
mother 0.00029 (0.00087) ‒0.00100 (0.00093) ‒0.00019 (0.00141) Parental education (ref. tertiary)
Secondary 0.00009 (0.00052) ‒0.00106 (0.00058) 0.00045 (0.00089) Tertiary ‒0.00059 (0.00060) ‒0.00061 (0.00068) ‒0.00260 (0.00113) Constant 0.41659 (0.25309) 0.25185 (0.28800) 0.44652 (0.46223)
Source: Swedish Register Data. Standard errors in parentheses.
5. Empirical results
5.1 Descriptive statisticsTable 2: Probability of drug use at age 45 according to ATC categories (in %) – descriptive statistics
ATC
code ATC category description 1
st born children
in a family with at least 2
children
1st and 2nd born
children in a family with at least 3 children
1st and 2nd and 3rd
born children in a family with at least 4 children
A alimentary tract and metabolism
drugs 11.7 11.6 11.9
B blood and blood-forming organ drugs 5.0 5.0 5.3
D dermatologicals 8.1 7.8 7.7
H systemic hormonal preparations, excl. sex hormones and insulins 5.9 5.8 5.7
J anti-infectives for systemic use 19.6 19.1 18.9
M musculoskeletal system medications 14.2 14.3 14.7
P antiparasitic products, insecticides and repellents 1.6 1.6 1.6
R respiratory system medications 16.2 15.2 14.7 S sensory organs drugs 6.0 5.7 5.4
N psycholeptics and psychoanalepics 13.2 13.3 13.9
Source: Swedish Register Data.
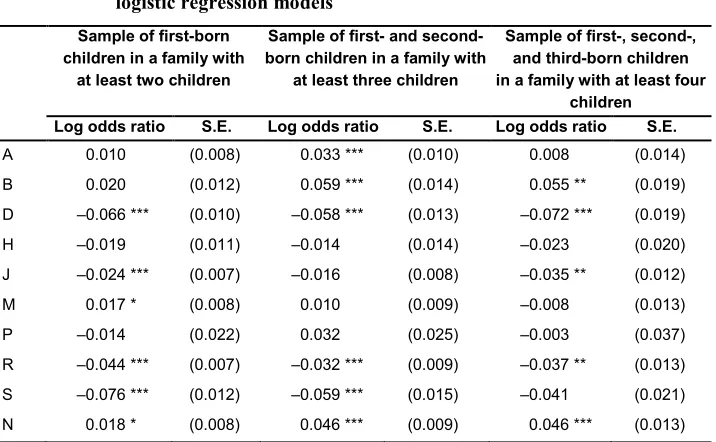
support for the assumption that children with a relatively large number of siblings have fewer problems with allergies and asthma than children raised in a small family.
Table 3: The association between the number of siblings and receiving
medicines according to ATC categories – results from bivariate logistic regression models
Sample of first-born children in a family with
at least two children
Sample of first- and second-born children in a family with
at least three children
Sample of first-, second-, and third-born children in a family with at least four
children
Log odds ratio S.E. Log odds ratio S.E. Log odds ratio S.E.
A 0.010 (0.008) 0.033 *** (0.010) 0.008 (0.014) B 0.020 (0.012) 0.059 *** (0.014) 0.055 ** (0.019) D ‒0.066 *** (0.010) ‒0.058 *** (0.013) ‒0.072 *** (0.019) H ‒0.019 (0.011) ‒0.014 (0.014) ‒0.023 (0.020) J ‒0.024 *** (0.007) ‒0.016 (0.008) ‒0.035 ** (0.012) M 0.017 * (0.008) 0.010 (0.009) ‒0.008 (0.013) P ‒0.014 (0.022) 0.032 (0.025) ‒0.003 (0.037) R ‒0.044 *** (0.007) ‒0.032 *** (0.009) ‒0.037 ** (0.013) S ‒0.076 *** (0.012) ‒0.059 *** (0.015) ‒0.041 (0.021) N 0.018 * (0.008) 0.046 *** (0.009) 0.046 *** (0.013)
Source: Swedish Register Data. Standard errors in parentheses, significance levels: * p<0.05, ** p<0.01, *** p<0.001.
Note: ATC categories as described in Table 2.
5.2 Instrumental variable models: Results from the first stage
parental background. The results from linear regression models, which are presented in Table 4, confirm the relevance of the instrumental variable to family size. In line with previous studies in which a similar analytical strategy was implemented, we find that a multiple birth increases family size by about 0.8 children (Åslund and Grönqvist 2010).
Table 4: Determinants of the number of siblings − results from the first stage
(2SLS estimates)
The number of siblings of first-born children in a family with at
least two children
The number of siblings of first- and second-born children in a family with at least three children
The number of siblings of first-, second-, and third-born children in a family with at least four
children Coef. S.E. Coef. S.E. Coef. S.E. Multiple birth 0.80 *** (0.02) 0.87 *** (0.02) 0.87 *** (0.03) Child’s year of birth ‒0.03 *** (0.00) ‒0.02 *** (0.00) ‒0.02 *** (0.00) Child’s birth order
Second-born 0.16 *** (0.00) 0.12 *** (0.01)
Third-born 0.28 *** (0.01)
Child’s sex (ref. male) ‒0.01 ** (0.00) ‒0.00 (0.00) ‒0.01 (0.01) Mother’s age at birth ‒0.05 *** (0.00) ‒0.04 *** (0.00) ‒0.04 *** (0.00) Non-Swedish Mother 0.07 *** (0.01) 0.06 *** (0.01) 0.08 *** (0.01) Parental education (ref. tertiary)
Primary ‒0.00 (0.00) 0.08 *** (0.00) ‒0.08 *** (0.01) Secondary ‒0.04 *** (0.00) 0.01 ** (0.00) ‒0.10 *** (0.01) Constant 59.01 *** (2.02) 48.86 *** (2.01) 40.91 *** (3.28)
Source: Swedish Register Data.
Notes: Instrumental variable: multiple birth. Standard errors in parentheses. Significance levels: * p<0.05, ** p<0.01, *** p<0.001. ATC categories as described in Table 2.
When we look at the parental background, we see that, as expected, the mother’s age at birth is negatively associated with the number of siblings. Families in which the mother has an immigrant background tend to have more children. There is no clear negative educational gradient in terms of family size, because first-born children raised in a family in which at least one of the parents has a tertiary education tend to have more siblings than first-born children in a family in which the parents have a secondary education only. This pattern is consistent with the findings of previous studies, which have shown that in Sweden, university-educated parents tend to ‘catch up’ with childbearing after having their first child, and thus tend to have a second and a third child more quickly than less-educated parents (Andersson, Hoem, and Duvander 2006).9
9 Conditional on having at least two children, tertiary-educated mothers are more likely to have another child.
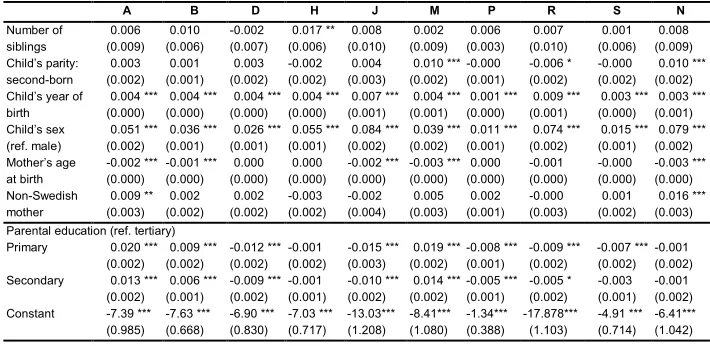
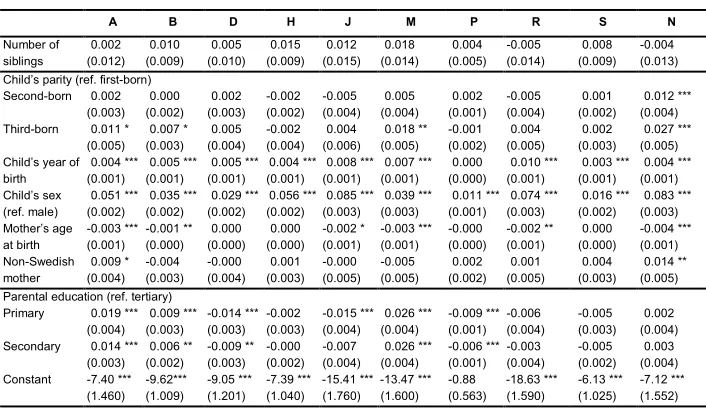
5.3 Instrumental variable models: Results from the second stage
In the second step of our analysis we examine the impact of the number of siblings on the risk of receiving medicines according to the ATC categories in our models, whereby the number of siblings is instrumented by multiple births. In Tables 5, 6, and 7 we present the results of models estimated separately for each of the categories of medicines. We do not find any systematic evidence supporting the hypothesis that the number of siblings has a negative effect on health. There is no effect of the number of siblings on the risk of receiving medicines in the sample of first-born children (Table 5). In the sample of first-born and second-born children (Table 6) we observe a slight increase in the risk of using systemic hormonal drugs among children with a greater number of siblings. In the sample of first-, second-, and third-born children (Table 7), we again do not observe an increased risk of using medicines in any category. Overall, our results do not provide support for the hypothesis that the number of siblings per se negatively affects health in midlife. We do not observe any significant positive effect of the number of siblings on outcomes that could suggest improvements in the immune system, as the children who grew up in large families seem to have levels of risk of taking respiratory system medications and antibiotics that are similar to those of the children who were raised in small families. Hence, the mechanism described by the hygiene hypothesis is not confirmed here. Moreover, we find no indication that having a large number of siblings confers mental health benefits in midlife. The lack of systematic negative effects of the number of siblings is evident, despite the very large samples obtained from register data.
Table 5: Probability of receiving medicines at age 45, according to ATC categories among first-born children in a family with at least two
siblings − results from instrumental variable models (2SLS estimates)
A B D H J M P R S N
Number of
siblings -0.010 (0.009) -0.012 (0.006) -0.001 (0.008) (0.006) 0.002 (0.011) 0.005 -0.003 (0.010) -0.006 (0.003) (0.010) -0.002 (0.007) 0.000 -0.005 (0.009) Child’s year
of birth (0.000) 0.003 *** 0.003 *** 0.003 *** 0.004 *** 0.006 *** 0.004 *** 0.000 (0.000) (0.000) (0.000) (0.001) (0.001) (0.000) (0.001) 0.009 *** 0.002 *** 0.003 *** (0.000) (0.001) Child’s sex
(ref. male)
0.049 *** 0.037 *** 0.027 *** 0.055 *** 0.082 *** 0.038 *** 0.011 *** 0.073 *** 0.017 *** 0.077 *** (0.001) (0.001) (0.001) (0.001) (0.002) (0.002) (0.001) (0.002) (0.001) (0.001) Mother’s age
at birth
-0.003 *** -0.001 *** -0.000 -0.000 -0.001 -0.003 *** -0.000 * -0.001 -0.000 -0.003 *** (0.000) (0.000) (0.000) (0.000) (0.001) (0.000) (0.000) (0.001) (0.000) (0.000) Non-Swedish
mother (0.003) 0.007 * (0.002) 0.002 (0.002) 0.003 -0.002 (0.002) (0.004) -0.000 -0.000 (0.003) (0.001) 0.002 * (0.003) 0.002 (0.002) 0.001 (0.003) 0.008 ** Parental education (ref. tertiary)
Primary (0.002) 0.017 *** 0.007 *** -0.010 *** -0.001 (0.001) (0.002) (0.001) -0.018 *** 0.016 *** -0.006 *** -0.012 *** -0.006 *** -0.006 ** (0.002) (0.002) (0.001) (0.002) (0.001) (0.002)
Secondary (0.002) 0.009 *** 0.005 *** -0.006 *** -0.001 (0.001) (0.002) (0.001) -0.011 *** 0.014 *** -0.005 *** -0.001 (0.002) (0.002) (0.001) (0.002) -0.002 (0.001) -0.006 *** (0.002)
Constant -5.61 *** -5.79 *** -6.22 *** -7.03 *** -11.49 *** -6.89 *** -0.28 (0.969) (0.660) (0.826) (0.709) (1.196) (1.053) (0.379) -18.16 *** -4.82 *** -5.51 *** (1.108) (0.720) (1.016)
Source: Swedish Register Data.
Notes: Standard errors in parentheses, significance levels: * p<0.05, ** p<0.01, *** p<0.001. ATC categories as described in Table 2.
Table 6: Probability of receiving medicines at age 45 according to therapeutic chemical categories among first- and second-born children in a family with at least three siblings − results from instrumental variable models (2SLS estimates)
A B D H J M P R S N
Number of
siblings (0.009) 0.006 (0.006) 0.010 -0.002 (0.007) (0.006) 0.017 ** 0.008 (0.010) (0.009) (0.003) 0.002 0.006 (0.010) 0.007 (0.006) (0.009) 0.001 0.008 Child’s parity:
second-born (0.002) 0.003 (0.001) 0.001 (0.002) 0.003 -0.002 (0.002) (0.003) 0.004 (0.002) (0.001) 0.010 *** -0.000 -0.006 * (0.002) (0.002) (0.002) -0.000 0.010 *** Child’s year of
birth
0.004 *** 0.004 *** 0.004 *** 0.004 *** 0.007 *** 0.004 *** 0.001 *** 0.009 *** 0.003 *** 0.003 *** (0.000) (0.000) (0.000) (0.000) (0.001) (0.001) (0.000) (0.001) (0.000) (0.001) Child’s sex
(ref. male)
0.051 *** 0.036 *** 0.026 *** 0.055 *** 0.084 *** 0.039 *** 0.011 *** 0.074 *** 0.015 *** 0.079 *** (0.002) (0.001) (0.001) (0.001) (0.002) (0.002) (0.001) (0.002) (0.001) (0.002) Mother’s age
at birth
-0.002 *** -0.001 *** 0.000 0.000 -0.002 *** -0.003 *** 0.000 -0.001 -0.000 -0.003 *** (0.000) (0.000) (0.000) (0.000) (0.000) (0.000) (0.000) (0.000) (0.000) (0.000) Non-Swedish
mother (0.003) 0.009 ** 0.002 (0.002) (0.002) 0.002 -0.003 (0.002) -0.002 (0.004) (0.003) (0.001) 0.005 0.002 -0.000 (0.003) (0.002) (0.003) 0.001 0.016 *** Parental education (ref. tertiary)
Primary 0.020 *** 0.009 *** -0.012 *** -0.001 -0.015 *** 0.019 *** -0.008 *** -0.009 *** -0.007 *** -0.001 (0.002) (0.002) (0.002) (0.002) (0.003) (0.002) (0.001) (0.002) (0.002) (0.002) Secondary 0.013 *** 0.006 *** -0.009 *** -0.001 -0.010 *** 0.014 *** -0.005 *** -0.005 * -0.003 -0.001 (0.002) (0.001) (0.002) (0.001) (0.002) (0.002) (0.001) (0.002) (0.001) (0.002) Constant -7.39 *** -7.63 *** -6.90 *** -7.03 *** -13.03*** -8.41*** -1.34*** -17.878*** -4.91 *** -6.41***
(0.985) (0.668) (0.830) (0.717) (1.208) (1.080) (0.388) (1.103) (0.714) (1.042)
Source: Swedish Register Data.
Notes: Standard errors in parentheses, significance levels: * p<0.05, ** p<0.01, *** p<0.001. ATC categories as described in Table 2.
In addition to the analyses presented in Tables 5−7, we carried out sensitivity analyses in order to check the robustness of our results. We re-estimated the models presented in Tables 5−7 using the volume of medicines as the dependent variable, instead of looking at the probability of taking drugs (see Tables A-2−A-4). The volume was measured in terms of the number of daily doses of medicines of a specific category taken in the year in which a given individual turned 45. In addition, we replicated our results for a younger sample that was observed at age 30, using a broader set of control variables including early life health (see Tables A-5−A-7).10
10 Additional control variables for cohorts observed at age 30 included a number of children’s characteristics
Table 7: Probability of receiving medicines at age 45 according to therapeutic chemical categories among first-, second-, and third-born children in a family with at least four siblings − results from instrumental variable models (2SLS estimates)
A B D H J M P R S N
Number of
siblings (0.012) 0.002 (0.009) 0.010 (0.010) 0.005 (0.009) (0.015) 0.015 0.012 (0.014) 0.018 (0.005) 0.004 (0.014) -0.005 (0.009) 0.008 -0.004 (0.013) Child’s parity (ref. first-born)
Second-born 0.002 0.000 0.002 -0.002 -0.005 0.005 0.002 -0.005 0.001 0.012 *** (0.003) (0.002) (0.003) (0.002) (0.004) (0.004) (0.001) (0.004) (0.002) (0.004) Third-born 0.011 * 0.007 * 0.005 -0.002 0.004 0.018 ** -0.001 0.004 0.002 0.027 ***
(0.005) (0.003) (0.004) (0.004) (0.006) (0.005) (0.002) (0.005) (0.003) (0.005) Child’s year of
birth (0.001) 0.004 *** 0.005 *** 0.005 *** 0.004 *** 0.008 *** 0.007 *** (0.001) (0.001) (0.001) (0.001) (0.001) (0.000) 0.000 (0.001) 0.010 *** (0.001) 0.003 *** 0.004 *** (0.001) Child’s sex
(ref. male) (0.002) 0.051 *** 0.035 *** 0.029 *** 0.056 *** 0.085 *** 0.039 *** (0.002) (0.002) (0.002) (0.003) (0.003) (0.001) 0.011 *** 0.074 *** (0.003) (0.002) 0.016 *** 0.083 *** (0.003) Mother’s age
at birth -0.003 *** -0.001 ** 0.000 (0.001) (0.000) (0.000) (0.000) (0.001) 0.000 -0.002 * -0.003 *** -0.000 (0.001) (0.000) -0.002 ** (0.001) (0.000) 0.000 -0.004 *** (0.001) Non-Swedish
mother
0.009 * -0.004 -0.000 0.001 -0.000 -0.005 0.002 0.001 0.004 0.014 ** (0.004) (0.003) (0.004) (0.003) (0.005) (0.005) (0.002) (0.005) (0.003) (0.005) Parental education (ref. tertiary)
Primary 0.019 *** 0.009 *** -0.014 *** -0.002 -0.015 *** 0.026 *** -0.009 *** -0.006 -0.005 0.002 (0.004) (0.003) (0.003) (0.003) (0.004) (0.004) (0.001) (0.004) (0.003) (0.004) Secondary 0.014 *** 0.006 ** -0.009 ** -0.000 -0.007 0.026 *** -0.006 *** -0.003 -0.005 0.003 (0.003) (0.002) (0.003) (0.002) (0.004) (0.004) (0.001) (0.004) (0.002) (0.004) Constant -7.40 *** -9.62*** -9.05 *** -7.39 *** -15.41 *** -13.47 *** -0.88 -18.63 *** -6.13 *** -7.12 ***
(1.460) (1.009) (1.201) (1.040) (1.760) (1.600) (0.563) (1.590) (1.025) (1.552)
Source: Swedish Register Data.
Notes: Standard errors in parentheses, significance levels: * p<0.05, ** p<0.01, *** p<0.001.ATC categories as described in Table 2.
subpopulation of children raised by a mother with an immigrant background, the results confirm our idea that the Swedish welfare state system tends to mitigate the consequences of resource dilution in a large family. Moreover, none of the additional analyses revealed a pattern that would contradict our conclusion that the number of siblings has no negative effects on health outcomes in midlife.
6. Summary and discussion
Several theoretical models in the demographic and the epidemiological literature have discussed the reasons why growing up in a large family may have a negative impact on health outcomes. If parents need to distribute their personal attention, time, material resources, and financial support across a large number of children, their investment per child may be more limited than if they had a small number of children. The literature has emphasised that the degree to which the number of siblings impedes the health and well-being of children may depend on the economic and the institutional context (Becke, Murphy, and Tamura 1994; Desai 1995; Maralani 2008; Åslund and Grönqvist 2010; Öberg 2015). It can be argued that in rich and developed nations, where parental resources are not severely limited and can be supplemented with support from the welfare state, children who grow up in a large family are not necessarily disadvantaged.
Empirical research has examined the associations between family size and child health in the context of societies in which parental resources are extremely limited; i.e., mainly in developing countries or in historic periods preceding the development of modern welfare states. Our paper provides evidence on the links between family size and health outcomes in a developed and affluent society with social policies oriented towards eliminating social inequalities in standards of living and health. Instead of describing associations between family size and individual health outcomes, we used the natural experiment of multiple births to examine the causal effects of family size on health outcomes (as proxied by drug prescriptions). We were able to adopt this research design because we have access to an exceptionally large and detailed dataset from Swedish registers. Using this approach allowed us to take into account the possibility that the decision made by parents to have another child may be driven by the factors that also affect the offspring’s health, and to draw causal inferences about the role of family size.
policies help to ensure that children have suitable conditions for development by supporting families and promoting parental involvement.
The contribution of this paper to the literature on the health consequences of growing up in a large family is fourfold. First, in our study we took an interdisciplinary and integrative approach to the analysis of health outcomes. Following recent suggestions from demographic research (Harris 2010), we bridged insights from both the biomedical and the social sciences, and considered a wide range of health outcomes, as proxied by drug prescriptions related to both physical and mental health. Thus, we provided a broad overview of the potential health-related implications of growing up in a large family. Second, we had access to high-quality register data, with samples that were large enough to allow us to use a quasi-experimental research design based on data on twins, and to examine outcomes that are observed in a relatively small fraction of the whole population, such as receiving a prescribed medication. Moreover, our data did not suffer from recall bias or ex-post rationalisations, as may be the case with retrospective or self-reported data. Third, instead of describing associations between family size and child health outcomes, we adopted a research design that gave us the opportunity to make causal inferences about the effects of growing up in a larger family. Finally, our paper provides evidence on the links between family size and health outcomes in the context of a developed country. Sweden is not only one of the richest countries in the world; its policies are oriented towards reducing social inequalities in health and other living conditions. The drawback of our decision to focus on Sweden in this paper is that our findings may not be generalizable to other developed countries that have a less generous welfare state.
While the data used in this study gave us the opportunity to trace the effects of living conditions in childhood on health in midlife, we were unable to observe individual health at very advanced ages. Future research should examine the consequences of health outcomes at higher ages, when the overall incidence of health problems is higher than it is at the age we observed in our analysis. Another limitation is related to selective mortality, as it is possible that only very healthy individuals survived up to the age observed in our analysis. But because the mortality rate among the population under age 45 is very low in Sweden, we do not believe that this issue was problematic for our analysis. For example, in 2013 there were 5−18 deaths per 100,000 among the age group 1−14 and 16−82 deaths per 100,000 individuals among the age group 15−39. These death rates are among the lowest in the European Union (The Institute for Health Metrics and Evaluation 2013, World Health Organization 1998). Given the diverse family formation patterns across Europe, we need to take into account that not all children who are born and raised within the same family have the same parents. This is another limitation of our study, as we focused on siblings who have the same biological mother. Finally, as our register data on health outcomes contains information only on medicines that were prescribed by a doctor and dispensed by a pharmacy, illnesses that were not diagnosed within the health care system or were not treated with a drug requiring a doctor’s prescription are not reflected in the data. However, it could be argued that this concern is less relevant in our study, because, unlike in many other countries, the public health care services in Sweden are universal and comprehensive.
7. Acknowledgements
References
Andersson, G., Duvander, A.-Z., and Hank, K. (2004). Do child-care characteristics influence continued child bearing in Sweden? An investigation of the quantity, quality, and price dimension. Journal of European Social Policy 14(4): 407−418. doi:10.1177/0958928704046881.
Andersson, G., Hoem, J.M., and Duvander, A.-Z. (2006). Social differentials in speed-premium effects in childbearing in Sweden. Demographic Research 14(4):
51−70. doi:10.4054/DemRes.2006.14.4.
Angrist, J. and Pischke, J.-S. (2008). Mostly harmless econometrics: An empiricist's companion. Princeton and Oxford: Princeton University Press.
Angrist, J., Imbens, G., and Rubin, D. (1996). Identification of causal effects using instrumental variables. Journal of the American Statistical Association 91(434): 444−455. doi:10.2307/2291634.
Angrist, J., Lavy, V., and Schlosser, A. (2010). Multiple experiments for the causal link between the quantity and quality of children. Journal of Labor Economics 28(4): 773−824. doi:10.1086/653830.
Arpino, B. and Aassve, A. (2013). Estimating the causal effect of fertility on economic wellbeing: Data requirements, identifying assumptions and estimation methods. Empirical Economics 44(1): 355−385. doi:10.1007/s00181-010-0356-9.
Åslund, O. and Grönqvist, H. (2010). Family size and child outcomes: Is there really no trade-off? Labour Economics 17(1): 130−139. doi:10.1016/j.labeco.2009.
05.003.
Baranowska-Rataj, A., Barclay, K., and Kolk, M. (2016). The effect of the number of siblings on adult mortality: Evidence from Swedish Registers. Population Studies (forthcoming).
Barthold, J.A., Myrskylä, M., and Jones, O.R. (2012). Childlessness drives the sex difference in the association between income and reproductive success of modern Europeans. Evolution and Human Behavior 33(6): 628−638.
doi:10.1016/j.evolhumbehav.2012.03.003.
Becker, G.S. and Lewis, H.G. (1973). On the interaction between the quantity and quality of children. Journal of Political Economy 81(2): S279−288. doi:10.1086/
Becker, G.S. and Tomes, N. (1976). Child endowments and the quantity and quality of children. Journal of Political Economy 84(4): S143−S162. doi:10.3386/w0123. Becker, G.S. (2007). Health as human capital: synthesis and extensions. Oxford
Economic Papers 59(3): 379−410. doi:10.1093/oep/gpm020.
Becker, G.S., Murphy, K.M., and Tamura, R. (1994). Human capital, fertility, and economic growth. In: Becker, G.S. (ed.). Human capital: A theoretical and empirical analysis with special reference to education (3rd edition). Chicago and London: The University of Chicago Press: 323−350.
Bengtsson, T. and Broström, G. (2009). Do conditions in early life affect old-age mortality directly and indirectly? Evidence from 19th-century rural Sweden. Social Science and Medicine 68(9): 1583−1590. doi:10.1016/j.socscimed.2009.
02.020.
Bergh, T., Ericson, A., Hillensjö, T., Nygren, K.G., and Wennerholm, U.B. (1999). Deliveries and children born after in-vitro fertilisation in Sweden 1982–95: A retrospective cohort study. The Lancet 354(9190): 1579−1585. doi:10.1016/
S0140-6736(99)04345-7.
Bergman, A.B. and Rivara, F.P. (1991). Sweden's experience in reducing childhood injuries. Pediatrics 88(1): 69−74.
Bernsen, R.M.D., de Jongste, J.C., and van der Wouden, J.C. (2003). Birth order and sibship size as independent risk factors for asthma, allergy, and eczema. Pediatric Allergy and Immunology 14(6): 464−469. doi:10.1046/j.0905-6157.
2003.00108.x.
Björklund, A. (2006). Does family policy affect fertility? Journal of Population Economics 19(1): 3−24. doi:10.1007/s00148-005-0024-0.
Black, S.E., Devereux, P.J., and Salvanes, K.G. (2005). The more the merrier? The effect of family size and birth order on children's education. The Quarterly Journal of Economics 120(2): 669−700.
Blake, J. (1981). Family size and the quality of children. Demography 18(4): 421−442.
doi:10.2307/2060941.
Blow, L., Walker, I., and Zhu, Y. (2012). Who benefits from child benefit? Economic Inquiry 50(1): 153−170. doi:10.1111/j.1465-7295.2010.00348.x.
Burström, B. (2002). Increasing inequalities in health care utilisation across income groups in Sweden during the 1990s? Health Policy 62(2): 117−129. doi:10.1016/
Desai, S. (1995). When are children from large families disadvantaged? Evidence from cross-national analyses. Population Studies 49(2): 195−210. doi:10.1080/003247
2031000148466.
Downey, D.B. (2001). Number of siblings and intellectual development: The resource dilution explanation. American Psychologist 56(6−7): 497−504. doi:10.1037/000
3-066X.56.6-7.497.
Elliott, B.A. (1992). Birth order and health: Major issues. Social Science and Medicine 35(4): 443−452. doi:10.1016/0277-9536(92)90337-P.
Elo, I.T., Martikainen, P., and Myrskylä, M. (2014). Socioeconomic status across the life course and all-cause and cause-specific mortality in Finland. Social Science and Medicine 119: 198−206. doi:10.1016/j.socscimed.2013.11.037.
Emanuel, I. (1986). Maternal health during childhood and later reproductive performance. Annals of the New York Academy of Sciences 477(1): 27−39.
doi:10.1111/j.1749-6632.1986.tb40318.x.
Eriksen, S. and Gerstel, N. (2002). A labor of love or labor itself care work among adult brothers and sisters. Journal of Family Issues 23(7): 836−856. doi:10.1177/0192
51302236597.
Evans, G.W. (2006). Child development and the physical environment. Annual Review of Psychology 57: 423−451. doi:10.1146/annurev.psych.57.102904.190057. Glick, P.J., Marini, A., and Sahn, D.E. (2007). Estimating the consequences of
unintended fertility for child health and education in Romania: An analysis using twins data. Oxford Bulletin of Economics and Statistics 69(5): 667−691.
doi:10.1111/j.1468-0084.2007.00476.x.
Harris, K.M. (2010). An integrative approach to health. Demography 47(1): 1−22.
doi:10.1353/dem.0.0091.
Hatton, T.J. and Martin, R.M. (2010). The effects on stature of poverty, family size, and birth order: British children in the 1930s. Oxford Economic Papers 62(1): 157−184. doi:10.1093/oep/gpp034.
Hesketh, T., Qu, J., and Tomkins, A. (2003). Health effects of family size: Cross sectional survey in Chinese adolescents. Archives of Disease in Childhood 88(6): 467−471. doi:10.1136/adc.88.6.467.
Hoem, J.M. (2005). Why does Sweden have such high fertility? Demographic Research 13(22): 559−572. doi:10.4054/DemRes.2005.13.22.
Hoem, J.M., Neyer, G., and Andersson, G. (2006). Educational attainment and ultimate fertility among Swedish women born in 1955−59. Demographic Research 14(16): 381−404. doi:10.4054/DemRes.2006.14.16.
Hollander, A.-C., Bruce, D., Burström, B., and Ekblad, S. (2013). The association between immigrant subgroup and poor mental health: A population-based register study. The Journal of Nervous and Mental Disease 201(8): 645−652.
doi:10.1097/NMD.0b013e31829dbd64.
Holton, S., Rowe, H., and Fisher, J. (2011). Women’s health and their childbearing expectations and outcomes: A oopulation-based Survey from Victoria, Australia. Women's Health Issues 21(5): 366−373. doi:10.1016/j.whi.2011.02.006.
Imbens, G. and Angrist, J. (1994). Identification and estimation of local average treatment effects. Econometrica: Journal of the Econometric Society 62(2): 467−475. doi:10.2307/2951620.
Jaine, R., Baker, M., and Venugopal, K. (2011). Acute rheumatic fever associated with household crowding in a developed country. The Pediatric Infectious Disease Journal 30(4): 315−319. doi:10.1097/INF.0b013e3181fbd85b.
Jokela, M., Kivimäki, M., Elovainio, M., Viikari, J., Raitakari, O.T., and Keltikangas-Järvinen, L. (2007). Body mass index in adolescence and number of children in adulthood. Epidemiology 18(5): 599−606. doi:10.1097/EDE.0b013e3181257
158.
Kramers, P.G. (2003). The ECHI project: Health indicators for the European Community. The European Journal of Public Health 13(Suppl. 3): 101−106.
doi:10.1093/eurpub/13.suppl_3.101.
Lindgren, U., Nilsson, K., de Luna, X., and Ivarsson, A. (2016). Data resource profile: Swedish microdata research from childhood into lifelong health and welfare (Umeå SIMSAM Lab). International Journal of Epidemiology 45(4).
doi:10.1093/ije/dyv358.
Lindsay, A.C., Sussner, K.M., Kim, J., and Gortmaker, S.L. (2006). The role of parents in preventing childhood obesity. The Future of Children 16(1): 169−186.
doi:10.1353/foc.2006.0006.
Maralani, V. (2008). The changing relationship between family size and educational attainment over the course of socioeconomic development: Evidence from Indonesia. Demography 45(3): 693−717. doi:10.1353/dem.0.0013.
Mezuk, B., Cederin, K., Li, X., Rice, K., Kendler, K.S., Sundquist, J., and Sundquist, K. (2014). Immigrant enclaves and risk of diabetes: A prospective study. BMC Public Health 14(1): 1093. doi:10.1186/1471-2458-14-1093.
Millimet, D.L. and Wang, L. (2011). Is the quantity-quality trade-off a trade-off for all, none, or some? Economic Development and Cultural Change 60(1): 155−195.
doi:10.1086/661216.
Modin, B. (2002). Birth order and mortality: A life-long follow-up of 14,200 boys and girls born in early 20th century Sweden. Social Science and Medicine 54(7): 1051−1064. doi:10.1016/S0277-9536(01)00080-6.
Moffitt, R. (2005). Remarks on the analysis of causal relationships in population research. Demography 42(1): 91−108. doi:10.1353/dem.2005.0006.
Moor, N. and Komter, A. (2011). Family ties and depressive mood in Eastern and Western Europe. Demographic Research 27(8): 201−232. doi:10.4054/DemRes.
2012.27.8.
Mucci, L.A., Hsieh, C.-C., Williams, P.L., Dickman, P.W., Björkman, L., and Pedersen, N.L. (2004). Birth order, sibship size, and housing density in relation to tooth loss and periodontal disease: A cohort study among Swedish twins. American Journal of Epidemiology 159(5): 499−506. doi:10.1093/aje/kwh063.
Nordin, M., Dackehag, M., and Gerdtham, U.-G. (2013). Socioeconomic inequalities in drug utilization for Sweden: Evidence from linked survey and register data. Social Science and Medicine 77: 106−117. doi:10.1016/j.socscimed.2012.11.
013.
Öberg, S. (2015). Sibship size and height before, during, and after the fertility decline. Demographic Research 32(3): 29−74. doi:10.4054/DemRes.2015.32.2.
Örtqvist, A.K., Lundholm, C., Wettermark, B., Ludvigsson, J.F., Ye, W., and Almqvist, C. (2013). Validation of asthma and eczema in population‐based Swedish drug and patient registers. Pharmacoepidemiology and Drug Safety 22(8): 850−860.
doi:10.1002/pds.3465.
Pearson, N., Biddle, S.J., and Gorely, T. (2009). Family correlates of fruit and vegetable consumption in children and adolescents: A systematic review. Public Health Nutrition 12(02): 267−283. doi:10.1017/S1368980008002589.
Ramezanzadeh, F., Aghssa, M.M., Abedinia, N., Zayeri, F., Khanafshar, N., Shariat, M., and Jafarabadi, M. (2004). A survey of relationship between anxiety, depression and duration of infertility. BMC Women’s Health 4(1): 1−7.
doi:10.1186/1472-6874-4-9.
Rassen, J.A., Brookhart, M.A., Glynn, R.J., Mittleman, M.A., and Schneeweiss, S. (2009). Instrumental variables I: Instrumental variables exploit natural variation in nonexperimental data to estimate causal relationships. Journal of Clinical Epidemiology 62(12): 1226−1232. doi:10.1016/j.jclinepi.2008.12.005.
Rosenzweig, M.R. and Wolpin, K.I. (1980). Testing the quantity-quality fertility model: The use of twins as a natural experiment. Econometrica: Journal of the Econometric Society 48(1): 227−240. doi:10.2307/1912026.
Rosenzweig, M.R. and Zhang, J. (2009). Do population control policies induce more human capital investment? Twins, birth weight and China’s ‘one-child’ policy. The Review of Economic Studies 76(3): 1149−1174. doi:10.1111/j.1467-937X.
2009.00563.x.
Sandin, B. (1995). Split visions, changing childhoods and the welfare state in Sweden: Reflections on the century of the child. Linköping: Linköping University, Working papers on childhood and the study of children, ISSN 1104-6929. Sandin, B., Sjoberg, J., and Sparrman, A. (2012). Situating child consumption:
Rethinking values and notions of children, childhood and consumption. Lund: Nordic Academic Press.
Schultz, T.P. (2007). Population policies, fertility, women’s human capital, and child quality. In: Schultz, T.P. and Strauss, J. (eds.). Handbook of Development Economics. Amsterdam: Elsevier: 3249−3303. doi:10.1016/s1573-4471(07)040
52-1.
Smith, K.R., Mineau, G.P., Garibotti, G., and Kerber, R. (2009). Effects of childhood and middle-adulthood family conditions on later-life mortality: Evidence from the Utah Population Database, 1850–2002. Social Science and Medicine 68(9): 1649−1658. doi:10.1016/j.socscimed.2009.02.010.
Steelman, L.C., Powell, B., Werum, R., and Carter, S. (2002). Reconsidering the effects of sibling configuration: Recent advances and challenges. Annual Review of Sociology 28: 243−269. doi:10.1146/annurev.soc.28.111301.093304.
Strachan, D.P. (2000). Family size, infection and atopy: The first decade of the ‘hygiene hypothesis’. Thorax 55(Suppl. 1): S2. doi:10.1136/thorax.55.suppl_1.S2. The Institute for Health Metrics and Evaluation (2013). Global burden of disease study
2013.
Van Bavel, J., Moreels, S., Matthijs, K., and Van de Putte, B. (2011). Family size and intergenerational social mobility during the fertility transition: Evidence of resource dilution from the city of Antwerp in nineteenth century Belgium. Demographic Research 24(14): 313−343. doi:10.4054/DemRes.2011.24.14. Weitoft, G.R., Rosen, M., Ericsson, Ö., and Ljung, R. (2008). Education and drug use
in Sweden − a nationwide register‐based study. Pharmacoepidemiology and Drug Safety 17(10): 1020−1028. doi:10.1002/pds.1635.
Wettermark, B., Hammar, N., MichaelFored, C., Leimanis, A., Otterblad Olausson, P., Bergman, U., Persson, I., Sundström, A., Westerholm, B., and Rosén, M. (2007). The new Swedish Prescribed Drug Register − opportunities for pharmacoepidemiological research and experience from the first six months. Pharmacoepidemiology and Drug Safety 16(7): 726−735. doi:10.1002/pds.1294. White, L. (2001). Sibling relationships over the life course: A panel analysis. Journal of
Marriage and Family 63(2): 555−568. doi:10.1111/j.1741-3737.2001.00555.x. World Health Organization (1998). Highlights on health in Sweden. Copenhagen:
WHO Regional Office for Europe.
Xu, J. (2008). Sibship size and educational achievement: The role of welfare regimes cross‐nationally. Comparative Education Review 52(3): 413−436.
Appendix
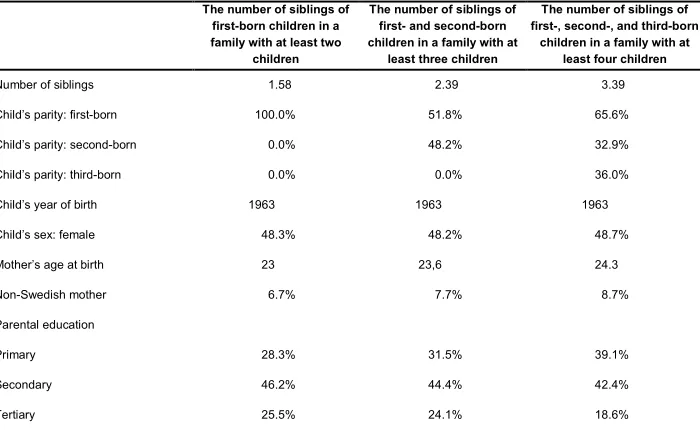
Table A-1: Description of the samples used in the analyses: Variables and their observed averages
The number of siblings of first-born children in a family with at least two
children
The number of siblings of first- and second-born children in a family with at
least three children
The number of siblings of first-, second-, and third-born
children in a family with at least four children
Number of siblings 1.58 2.39 3.39
Child’s parity: first-born 100.0% 51.8% 65.6%
Child’s parity: second-born 0.0% 48.2% 32.9% Child’s parity: third-born 0.0% 0.0% 36.0%
Child’s year of birth 1963 1963 1963
Child’s sex: female 48.3% 48.2% 48.7%
Mother’s age at birth 23 23,6 24.3
Non-Swedish mother 6.7% 7.7% 8.7%
Parental education
Primary 28.3% 31.5% 39.1%
Secondary 46.2% 44.4% 42.4%
Tertiary 25.5% 24.1% 18.6%
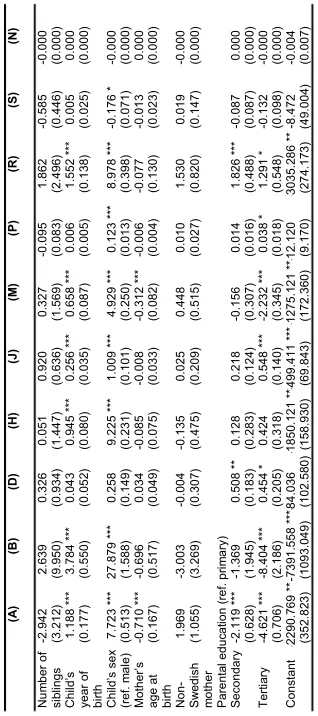
Table A-2: The number of daily doses of medicines received at age 45 according to ATC categories among first-born children in a family with at least two siblings – results from instrumental variable models (2SLS estimates) (A) (B) (D) (H) (J) (M) (P) (R) (S) (N) N um ber of si bl ings -2. 942 2. 639 0. 326 0. 051 0. 920 0. 327 -0. 095 1. 862 -0. 585 -0. 000 (3. 212 ) (9. 950 ) (0. 934 ) (1. 447 ) (0. 636 ) (1. 569 ) (0. 083 ) (2. 496 ) (0. 446 ) (0. 000 ) Ch ild ’s year of bi rth 1. 188 * ** 3. 784 * ** 0. 043 0. 945 * ** 0. 256 * ** 0. 658 * ** 0. 006 1. 552 * ** 0. 005 0. 000 (0. 177 ) (0. 550 ) (0. 052 ) (0. 080 ) (0. 035 ) (0. 087 ) (0. 005 ) (0. 138 ) (0. 025 ) (0. 000 ) Ch ild ’s s ex (r ef . m al e) 7. 723 * ** 27. 879 * ** 0. 258 9. 225 * ** 1. 009 * ** 4. 929 * ** 0. 123 * ** 8. 978 * ** -0. 176 * -0. 000 (0. 513 ) (1. 588 ) (0. 149 ) (0. 231 ) (0. 101 ) (0. 250 ) (0. 013 ) (0. 398 ) (0. 071 ) (0. 000 ) M ot her ’s
age at birth
-0. 710 * ** -0. 696 0. 034 -0. 085 -0. 008 -0. 312 * ** -0. 006 -0. 077 -0. 013 0. 000 (0. 167 ) (0. 517 ) (0. 049 ) (0. 075 ) (0. 033 ) (0. 082 ) (0. 004 ) (0. 130 ) (0. 023 ) (0. 000 ) No n-Sw edi sh m ot her 1. 969 -3. 003 -0. 004 -0. 135 0. 025 0. 448 0. 010 1. 530 0. 019 -0. 000 (1. 055 ) (3. 269 ) (0. 307 ) (0. 475 ) (0. 209 ) (0. 515 ) (0. 027 ) (0. 820 ) (0. 147 ) (0. 000 ) Par ent al educ at ion (ref . pr im ar y) Sec ondar y -2. 119 * ** -1. 369 0. 508 * * 0. 128 0. 218 -0. 156 0. 014 1. 826 * ** -0. 087 0. 000 (0. 628 ) (1. 945 ) (0. 183 ) (0. 283 ) (0. 124 ) (0. 307 ) (0. 016 ) (0. 488 ) (0. 087 ) (0. 000 ) Te rti ary -4. 621 * ** -8. 404 * ** 0. 454 * 0. 424 0. 548 * ** -2. 232 * ** 0. 038 * 1. 291 * -0. 132 -0. 000 (0. 706 ) (2. 186 ) (0. 205 ) (0. 318 ) (0. 140 ) (0. 345 ) (0. 018 ) (0. 548 ) (0. 098 ) (0. 000 ) C ons tant -2290. 769 *
** -7391.
(A) (B) (D) (H) (J) (M) (P) (R) (S) (N) N um ber of si bl ings 2. 965 -3. 133 -0. 394 2. 777 * 0. 238 1. 884 -0. 012 2. 499 0. 019 -0. 000 (3. 095 ) (10. 100 ) (0. 927 ) (1. 391 ) (0. 669 ) (1. 516 ) (0. 074 ) (2. 447 ) (0. 452 ) (0. 000 ) C hi ld’ s pa rit y ( ref . f irst -bo rn) Ch ild ’s p ar ity : sec ond -b or n 1. 077 7. 229 * * 0. 171 0. 038 0. 333 0. 408 0. 016 -0. 983 -0. 075 0. 000 (0. 791 ) (2. 580 ) (0. 237 ) (0. 355 ) (0. 171 ) (0. 387 ) (0. 019 ) (0. 625 ) (0. 116 ) (0. 000 ) C hi ld’ s y ea r of bi rth 1. 611 * ** 4. 478 * ** 0. 068 1. 017 * ** 0. 246 * ** 0. 751 * ** 0. 012 * * 1. 505 * ** 0. 022 0. 000 (0. 179 ) (0. 586 ) (0. 054 ) (0. 081 ) (0. 039 ) (0. 088 ) (0. 004 ) (0. 142 ) (0. 026 ) (0. 000 ) Ch ild ’s s ex (r ef . m al e) 8. 611 * ** 28. 006 * ** 0. 037 9. 069 * ** 0. 832 * ** 4. 817 * ** 0. 129 * ** 9. 097 * ** -0. 140 0. 000 (0. 557 ) (1. 817 ) (0. 167 ) (0. 250 ) (0. 120 ) (0. 273 ) (0. 013 ) (0. 440 ) (0. 081 ) (0. 000 ) M ot her ’s age at b irth -0. 564 * ** -1. 198 * * 0. 029 -0. 039 -0. 074 * -0. 311 * ** -0. 001 -0. 144 0. 011 0. 000 (0. 138 ) (0. 449 ) (0. 041 ) (0. 062 ) (0. 030 ) (0. 067 ) (0. 003 ) (0. 109 ) (0. 020 ) (0. 000 ) No n-Sw edi sh m ot her 2. 257 * 2. 583 -0. 063 0. 079 0. 001 1. 048 * -0. 027 1. 133 -0. 096 -0. 000 (1. 063 ) (3. 470 ) (0. 318 ) (0. 478 ) (0. 230 ) (0. 521 ) (0. 025 ) (0. 841 ) (0. 155 ) (0. 000 ) Par ent al educ at ion ( ref . pr im ar y) Sec ondar y -2. 175 * * -1. 207 -0. 073 0. 036 0. 241 -0. 458 0. 023 1. 227 * -0. 097 -0. 000 (0. 686 ) (2. 237 ) (0. 205 ) (0. 308 ) (0. 148 ) (0. 336 ) (0. 016 ) (0. 542 ) (0. 100 ) (0. 000 ) Te rti ary -5. 175 * ** -9. 947 * ** 0. 286 0. 368 0. 396 * -2. 592 * ** 0. 040 * 1. 214 -0. 279 * -0. 000 (0. 811 ) (2. 645 ) (0. 243 ) (0. 364 ) (0. 175 ) (0. 397 ) (0. 019 ) (0. 641 ) (0. 118 ) (0. 000 ) C ons tant -3137. 522 * ** -8731. 230 * ** -131. 78 8 -1999. 037 * ** -478. 74 3 * ** -1460. 357 * ** -22. 966 ** -2943. 850 * ** -42. 206 -0. 016 (356. 43 7) (1163. 125) (106. 73 2) (160. 21 5) (77. 065 ) (174. 56 9) (8. 512 ) (281. 79 5) (52. 094 ) (0. 011 ) Sour ce : S w edi sh R eg is te r D at a.
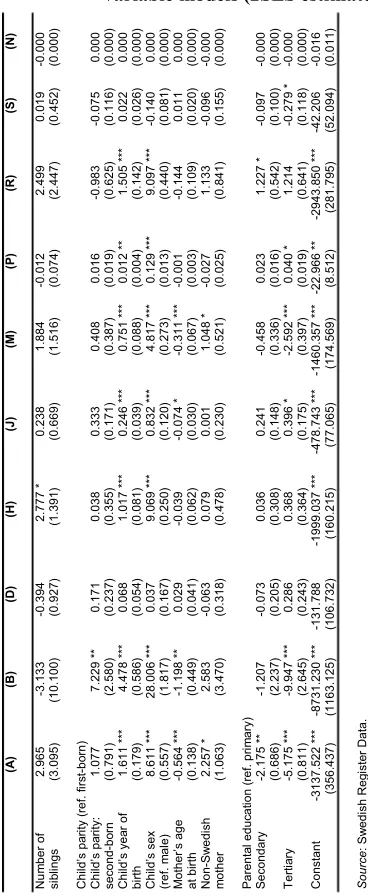
Table A-4: The number of daily doses of medicines received at age 45 according to ATC categories among first-, second-, and third-born children in a family with at least four siblings − results from instrumental variable models (2SLS estimates)
Table A-5: Probability of receiving medicines at age 30, according to ATC categories among first-born children in a family with at least two
siblings − results from instrumental variable models (2SLS estimates)
Table A-6: Probability of receiving medicines at age 30, according to ATC categories among first-born children in a family with at least two
siblings − results from instrumental variable models (2SLS estimates)
Table A-7: Probability of receiving medicines at age 30 according to ATC categories among first-, second-, and third-born children in a family with at least four siblings − results from instrumental variable models (2SLS estimates)