R E V I E W
Open Access
Diagnostic
‘
omics
’
for active tuberculosis
Carolin T. Haas
†, Jennifer K. Roe
†, Gabriele Pollara, Meera Mehta and Mahdad Noursadeghi
*Abstract
The decision to treat active tuberculosis (TB) is dependent on microbiological tests for the organism or evidence of disease compatible with TB in people with a high demographic risk of exposure. The tuberculin skin test and peripheral blood interferon-γrelease assays do not distinguish active TB from a cleared or latent infection. Microbiological culture of mycobacteria is slow. Moreover, the sensitivities of culture and microscopy for acid-fast bacilli and nucleic acid detection by PCR are often compromised by difficulty in obtaining samples from the site of disease. Consequently, we need sensitive and rapid tests for easily obtained clinical samples, which can be deployed to assess patients exposed to TB, discriminate TB from other infectious, inflammatory or autoimmune diseases, and to identify subclinical TB in HIV-1 infected patients prior to commencing antiretroviral therapy. We discuss the evaluation of peripheral blood transcriptomics, proteomics and metabolomics to develop the next generation of rapid diagnostics for active TB. We catalogue the studies published to date seeking to discriminate active TB from healthy volunteers, patients with latent infection and those with other diseases. We identify the limitations of these studies and the barriers to their adoption in clinical practice. In so doing, we aim to develop a framework to guide our approach to discovery and development of diagnostic biomarkers for active TB.
Keywords:Diagnostics, Disease, -Omics, Tuberculosis
Background
Making an early and definitive diagnosis of active tuber-culosis (TB) infection is vital both at the individual and population level, thus reducing morbidity, mortality and transmission. The notoriously pleiotropic presentation of TB disease means that clinicians rely heavily on confirma-tory diagnostics [1]. This review will assess how -omics based technology is poised to push this field beyond the limitations of currently available tests.
Currently availableMycobacterium tuberculosis(Mtb) diagnostic approaches
The gold standard for microbiological diagnosis of Mtb relies on identification of the organism from clinical specimens. Microscopy, being rapid and affordable, re-mains the first-line diagnostic approach [2–4], but its sensitivity is both operator dependent and reliant on the abundance of Mtb in the sample [2]. Culture of Mtb im-proves sensitivity [5], but has inherent drawbacks–Mtb growth in vitro is fastidious and has a slow generation
time (20–22 h) [6], and thus it takes weeks to identify Mtb from samples. Nevertheless, matrix-assisted laser desorption ionization-time of flight (MALDI-TOF) mass spectrometry and nucleic acid amplification tests (NAATs) may soon accelerate this step for the identification of positive cultures [7–11]. Liquid broth-based culture cir-cumvents slow growth and subjective colony detection of Mtb on solid agar [12], improving both detection time and sensitivity compared to solid media cultures [4, 5, 13]. However, automated liquid culture systems necessitate significant laboratory infrastructure, and therefore other manual TB culture methods have been recommended for resource-limited settings [2]. Micro-scopic observation of drug sensitivity (MODS) uses inverted light microscopy to identify the typical cording pattern of Mtb in liquid culture; it is cost-effective in resource-limited settings and has similar or superior sensitivity and specificity to established culture systems [2, 14–16]. However, it still requires both skilled personnel and laboratory containment facilities, making it unsuitable for all settings and certainly not a point-of-care test.
An alternative approach to culture is Mtb antigen detection, best illustrated by the use of Mtb lipoara-binomannan in urine as a point-of-care diagnostic
* Correspondence:[email protected]
†Equal contributors
Division of Infection and Immunity, University College London, Cruciform Building, Gower Street, London WC1E 6BT, UK
World TB Day
© 2016 Haas et al.Open AccessThis article is distributed under the terms of the Creative Commons Attribution 4.0 International License (http://creativecommons.org/licenses/by/4.0/), which permits unrestricted use, distribution, and reproduction in any medium, provided you give appropriate credit to the original author(s) and the source, provide a link to the Creative Commons license, and indicate if changes were made. The Creative Commons Public Domain Dedication waiver (http://creativecommons.org/publicdomain/zero/1.0/) applies to the data made available in this article, unless otherwise stated. Haaset al. BMC Medicine (2016) 14:37
immunochromatographic assay. Although rapid and low cost, this test only achieves high sensitivity (>70 %) in HIV-TB co-infected patients with advanced immunodefi-ciency (CD4 < 200), limiting its diagnostic utility in an unselected population [17].
NAATs aim to detect Mtb directly from clinical speci-mens [7, 18], but only the line probe assay and Xpert MTB/RIF have been endorsed by the Word Health Organization for use in low- to middle-income countries [19, 20]. The line probe assay simultaneously detects Mtb and common rifampicin and isoniazid resistance mutations, but has a sensitivity of 58–80 % [21, 22] and still necessitates laboratory PCR facilities beyond the reach of many resource-limited settings. In contrast, the Xpert MTB/RIF platform performs PCR reactions within proprietary cartridges, making it a rapid diagnostic test [23]. Smear-positive sputum samples of confirmed pul-monary TB have 99 % sensitivity and a pooled specificity of 98 % [24]. Xpert MTB/RIF also detects the most com-mon rifampicin resistance mutations in the Mtb rpoB gene, a proxy for multidrug-resistant TB, with a pooled sensitivity and specificity of 95 % and 98 %, respectively [20, 24]. However, Xpert MTB/RIF has a lower sensitiv-ity in smear-negative sputum samples (68 %), and its sensitivity in extrapulmonary TB samples is highly vari-able (median 77.3 %, range 25.0–96.6 %) [24–27], leaving a significant proportion of TB disease reliant on sub-optimal accuracy from diagnostic tests.
Whole genome pathogen sequencing
Recent advances in genomics offer the opportunity to advance TB diagnostics by improving bacterial detection. Whole genome sequencing (WGS) of clinical Mtb isolates has been used to retrospectively track Mtb transmission events [28, 29], discriminate between infection and re-lapse cases [30], and identify drug resistance-conferring mutations [31, 32]. Like NAATs, WGS provides both diag-nostic confirmation of the presence of Mtb and informa-tion about antibiotic susceptibility using publicly available databases of annotated drug resistance and susceptibility mutations [33, 34]. WGS may yield results in a clinically relevant time frame, identifying the organism 1–3 days after a liquid culture flags positive [35, 36].
Excitingly, two recent studies propose faster diagnostic confirmation using WGS by successfully sequencing Mtb genomes directly from uncultured sputum samples [37, 38]. However, the ability to recover Mtb genome sequences also from smear- and culture-negative sputum samples (derived from previously diagnosed TB patients after anti-TB therapy) [38] emphasises that DNA-based techniques cannot discriminate between active disease and cleared infections, where DNA from dead mycobacteria may remain detectable.
Host response-based diagnostics
In part owing to deficiencies in current diagnostics, around 42 % of notified cases are treated presumptively for TB disease [1]. In these circumstances, diagnostic confidence can be offered by the host response to Mtb infection: non-specific syndromic changes, such as an-aemia, can be predictive of the likelihood of TB disease [39], and histopathological changes, such as caseating granulomata, support a diagnosis of tuberculosis [40] but are clearly limited by availability of diagnostic sam-pling of the site of disease. More dynamic pathological changes can now also be detected through imaging mo-dalities such as CT-PET scanning [41], but these are still being evaluated and are not readily available. The host response to Mtb infection is also exploited in tuberculin skin tests (TSTs) and interferon gamma (IFN-γ) release assays (IGRAs): these are commonly used to diagnose asymptomatic‘latent’TB infection (LTBI; reviewed ex-tensively elsewhere [42–44]), but they lack sensitivity or specificity in the diagnosis of active disease [45, 46]. Extensive research efforts have evaluated -omic tech-nologies (Box 1) to screen host responses that might ultimately lead to better diagnostic tests for TB.
Blood transcriptomics
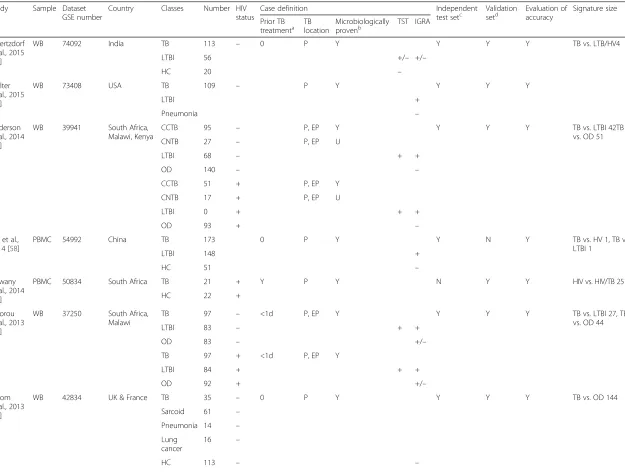
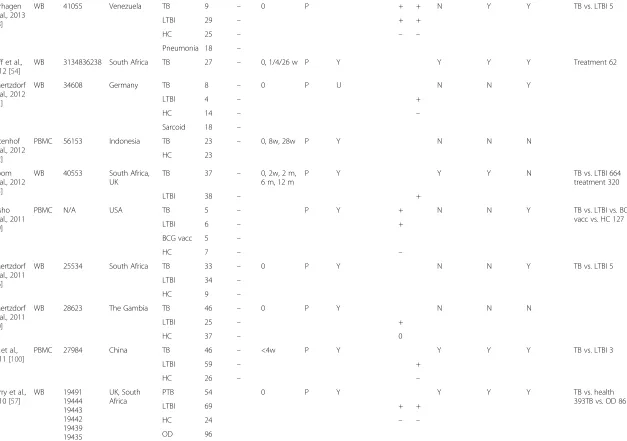
Over 20 studies examining the human transcriptional response to TB have been published since the first paper in 2007 [47] (Table 1). Despite this, no diagnostic test for TB utilising this technology exists. A number of reasons may account for this. Several of the studies were designed with the intention of exploring the immunopathogenesis of TB [48–53] rather than identifying diagnostic markers. Others have aimed at evaluating the treatment response to TB with a view to finding new surrogate markers of suc-cess for both clinical management and use in trials of new therapies [54, 55]. Of those designed to derive signatures that would discriminate active TB from health or other disease states, only a handful have a case definition of ac-tive TB based on microbiological confirmation, validation of their signatures in independent cohorts and evaluation of the diagnostic accuracy of the signature. We have fo-cused on these studies in greater detail in this review.
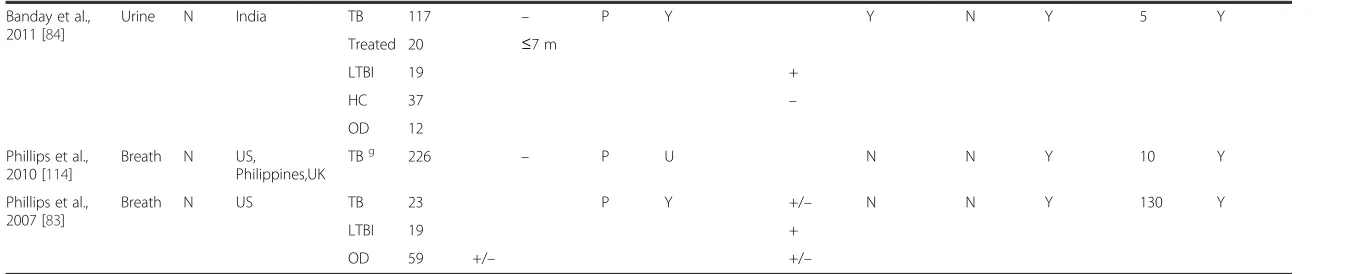
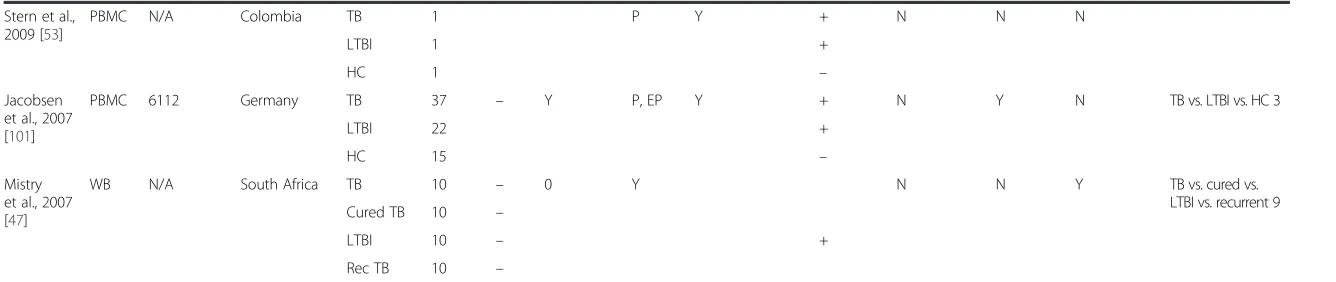
Published transcriptional signatures for active TB vary in size and show surprisingly limited overlap between studies (Fig. 1). Nevertheless, common functional anno-tations associated with gene signatures of active TB have been observed in some studies. These include FCGR sig-nalling [50, 56], interferon sigsig-nalling [52, 57], and com-plement pathways [54, 58]. In addition to variations in study design, differences in patient demography, site and duration of TB disease, time on treatment and technical differences in the methodology of transcriptional profil-ing may have contributed to the diversity in signatures. The use of whole blood with and without globin depletion,
or fractionated peripheral blood mononuclear cells for transcriptional profiling is likely to cause significant con-founding. In addition, the use of different array platforms necessitates cross-comparison using a common feature such as gene name, but this may be insufficient because discriminating signatures in different studies may include unannotated probes with no gene name, or diverse probes for the same gene that do not give concordant signals.
Amongst the most highly cited studies, Berry et al. [57] described a 393-transcript signature of active TB versus
healthy states, derived from a UK population (training set) and validated in a UK test set as well as in an independent South African cohort. Active TB cases were defined as culture-positive pulmonary TB with radiographic changes and whole blood transcriptomic samples were acquired prior to any TB treatment. Patients with LTBI were defined by the absence of signs or symptoms of active TB, and a positive IGRA and TST. Healthy controls had no symptoms or signs of TB and a negative IGRA and TST. Differentially expressed genes between active TB and healthy states (both LTBI and healthy controls) were identified in the training set using expression-level, statistical filters and hierarchical clustering. Ma-chine learning and k-nearest neighbour class prediction showed a sensitivity and specificity of 61.67 and 83.75 %, respectively, in the UK test cohort, and of 94.12 and 96.67 %, respectively, in the South African validation cohort. Additionally, disease-associated transcriptional changes, used to derive a so-called molecular distance to health, were shown to correlate with radiographic changes and to revert to that of healthy controls after treatment. The difference in sensitivity between the UK and South African cohorts was attributed to the poten-tial contribution of different Mtb lineages in the more ethnically diverse UK cohort as well as to latent TB cases being misclassified as active disease, potentially representing sub-clinical active TB.
A greater clinical challenge is distinguishing patients with TB disease from other diseases. In the study described above, Berry et al. [57] derived an 86-transcript signature of TB versus other inflammatory diseases, including staphylo-coccal and Group A streptostaphylo-coccal infections, systemic lupus erythematosus and Still’s disease, by comparison with previously published data sets. However, in subsequent studies, this did not discriminate TB from cases of pulmon-ary sarcoidosis [51], which can mimic the presentation of active TB. Bloom et al. [48] published a 144-transcript signature that could distinguish TB from other pulmonary disease (sarcoidosis, non-tuberculous pneumonia and lung cancer) and was derived from differentially expressed tran-scripts between the TB and sarcoid groups. When applied to training, test and validation cohorts, and using class prediction via support vector machines (SVMs), sensitivity was over 80 % with specificity over 90 % in distinguishing TB from non-TB (sarcoid, pneumonia, lung cancer, healthy controls). This study was restricted to UK and French patients and the number of patients with pneumo-nia or lung cancer was relatively modest. In addition, pneu-monia cases compared to TB in this study experienced a variable duration of antibiotic therapy before transcriptomic sampling, which may have significantly confounded the conclusions as the authors highlighted the effect of antibiotic treatment on transcriptional profiles in a sep-arate cohort of pneumonia patients.
Box 1 High-throughput technologies to profile the host response in TB [93]
Transcriptomics
Transcriptomics is the analysis of genome-wide gene expression, measured as RNA transcript abundance by gene chip microarrays or RNA sequencing. Most often, transcriptomics studies focus on the expression of protein-coding genes. However, the human
transcriptome also includes non-coding RNA, and may contain up to 350,000 different transcripts [94]. Gene expression data from published transcriptomics studies are generally deposited in the public data repositories Gene Expression Omnibus (http://www.ncbi.
nlm.nih.gov/geo/) or Array Express (https://www.ebi.ac.uk/arrayexpress/). However, the lack of detailed metadata and the use of different platforms render it difficult to combine individual datasets [95].
Proteomics
Proteomics is the study of the collective set of proteins expressed by a cell or an organism at any given time. The human proteome is
estimated to encompass up to one million different proteins. The main technology applied in proteomic studies is mass spectrometry, which involves fragmentation of proteins prior to their detection and quantification based on the mass-to-charge ratio of the
resulting peptides. The detected peaks are first identified as peptides through a database search, and are then assigned to proteins through the use of identification algorithms [96].
Metabolomics
Metabolomics aims to characterize the small molecule metabolites (e.g. lipids, fatty acids, sugars, amino acids, nucleotides) present in a
clinical specimen. Approximately 20,000 different metabolites have been detected in human samples [97], with mass spectrometry and nuclear magnetic resonance as main detection tools. Examples of the analytical challenges associated with metabolomics studies
include the dependency of the metabolite profile on the experimental methodology employed, and the broad spectrum of metabolite origin (e.g. drugs, nutrition) which need to be taken into account when interpreting inter-individual differences.
Table 1Transcriptomic studies
Study Sample Dataset
GSE number
Country Classes Number HIV
status
Case definition Independent
test setc Validationsetd Evaluation ofaccuracy Signature size
Prior TB
treatmenta TBlocation Microbiologicallyprovenb TST IGRA
Maertzdorf et al., 2015
[62]
WB 74092 India TB 113 – 0 P Y Y Y Y TB vs. LTB/HV4
LTBI 56 +/– +/–
HC 20 –
Walter et al., 2015
[61]
WB 73408 USA TB 109 – P Y Y Y Y
LTBI +
Pneumonia –
Anderson et al., 2014
[60]
WB 39941 South Africa,
Malawi, Kenya
CCTB 95 – P, EP Y Y Y Y TB vs. LTBI 42TB
vs. OD 51
CNTB 27 – P, EP U
LTBI 68 – + +
OD 140 – –
CCTB 51 + P, EP Y
CNTB 17 + P, EP U
LTBI 0 + + +
OD 93 + –
Cai et al.,
2014 [58]
PBMC 54992 China TB 173 0 P Y Y N Y TB vs. HV 1, TB vs.
LTBI 1
LTBI 148 +
HC 51 –
Dawany et al., 2014
[63]
PBMC 50834 South Africa TB 21 + Y P Y N Y Y HIV vs. HIV/TB 251
HC 22 +
Kaforou et al., 2013
[59]
WB 37250 South Africa,
Malawi
TB 97 – <1d P, EP Y Y Y Y TB vs. LTBI 27, TB
vs. OD 44
LTBI 83 – + +
OD 83 – +/–
TB 97 + <1d P, EP Y
LTBI 84 + + +
OD 92 + +/–
Bloom et al., 2013
[48]
WB 42834 UK & France TB 35 – 0 P Y Y Y Y TB vs. OD 144
Sarcoid 61 –
Pneumonia 14 –
Lung cancer
16 –
HC 113 – –
Haas
et
al.
BMC
Medicine
(2016) 14:37
Page
4
of
Table 1Transcriptomic studies(Continued)
Verhagen et al., 2013
[98]
WB 41055 Venezuela TB 9 – 0 P + + N Y Y TB vs. LTBI 5
LTBI 29 – + +
HC 25 – – –
Pneumonia 18 –
Cliff et al.,
2012 [54]
WB 3134836238 South Africa TB 27 – 0, 1/4/26 w P Y Y Y Y Treatment 62
Maertzdorf et al., 2012
[51]
WB 34608 Germany TB 8 – 0 P U N N Y
LTBI 4 – +
HC 14 – –
Sarcoid 18 –
Ottenhof et al., 2012
[52]
PBMC 56153 Indonesia TB 23 – 0, 8w, 28w P Y N N N
HC 23
Bloom et al., 2012
[55]
WB 40553 South Africa,
UK
TB 37 – 0, 2w, 2 m,
6 m, 12 m
P Y Y Y N TB vs. LTBI 664
treatment 320
LTBI 38 – +
Lesho et al., 2011
[99]
PBMC N/A USA TB 5 – P Y + N N Y TB vs. LTBI vs. BCG
vacc vs. HC 127
LTBI 6 – +
BCG vacc 5 –
HC 7 – –
Maertzdorf et al., 2011
[56]
WB 25534 South Africa TB 33 – 0 P Y N N Y TB vs. LTBI 5
LTBI 34 –
HC 9 –
Maertzdorf et al., 2011
[50]
WB 28623 The Gambia TB 46 – 0 P Y N N N
LTBI 25 – +
HC 37 – 0
Lu et al.,
2011 [100]
PBMC 27984 China TB 46 – <4w P Y Y Y Y TB vs. LTBI 3
LTBI 59 – +
HC 26 – –
Berry et al.,
2010 [57]
WB 19491
19444 19443 19442 19439 19435 22098
UK, South Africa
PTB 54 0 P Y Y Y Y TB vs. health
393TB vs. OD 86
LTBI 69 + +
HC 24 – –
OD 96
Haas
et
al.
BMC
Medicine
(2016) 14:37
Page
5
of
Table 1Transcriptomic studies(Continued)
Stern et al.,
2009 [53]
PBMC N/A Colombia TB 1 P Y + N N N
LTBI 1 +
HC 1 –
Jacobsen et al., 2007
[101]
PBMC 6112 Germany TB 37 – Y P, EP Y + N Y N TB vs. LTBI vs. HC 3
LTBI 22 +
HC 15 –
Mistry et al., 2007
[47]
WB N/A South Africa TB 10 – 0 Y N N Y TB vs. cured vs.
LTBI vs. recurrent 9
Cured TB 10 –
LTBI 10 – +
Rec TB 10 –
WBWhole blood,PBMCPeripheral blood mononuclear cells,TBActive tuberculosis,LTBILatent TB infection,HCHealthy controls,ODOther diseases,CCTBCulture-confirmed TB,CNTBCulture-negative TB,EPExtrapulmonary,
PPulmonary,YYes,NNo
a
Number of days (d), weeks (w) or months (m) on treatment at time of sampling
b
U if unclear whether all TB cases were microbiologically confirmed, e.g. if diagnosis was based on Mtb culture or chest X-ray or TB symptoms, or if microbiologically proven and unproven TB cases were grouped together
c
Never involved in training the model
d
New, independent set of samples
Haas
et
al.
BMC
Medicine
(2016) 14:37
Page
6
of
Kaforou et al. [59] and Anderson et al. [60] presented much larger multi-centre studies in Africa, comparing TB to other diseases where TB was in the differential diagnosis. Importantly, these included HIV-positive adults and children, respectively, and encompassed a far broader range of conditions than the previously described studies [59, 60]. Kaforou et al. [59] recruited adult patients to com-pare culture-positive pulmonary and extrapulmonary TB to LTBI and other diseases. Discovery cohorts from Malawi and South Africa were used to define a 44-transcript signa-ture of TB versus other diseases, which was then validated with an external dataset. They also proposed a calculation for a so-called Disease Risk Score (DRS) to reduce the multigene transcriptional signature to a single numerical value in order to discriminate TB from other diseases. This provided a sensitivity of 93–100 % in test and validation cohorts, and specificities of 88–96 %. The inclusion of a broad range of diagnoses represents a pragmatic approach relevant to clinical setting in which TB presents.
In their study of children with TB, Anderson et al. [60] employed a similar study design in the same geographical locations, although the description of TB disease was not detailed. The DRS based on a 51-transcript signature dis-tinguished TB from other diseases in the validation cohort with a lower sensitivity of 82.9 % and specificity of 83.6 %. Additionally, culture-negative cases were included and evaluated separately. In this context, sensitivity decreased to as low as 35 % in the‘possible TB’cases but specificity was maintained at around 80 %. The DRS therefore outperformed the Xpert MTB/RIF assay in sensitivity in
both culture-positive and -negative cohorts, but could not compete with the 100 % specificity of this PCR assay.
A new whole blood transcriptomic study in a US population identified new classifiers for active TB and compared their accuracy to those from other published studies [48, 51, 57, 59] using SVM and receiver operator characteristic curves [61]. They described high areas under the curve (AUCs) when discriminating between TB and pneumonia in their own cohort (0.965). These were higher than previously published signatures (0.9 and 0.82) and also performed well when used to classify a previously published dataset (0.906). In contrast, TB versus LTBI classifiers in all studies performed consistently accurately when applied across all datasets. Although not yet available at the time of writing, this study will provide additional array data valuable for cross validation in future studies. In this respect, an important hurdle to under-taking cross validation between published studies and meta-analyses is the lack of metadata linking individual cases to the corresponding transcriptomes deposited in public repositories.
Furthermore, the fact that all the diagnostic signatures described above are based on multigene signatures ne-cessitates capacity for whole genome measurements or at least PCR multiplexing. The most recent study pub-lished by Maertzdorf et al. [62] aimed to identify the minimum number of transcripts that provide optimal diagnostic accuracy in order to reduce the cost of such tests and, therefore, their accessibility. Based on microarray data-sets from two previous studies [50, 56], a 360-gene target
Fig. 1Venn diagrams of selected published transcriptomic signatures. Signatures were compared by gene symbol annotation, and the overlap visualised with Venn diagrams [115]. Since not all transcripts are annotated with a gene name, the gene numbers displayed in the Venn diagrams may not add up to the number of transcripts in the published signature.aGene signatures that distinguish TB cases from healthy controls (including latently infected subjects). Berry 393 = 393-transcript signature of TB versus healthy states (LTBI and healthy controls) [57]; Kaforou 27 = 27-transcript signature of TB versus LTBI [59]; Anderson 42 = 42-transcript signature of TB versus LTBI [60].bGene signatures that distinguish TB cases from other diseases. Berry 86 = 86-transcript TB-specific signature [57]; Bloom 144 = 144-transcript signature of TB versus other pulmonary disease [55]; Kaforou 44 = 44-transcript signature of TB versus OD [59]; Anderson 51 = 51-transript signature of TB versus OD [60].TBTuberculosis,LTBLatent tuberculosis infection,HCHealthy controls,ODOther disease
custom made PCR array was applied to samples from a new cohort of TB patients and healthy controls in India. A stepwise approach using training and testing sets was used to define a small set of top classifying genes. Two tree-based models were used, with the conditional infer-ence model identifying a four-gene signature (GBP1, ID3, P2RY14 and IFITM3) that could differentiate active TB from a healthy state with an AUC of 0.98. Independent validation using RT-PCR was performed in two further African cohorts resulting in AUCs of 0.82 and 0.89. The study goes on to analyse existing published microarray datasets, training their model on RT-PCR data of TB and healthy controls in India, and testing with microarray data from various studies [48, 51, 57, 59, 63]. The signature maintained consistently high AUCs in all HIV-negative populations when discriminating active TB from healthy states, but yielded a lower AUC in HIV-positive cohorts. Additionally, evaluation of its performance in‘other disease’ cohorts was found to be more variable across varying eth-nicities, geographical locations and HIV status. This is an exciting step forward identifying potential candidates for development in molecular point-of-care TB diagnostics.
Tissue transcriptomics
Blood samples are taken as part of routine clinical care, and thus are readily accessible for research purposes and diagnostic tests. However, transcriptional profiling at the site of disease may yield biologically relevant responses that are not evident in blood. Indeed, a blood signature that discriminates between individuals with active and latent TB infection is only partly enriched in the transcrip-tome of human TB lung granulomas [64] and cervical lymph nodes [65]. Similarly, the transcriptional signature that distinguishes TB from sarcoidosis in mediastinal lymph node samples shows little overlap with previously published peripheral blood signatures [66].
One explanation for these compartmentalised responses could be the structural heterogeneity that is observed amongst individual granulomas within the same host [67], and which is also reflected in the transcriptome [64]. Subbian et al. [64] found that fibrotic nodules showed both quantitatively and qualitatively different transcrip-tional changes compared to cavitating granulomas. The heterogeneity of localised tissue responses may be lost when averaging systemic (blood) responses, and potentially impede the discovery of sensitive peripheral blood bio-markers. Therefore, transcriptomes from the site of disease may provide more sensitive biomarkers than peripheral blood and complement conventional histo-pathological diagnostics [66].
Proteomics
Several studies have investigated the diagnostic potential of proteomic fingerprinting to identify different disease
states (i.e. active TB versus healthy state, LTBI or other diseases) and monitor the treatment response in TB (Table 2).
In 2006, Agranoff et al. [68] were the first to demon-strate that the serum proteome can distinguish active pulmonary TB from both non-TB disease and healthy controls. Employing proteomic profiling and a SVM learning approach, this landmark study identified a com-bination of four biomarkers (serum amyloid A, trans-thyretin, neopterin and C reactive protein), that, when measured by conventional immunoassays such as ELISA, could identify active TB cases in an independent cohort with a sensitivity and specificity of 88 and 74 %, respect-ively. The authors hypothesised that diagnostic accuracy could be further improved with immunoassays that tar-get specific protein variants (as identified by proteomic technologies) rather than the total protein.
Despite these early findings, and numerous studies since, there are at least two major barriers to translating proteomic biomarkers into diagnostic tests. Firstly, the protein biomarker candidates reported by independent studies vary considerably and a universal proteomic pro-file of TB has therefore remained elusive. Differences in proteomic techniques and their resolutions, study design, case definitions and statistical analyses may all contribute to discrepant results. Nevertheless, there is overlap in the proteins reported to be differentially expressed in active TB; selected examples include CD14, S100A proteins, apo-lipoproteins, fibrinogen, orosomucoid and serum amyloid A. The decision regarding which of these differentially expressed proteins are further considered or combined as candidate biomarkers can however be biased. For instance, investigators may choose to validate only proteins that can be measured by commercial ELISA kits [69], identify only (arbitrarily) selected differentially expressed protein peaks [70, 71] or none at all [72–76], or exclude‘non-specific’ in-flammatory markers such as acute phase proteins [77]. The inconsistent selection approach taken by different groups consequently impairs the assessment of common protein signatures between independent studies. Secondly, identi-fied proteins of interest are not always (1) evaluated for their diagnostic potential (i.e. with receiver operator curve analyses or decision trees); (2) cross-validated in independ-ent datasets; or (3) evaluated with external datasets.
Indeed, the need to validate diagnostic models in inde-pendently recruited patient populations and to define the target group in which the diagnostic test is likely to be successful (e.g. ethnic background, HIV status) has been convincingly illustrated by Ratzinger et al. [78], who applied the diagnostic algorithm previously devised by Agranoff et al. [68] to a new Central European patient cohort of 36 active TB cases and 170 patients with other diseases. The originally published diagnostic algorithm predicted disease status in the new cohort with a poor
Table 2Proteomics studies
Study Sample Data
access
Country Classes Number Case definition Independent
test setc Validationsetd Evaluation ofaccuracy Signaturesize Proteinbiomarkers
identified HIV
status Prior TB
treatmenta TBlocation Microbiologicallyprovenb TST IGRA
Achkar et al.,
2015 [77]
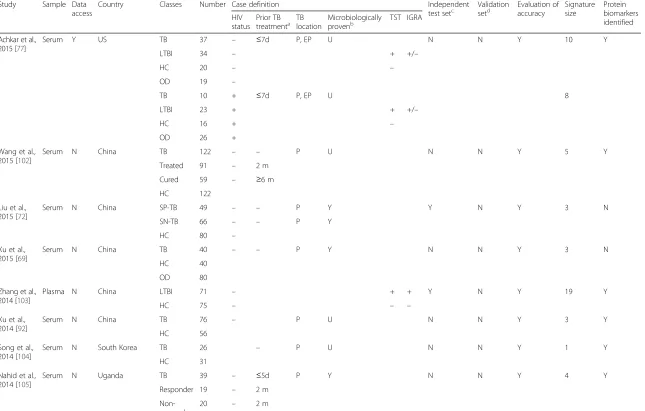
Serum Y US TB 37 – ≤7d P, EP U N N Y 10 Y
LTBI 34 – + +/–
HC 20 – –
OD 19 –
TB 10 + ≤7d P, EP U 8
LTBI 23 + + +/–
HC 16 + –
OD 26 +
Wang et al.,
2015 [102]
Serum N China TB 122 – – P U N N Y 5 Y
Treated 91 – 2 m
Cured 59 – ≥6 m
HC 122
Liu et al.,
2015 [72]
Serum N China SP-TB 49 – – P Y Y N Y 3 N
SN-TB 66 – – P Y
HC 80 –
Xu et al.,
2015 [69]
Serum N China TB 40 – – P Y N N Y 3 N
HC 40
OD 80
Zhang et al.,
2014 [103]
Plasma N China LTBI 71 – + + Y N Y 19 Y
HC 75 – – –
Xu et al.,
2014 [92]
Serum N China TB 76 – P U N N Y 3 Y
HC 56
Song et al.,
2014 [104]
Serum N South Korea TB 26 – P U N N Y 1 Y
HC 31
Nahid et al.,
2014 [105]
Serum N Uganda TB 39 – ≤5d P Y N N Y 4 Y
Responder 19 – 2 m
Non-responder
20 – 2 m
Haas
et
al.
BMC
Medicine
(2016) 14:37
Page
9
of
Table 2Proteomics studies(Continued)
Ou et al.,
2013 [106]
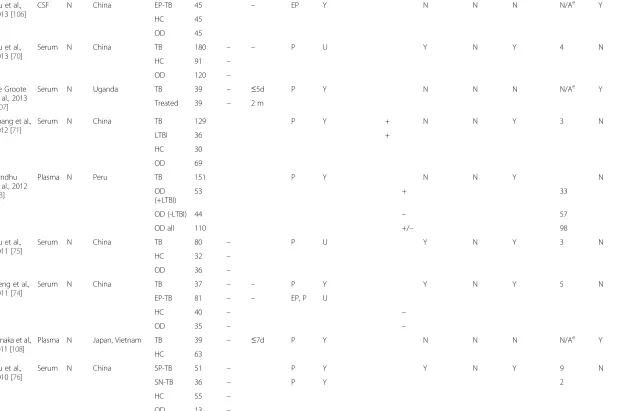
CSF N China EP-TB 45 – EP Y N N N N/Ae Y
HC 45
OD 45
Liu et al.,
2013 [70]
Serum N China TB 180 – – P U Y N Y 4 N
HC 91 –
OD 120 –
De Groote et al., 2013
[107]
Serum N Uganda TB 39 – ≤5d P Y N N N N/Ae Y
Treated 39 – 2 m
Zhang et al.,
2012 [71]
Serum N China TB 129 P Y + N N Y 3 N
LTBI 36 +
HC 30
OD 69
Sandhu et al., 2012
[73]
Plasma N Peru TB 151 P Y N N Y N
OD (+LTBI)
53 + 33
OD (-LTBI) 44 – 57
OD all 110 +/– 98
Liu et al.,
2011 [75]
Serum N China TB 80 – P U Y N Y 3 N
HC 32 –
OD 36 –
Deng et al.,
2011 [74]
Serum N China TB 37 – – P Y Y N Y 5 N
EP-TB 81 – – EP, P U
HC 40 – –
OD 35 – –
Tanaka et al.,
2011 [108]
Plasma N Japan, Vietnam TB 39 – ≤7d P Y N N N N/Ae Y
HC 63
Liu et al.,
2010 [76]
Serum N China SP-TB 51 – P Y Y N Y 9 N
SN-TB 36 – P Y 2
HC 55 –
OD 13 –
Haas
et
al.
BMC
Medicine
(2016) 14:37
Page
10
of
Table 2Proteomics studies(Continued)
Agranoff et al., 2006
[68]
Serum N Uganda, The
Gambia, Angola, UK
TB 197 +/– ≤7d P, EP Y Y Y Y 4 Y
HC 25 +/–
OD 168 +/–
CSFCerebrospinal fluid,TBActive tuberculosis,LTBILatent TB infection,HCHealthy controls,ODOther diseases,SPSmear positive,SNSmear negative,EPExtrapulmonary,PPulmonary;Yyes,Nno
a
number of days (d) or months (m) on treatment at time of sampling
b
U if unclear whether all TB cases were microbiologically confirmed, e.g. if diagnosis was based on Mtb culture or chest X-ray or TB symptoms, or if microbiologically proven and unproven TB cases were grouped together
c
never involved in training the model (nested, k-fold or leave-one-out cross-validation (without test) are not considered to make use of an independent test set)
d
new, independent set of samples, e.g. from different ethnic background or geographic location
e
Differentially expressed proteins were identified but suitability as biomarkers was not assessed
Haas
et
al.
BMC
Medicine
(2016) 14:37
Page
11
of
accuracy of only 54 % (19 % sensitivity and 62 % specifi-city). Ratzinger et al. [78] argued that the performance difference to the initial study may be attributable to dif-ferences in the composition of the comparison groups and the pre-test probability due to study design (ap-proximately 1:1 distribution of TB cases and controls in the original case-control study [68] versus 1:4 distribu-tion in the following cross-secdistribu-tional study [78]).
Further, only one, very recent study has deposited its proteomic data on publically available databases. In this study, Achkar et al. [77] identified two separate protein biosignatures with excellent diagnostic accuracy for active TB in either HIV uninfected (AUC 0.96) or co-infected individuals (AUC 0.95). In this prospective study [77], the TB group included smear-negative and smear-positive as well as pulmonary and extrapulmonary cases. Despite the small number of patients, the resulting protein panels are likely to be useful in clinical practice if they can be cross-validated, and the deposited data repre-sent a valuable external reference set for future studies.
Taken together, many studies have described alter-ations in peripheral blood proteins during active TB and suggested those as diagnostic disease markers. Although the observed differences evolve around common func-tional categories, in particular inflammatory responses, tissue repair and lipid metabolism [77], significant im-provements in standardisation and validation procedures are needed to increase reproducibility and accuracy of protein biosignatures, and to advance adoption to the clinical setting [79].
Metabolomics
TB-associated changes in the metabolite profile have been examined in blood and other clinical specimens such as urine, sputum, cerebrospinal fluid or breath (Table 3). However, the primary aim of most published studies has been to gain novel biological insights into TB pathogenesis rather than to probe diagnostic value. Accordingly, diag-nostic performance of the candidate biomarkers has not always been assessed. Those interested in a diagnostic evaluation cannot easily make use of the generated data since these are not routinely deposited on public data-bases, with only one study providing its raw data as supplementary material [80].
For the majority of studies that have evaluated the ac-curacy of metabolic biomarkers, it is unclear whether active TB cases were microbiologically proven since radiological disease was often included as a diagnostic criterion. This leaves only a few reports comparing confirmed active TB with healthy, LTBI or symptomatic disease controls. Weiner et al. [81] demonstrated that 20 serum metabolites sufficed to discriminate between patients with active pulmonary TB and healthy controls (with or without LTBI) with an accuracy of 97 %. Lau et al.
[80] reported that the combination of the cholesterol precursor 4α-formyl-4β-methyl-5α-cholesta-8-en-3β-ol with either 12-hydroxyeicosatetraenoic acid or cholesterol sulphate differentiated active pulmonary TB not only from healthy controls but also from patients with community-acquired pneumonia with >70 % sensitivity and≥90 % spe-cificity. In urine, 42 compounds were needed to identify active TB cases amongst TB suspects with an AUC of 0.85 [82], while in breath, Mtb-derived volatile organic com-pounds predicted active TB patients amongst TB suspects with an AUC of 0.93 [83]. However, none of these studies included independent test sets. By contrast, Banday et al. [84] generated a model based on five urine metabolites (o-xylene, isopropyl acetate, 3-pentanol, dimethylstyrene and cymol) that, in an independent test set of active TB cases and healthy controls, achieved an AUC of 0.988. In addition, Kolk et al. [85] derived a seven-metabolite signa-ture by breath analysis in a South African cohort of TB suspects, which in a different set of patients from the same area yielded 62 % sensitivity and 84 % specificity. It should be noted that a similar sensitivity (64 %) was achieved when the authors randomly assigned samples as TB or non-TB cases, whereas the specificity dropped to 60 %.
Alterations detected in the metabolome of active TB patients include differences in the abundance of specific host-derived metabolites but also the presence of com-pounds derived from Mtb itself (e.g. cell wall lipids) or – when including TB patients on treatment – of anti-TB drugs [86, 87]. It is therefore important to consider subject characteristics when comparing metabolite biosignatures reported by different studies. In addition, since the meta-bolic profile is shaped by several environmental factors, in-cluding dietary intake, medication, comorbidities and stress [88], careful matching of cases and controls is desirable during biomarker discovery to minimise metabolite‘noise’. In the catalogued studies, only Frediani et al. [86] addressed this issue by assessing dietary intake and matching TB cases with healthy household controls.
The number of measured metabolites varies greatly be-tween published studies (from 34 to >21,000), dependent on, for example, the analytical technique used. The differ-ence in measured metabolites and the often large propor-tion of unidentifiable metabolite peaks render it difficult to compare biosignatures between studies or to reproduce findings. Indeed, Mahapatra et al. [89] had to exclude 10 of 45 potential biomarkers identified in the discovery set as they did not yield quantitative data in the test set despite consistent use of the analytical technique (liquid chromatography–mass spectrometry).
To summarise, the metabolomics approach to TB bio-marker discovery faces many of the same challenges as proteomics, including data availability, reproducibility, standardisation and validation. The current lack of ex-tensive cross-validation and of robust overlap between
Table 3Metabolomics studies
Study Sample Data
access
Country Classes Number Case definition Independent
test setc Validationsetd Evaluation ofaccuracye Signaturesize Metabolitebiomarkers
identified HIV
status Prior TB
treatmenta TBlocation Microbiologicallyprovenb TST IGRA
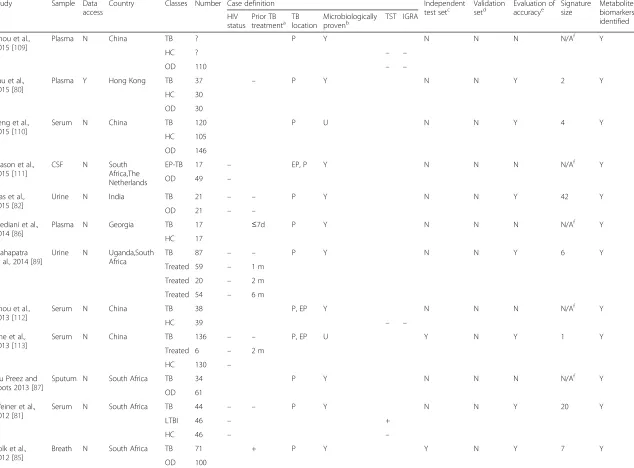
Zhou et al.,
2015 [109]
Plasma N China TB ? P Y N N N N/Af Y
HC ? – –
OD 110 – –
Lau et al.,
2015 [80]
Plasma Y Hong Kong TB 37 – P Y N N Y 2 Y
HC 30
OD 30
Feng et al.,
2015 [110]
Serum N China TB 120 P U N N Y 4 Y
HC 105
OD 146
Mason et al.,
2015 [111]
CSF N South
Africa,The Netherlands
EP-TB 17 – EP, P Y N N N N/Af Y
OD 49 –
Das et al.,
2015 [82]
Urine N India TB 21 – – P Y N N Y 42 Y
OD 21 – –
Frediani et al.,
2014 [86]
Plasma N Georgia TB 17 ≤7d P Y N N N N/Af Y
HC 17
Mahapatra
et al., 2014 [89]
Urine N Uganda,South
Africa
TB 87 – – P Y N N Y 6 Y
Treated 59 – 1 m
Treated 20 – 2 m
Treated 54 – 6 m
Zhou et al.,
2013 [112]
Serum N China TB 38 P, EP Y N N N N/Af Y
HC 39 – –
Che et al.,
2013 [113]
Serum N China TB 136 – – P, EP U Y N Y 1 Y
Treated 6 – 2 m
HC 130 –
Du Preez and
Loots 2013 [87]
Sputum N South Africa TB 34 P Y N N N N/Af Y
OD 61
Weiner et al.,
2012 [81]
Serum N South Africa TB 44 – – P Y N N Y 20 Y
LTBI 46 – +
HC 46 – –
Kolk et al.,
2012 [85]
Breath N South Africa TB 71 + P Y Y N Y 7 Y
OD 100
Haas
et
al.
BMC
Medicine
(2016) 14:37
Page
13
of
Table 3Metabolomics studies(Continued)
Banday et al.,
2011 [84]
Urine N India TB 117 – P Y Y N Y 5 Y
Treated 20 ≤7 m
LTBI 19 +
HC 37 –
OD 12
Phillips et al.,
2010 [114]
Breath N US,
Philippines,UK
TBg 226 – P U N N Y 10 Y
Phillips et al.,
2007 [83]
Breath N US TB 23 P Y +/– N N Y 130 Y
LTBI 19 +
OD 59 +/– +/–
CSFCerebrospinal fluid,TBActive tuberculosis,LTBILatent TB infection,HCHealthy controls,ODOther diseases,EPExtrapulmonary,PPulmonary,YYes,NNo
a
number of days (d) or months (m) on treatment at time of sampling
b
U if unclear whether all TB cases were microbiologically confirmed, e.g. if diagnosis was based on Mtb culture or chest X-ray or TB symptoms, or if microbiologically proven and unproven TB cases were grouped together
c
never involved in training the model (nested, k-fold or leave-one-out cross-validation (without test) are not considered to make use of an independent test set)
d
new, independent set of samples, e.g. from different ethnic background or geographic location
e
predictive ability of the (O)PLS-DA model was not considered a valid accuracy evaluation
f
Differentially expressed metabolites were identified but suitability as biomarkers was not assessed
g
Different diagnostic criteria were compared but class distribution was not clear
Haas
et
al.
BMC
Medicine
(2016) 14:37
Page
14
of
independent studies means that no satisfactory metabol-ite biosignatures have been discovered yet, and this em-phasises the need for additional, well-designed studies aimed specifically towards the discovery of diagnostic markers.
Conclusion
Current diagnostics are inadequate and -omics approaches provide evidence that it may be possible to use the host response to diagnose TB. However, there are common limitations to the -omics studies described and we suggest the following framework for future TB biomarker studies.
Firstly, TB case definitions (Box 2) and time of sampling need to be standardised and clearly distinguishable on a case-by-case basis. Since treatment effects on the tran-scriptome have been described as early as 1 or 2 weeks [54, 55], samples should ideally be taken pre-treatment.
Secondly, technical aspects of experiments, such as the mapping to registries, also require standardisation. For example, microarray cross-comparison problems arise when transcriptomic studies are performed using different platforms, and a move to RNA sequencing with standar-dised sequencing depth could bypass this problem. At the very least, biomarker discovery studies need to provide a clear and complete description of their methodologies to enable replication in follow-up studies with new cohorts, and therefore allow exclusion of experimental variability as a potential confounder.
Thirdly, ascertaining an adequate sample size to train classification algorithms is difficult and no consensus exists on a priori requirements. In the existing (transcriptomic) literature, sample size ranges from 3 to 883 patients. How-ever, it is expected that, if an algorithm has been trained with an adequate sample size, then algorithm performance should not deteriorate when the training set sample size is further increased. Tomlinson et al. [66] have recently dem-onstrated one way of assessing this by using computational simulations to model increasing training set sample sizes, in which they showed that test accuracy improved as sam-ple size increased.
Finally, further assessment of new biomarkers by cross-validation is an essential step in the evaluation of the signa-ture. True cross-validation involves a test set that has never contributed to model training. For example, leave-one-out validation does not meet this criterion, whereas splitting a cohort to use one part exclusively for training and the other exclusively for testing does represent a valid approach. Open access to -omics data with well-annotated, case-by-case metadata would facilitate external cross-validation with truly independent test sets and, in addition, assist in evalu-ating the applicability of a signature in different contexts. Alternatively, multi-centre studies (e.g. including high and low transmission settings) would provide an ideal environ-ment to define and validate a TB biosignature.
We expect that adherence to this framework would facili-tate biomarker discovery. Ultimately, however, prospective clinical trials need to be designed to test the impact of a diag-nostic biosignature on TB diagnosis and clinical outcomes.
In clinical practice, much of the diagnostic uncertainty in TB arises in cases which are smear-negative pending culture and where microbiological culture is more diffi-cult, such as in extrapulmonary TB, which represents up to half of the TB seen in lower transmission settings like the UK [90]. Thus far, most of the reviewed studies have been performed in the context of pulmonary, usually smear-positive, TB. A large proportion of TB presents as pulmonary TB in high transmission settings, and it is reasonable, therefore, to initially describe the host re-sponse in this homogenous sub-group [1]. It would be useful to extend future studies to include evaluation in more challenging clinical situations, and to assess whether the proposed diagnostic biomarkers can predict the risk of reactivation or progression of LTBI to active TB. In fact, the often moderate sensitivity and specificity achieved by diagnostic models based on -omics measurements may be of particular relevance for the unmet diagnostic need of such challenging settings. The World Health Organization has suggested optimal biomarker test requirements to de-tect TB as providing sensitivity≥80 % in microbiologically confirmed extrapulmonary TB and ≥68 % in smear-negative cultupositive pulmonary TB [91]. Such re-quirements are met by some of the proteomic studies that distinguished extrapulmonary TB from other cases (in-cluding pulmonary TB, healthy controls and other disease) with a sensitivity of 94.4 % [74], and smear-negative TB from healthy controls with a sensitivity of >80 % [72, 76].
Alternatively, it may be more suitable to use -omics-based tests as triage tests to rule out TB when a high sensitivity can be reached but with lower specificity. The suggested minimum requirements for a TB triage test have been set out as >90 % sensitivity and >70 % specificity [91]. Again, these requirements have been met by some of the published studies [57, 59–61, 69, 81, 92]. However, substantial technical progress is needed to reduce price, Box 2 Standardised case definitions for TB based on
World Health Organization criteria [1] Active disease
1. Bacteriologically confirmed TB
2. Presumptively treated TB
Latent infection
The presence of immune responses to Mtb antigens (IGRA or TST positive) without clinical evidence of active TB
equipment requirements and time for sample analysis and thus to make -omics tests adequate for field use [91].
Finally, while signatures containing multiple biomarkers (proteins, metabolites or transcripts) are more likely to be successful in identifying active TB, it is still worth explor-ing strategies that can reduce these to facilitate translation into diagnostic tests. For example, a minimal set of genes with a high diagnostic accuracy could be measured by more conventional techniques (e.g. PCR) in the field as demonstrated by Maertzdorf et al. [62]. It is unlikely, how-ever, that one signature will be adequate to diagnose active TB in all clinical settings and it is more conceivable that different combinations of biomarkers will confer diagnos-tic value in different settings, e.g. one set of markers for differentiating between active and latent TB, and another to diagnose TB in comparison to other diseases.
Competing interests
The authors declare that they have no competing interests.
Authors’contributions
The first draft was written by CH, JR, GP and MM. All authors contributed to the development of subsequent and final drafts. All authors approved the final version.
Financial support
The authors receive support from the MRC (JR and CH), Wellcome Trust (MM and GP), and the National Institute for Health Research University College London Hospitals Biomedical Research Centre (MN).
Received: 3 December 2015 Accepted: 8 February 2016
References
1. World Health Organization. WHO Global Tuberculosis. Report 2015. http://www.who.int/tb/publications/global_report/en/.
2. Molicotti P, Bua A, Zanetti S. Cost-effectiveness in the diagnosis of tuberculosis: choices in developing countries. J Infect Dev Ctries. 2014;8:24–38.
3. Steingart KR, Henry M, Ng V, Hopewell PC, Ramsay A, Cunningham J, Urbanczik R, Perkins M, Aziz MA, Pai M. Fluorescence versus conventional sputum smear microscopy for tuberculosis: a systematic review. Lancet Infect Dis. 2006;6:570–81.
4. Boehme C, Saacks S, O’Brien R. The changing landscape of diagnostic services for tuberculosis. Semin Respir Crit Care Med. 2013;34:17–31. 5. Parrish NM, Carroll KC. Role of the clinical mycobacteriology laboratory in
diagnosis and management of tuberculosis in low-prevalence settings. J Clin Microbiol. 2011;49:772–6.
6. Lagier J-C, Edouard S, Pagnier I, Mediannikov O, Drancourt M, Raoult D. Current and past strategies for bacterial culture in clinical microbiology. Clin Microbiol Rev. 2015;28:208–36.
7. Balasingham SV, Davidsen T, Szpinda I, Frye SA, Tønjum T. Molecular diagnostics in tuberculosis: basis and implications for therapy. Mol Diagn Ther. 2009;13:137–51.
8. Lotz A, Ferroni A, Beretti J-L, Dauphin B, Carbonnelle E, Guet-Revillet H, Veziris N, Heym B, Jarlier, V, Gaillard J-L, Pierre-Audigier C, Frapy E, Berche P, Nassif X, Bille E. Rapid identification of mycobacterial whole cells in solid and liquid culture media by matrix-assisted laser desorption ionization-time of flight mass spectrometry. J Clin Microbiol. 2010;48:4481–6.
9. Saleeb PG, Drake SK, Murray PR, Zelazny AM. Identification of mycobacteria in solid-culture media by matrix-assisted laser desorption ionization-time of flight mass spectrometry. J Clin Microbiol. 2011;49:1790–4.
10. El Khéchine A, Couderc C, Flaudrops C, Raoult D, Drancourt M. Matrix-assisted laser desorption/ionization time-of-flight mass spectrometry identification of mycobacteria in routine clinical practice. PLoS One. 2011;6:e24720.
11. Public Health England. Standards for microbiology investigations (SMI). https://www.gov.uk/government/collections/standards-for-microbiology-investigations-smi.
12. World Health Organization. Policy Statement: The use of liquid medium for culture and DST. 2007. www.who.int/tb/laboratory/policy_liquid_medium_ for_culture_dst/en/.
13. Dinnes J, Deeks J, Kunst H, Gibson A, Cummins E, Waugh N, Drobniewski F, Lalvani A. A systematic review of rapid diagnostic tests for the detection of tuberculosis infection. Health Technol Assess. 2007;11:1–196.
14. Moore DAJ, Evans CAW, Gilman RH, Caviedes L, Coronel J, Vivar A, Sanchez E, Piñedo Y, Saravia JC, Salazar C, Oberhelman R, Hollm-Delgado M-G, LaChira D, Escombe AR, Friedland JS. Microscopic-observation drug-susceptibility assay for the diagnosis of TB. N Engl J Med. 2006;355:1539–50.
15. Leung E, Minion J, Benedetti A, Pai M, Menzies D. Microcolony culture techniques for tuberculosis diagnosis: a systematic review. Int J Tuberc Lung Dis. 2012;16:16–23.
16. Kidenya BR, Kabangila R, Peck RN, Mshana SE, Webster LE, Koenig SP, Johnson WD, Fitzgerald DW. Early and efficient detection of Mycobacterium tuberculosis in sputum by microscopic observation of broth cultures. PLoS One. 2013;8:e57527.
17. Lawn SD. Point-of-care detection of lipoarabinomannan (LAM) in urine for diagnosis of HIV-associated tuberculosis: a state of the art review. BMC Infect Dis. 2012;12:103.
18. Thwaites G, Fisher M, Hemingway C, Scott G, Solomon T, Innes J. British Infection Society. British Infection Society guidelines for the diagnosis and treatment of tuberculosis of the central nervous system in adults and children. J Infect. 2009;59:167–87.
19. World Health Organization. Policy Statement: Molecular line probe assays for the rapid screening of patients at risk of multidrug-resistant tuberculosis (MDR-TB). 2008. www.who.int/tb/laboratory/line_probe_assays/en/. 20. World Health Organization. Automated real-time nucleic acid amplification
technology for rapid and simultaneous detection of tuberculosis and rifampicin resistance: Xpert MTB/RIF assay for the diagnosis of pulmonary and extrapulmonary TB in adults and children: policy update. 2013. apps. who.int/iris/bitstream/10665/112472/1/9789241506335_eng.pdf. 21. Crudu V, Stratan E, Romancenco E, Allerheiligen V, Hillemann A, Moraru N. First
evaluation of an improved assay for molecular genetic detection of tuberculosis as well as rifampin and isoniazid resistances. J Clin Microbiol. 2012;50:1264–9. 22. Barnard M. Gey van Pittius NC, van Helden PD, Bosman M, Coetzee G,
Warren RM. The diagnostic performance of the GenoType MTBDRplus version 2 line probe assay is equivalent to that of the Xpert MTB/RIF assay. J Clin Microbiol. 2012;50:3712–6.
23. Blakemore R, Nabeta P, Davidow AL, Vadwai V, Tahirli R, Munsamy V, Nicol M, Jones M, Persing DH, Hillemann D, Ruesch-Gerdes S, Leisegang F, Zamudio C, Rodrigues C, Boehme CC, Perkins MD, Alland D. A multisite assessment of the quantitative capabilities of the Xpert MTB/RIF assay. Am J Respir Crit Care Med. 2011;184:1076–84.
24. Steingart KR, Sohn H, Schiller I, Kloda LA, Boehme CC, Pai M, Dendukuri N. Xpert® MTB/RIF assay for pulmonary tuberculosis and rifampicin resistance in adults. Cochrane Database Syst Rev. 2013;1:CD009593.
25. Lawn SD, Zumla AI. Diagnosis of extrapulmonary tuberculosis using the Xpert® MTB/RIF assay. Expert Rev Anti Infect Ther. 2012;10:631–5. 26. Penz E, Boffa J, Roberts DJ, Fisher D, Cooper R, Ronksley PE, James MT.
Diagnostic accuracy of the Xpert® MTB/RIF assay for extra-pulmonary tuberculosis: a meta-analysis. Int J Tuberc Lung Dis. 2015;19:278–84. i–iii. 27. Friedrich SO, von Groote-Bidlingmaier F, Diacon AH. Xpert MTB/RIF assay for
diagnosis of pleural tuberculosis. J Clin Microbiol. 2011;49:4341–2. 28. Walker TM, Ip CLC, Harrell RH, Evans JT, Kapatai G, Dedicoat MJ, Eyre DW,
Wilson DJ, Hawkey PM, Crook DW, Parkhill J, Harris D, Walker AS, Bowden R, Monk P, Smith EG, Peto TEA. Whole-genome sequencing to delineate Mycobacterium tuberculosis outbreaks: a retrospective observational study. Lancet Infect Dis. 2013;13:137–46.
29. Walker TM, Lalor MK, Broda A, Saldana Ortega L, Morgan M, Parker L, Churchill S, Bennett K, Golubchik T, Giess AP, Del Ojo Elias C, Jeffery KJ, Bowler ICJW, Laurenson IF, Barrett A, Drobniewski F, McCarthy ND, Anderson LF, Abubakar I, Thomas HL, Monk P, Smith EG, Walker AS, Crook DW, Peto TEA, Conlon CP. Assessment of Mycobacterium tuberculosis transmission in Oxfordshire, UK, 2007-12, with whole pathogen genome sequences: an observational study. Lancet Respir Med. 2014;2:285–92.
30. Bryant JM, Harris SR, Parkhill J, Dawson R, Diacon AH, van Helden P, Pym A, Mahayiddin AA, Chuchottaworn C, Sanne IM, Louw C, Boeree MJ, Hoelscher
M, McHugh TD, Bateson ALC, Hunt RD, Mwaigwisya S, Wright L, Gillespie SH, Bentley SD. Whole-genome sequencing to establish relapse or re-infection with Mycobacterium tuberculosis: a retrospective observational study. Lancet Respir Med. 2013;1:786–92.
31. Köser CU, Bryant JM, Becq J, Török ME, Ellington MJ, Marti-Renom MA, Carmichael AJ, Parkhill J, Smith GP, Peacock SJ. Whole-genome sequencing for rapid susceptibility testing of M. tuberculosis. N Engl J Med. 2013;369:290–2. 32. Outhred AC, Jelfs P, Suliman B, Hill-Cawthorne GA, Crawford ABH, Marais BJ,
Sintchenko V. Added value of whole-genome sequencing for management of highly drug-resistant TB. J Antimicrob Chemother. 2015;70:1198–202. 33. Coll F, McNerney R, Preston MD, Guerra-Assunção JA, Warry A,
Hill-Cawthorne G, Mallard K, Nair M, Miranda A, Alves A, Perdigão J, Viveiros M, Portugal I, Hasan Z, Hasan R, Glynn JR, Martin N, Pain A, Clark TG. Rapid determination of anti-tuberculosis drug resistance from whole-genome sequences. Genome Med. 2015;7:51.
34. Walker TM, Kohl TA, Omar SV, Hedge J, Del Ojo EC, Bradley P, Iqbal Z, Feuerriegel S, Niehaus KE, Wilson DJ, Clifton DA, Kapatai G, Ip CLC, Bowden R, Drobniewski FA, Allix-Béguec C, Gaudin C, Parkhill J, Diel R, Supply P, Crook DW, Smith EG, Walker AS, Ismail N, Niemann S, Peto TEA, Modernizing Medical Microbiology (MMM) Informatics Group. Whole-genome sequencing for prediction of Mycobacterium tuberculosis drug susceptibility and resistance: a retrospective cohort study. Lancet Infect Dis. 2015;15:1193–202.
35. Witney AA, Gould KA, Arnold A, Coleman D, Delgado R, Dhillon J, Pond MJ, Pope CF, Planche TD, Stoker NG, Cosgrove CA, Butcher PD, Harrison TS, Hinds J. Clinical application of whole-genome sequencing to inform treatment for multidrug-resistant tuberculosis cases. J Clin Microbiol. 2015;53:1473–83. 36. Votintseva AA, Pankhurst LJ, Anson LW, Morgan MR, Gascoyne-Binzi D,
Walker TM, Quan TP, Wyllie DH, Del Ojo Elias C, Wilcox M, Walker AS, Peto TEA, Crook DW. Mycobacterial DNA extraction for whole-genome sequencing from early positive liquid (MGIT) cultures. J Clin Microbiol. 2015;53:1137–43. 37. Doughty EL, Sergeant MJ, Adetifa I, Antonio M, Pallen MJ.
Culture-independent detection and characterisation of Mycobacterium tuberculosis and M. africanum in sputum samples using shotgun metagenomics on a benchtop sequencer. PeerJ. 2014;2:e585.
38. Brown AC, Bryant JM, Einer-Jensen K, Holdstock J, Houniet DT, Chan JZM, Depledge DP, Nikolayevskyy V, Broda A, Stone MJ, Christiansen MT, Williams R, McAndrew MB, Tutill H, Brown J, Melzer M, Rosmarin C, McHugh TD, Shorten RJ, Drobniewski F, Speight G, Breuer J. Rapid whole-genome sequencing of mycobacterium tuberculosis isolates directly from clinical samples. J Clin Microbiol. 2015;53:2230–7.
39. Kerkhoff AD, Wood R, Vogt M, Lawn SD. Predictive value of anaemia for tuberculosis in HIV-infected patients in sub-Saharan Africa: an indication for routine microbiological investigation using new rapid assays. J Acquir Immune Defic Syndr. 2014;66:33–40.
40. Ramakrishnan L. Revisiting the role of the granuloma in tuberculosis. Nat Rev Immunol. 2012;12:352–66.
41. Chen RY, Dodd LE, Lee M, Paripati P, Hammoud DA, Mountz JM, Jeon D, Zia N, Zahiri H, Coleman MT, Carroll MW, Lee JD, Jeong YJ, Herscovitch P, Lahouar S, Tartakovsky M, Rosenthal A, Somaiyya S, Lee S, Goldfeder LC, Cai Y, Via LE, Park S-K, Cho S-N, Barry CE. PET/CT imaging correlates with treatment outcome in patients with multidrug-resistant tuberculosis. Sci Transl Med. 2014;6:265ra166. 42. Chang KC, Leung CC. Systematic review of interferon-gamma release assays
in tuberculosis: focus on likelihood ratios. Thorax. 2010;65:271–6. 43. Menzies D, Pai M, Comstock G. Meta-analysis: new tests for the diagnosis of
latent tuberculosis infection: areas of uncertainty and recommendations for research. Ann Intern Med. 2007;146:340–54.
44. Pai M, Zwerling A, Menzies D. Systematic review: T-cell-based assays for the diagnosis of latent tuberculosis infection: an update. Ann Intern Med. 2008;149:177–84.
45. Metcalfe JZ, Everett CK, Steingart KR, Cattamanchi A, Huang L, Hopewell PC, Pai M. Interferon-γrelease assays for active pulmonary tuberculosis diagnosis in adults in low- and middle-income countries: systematic review and meta-analysis. J Infect Dis. 2011;204 Suppl 4:S1120–9.
46. Sester M, Sotgiu G, Lange C, Giehl C, Girardi E, Migliori GB, Bossink A, Dheda K, Diel R, Dominguez J, Lipman M, Nemeth J, Ravn P, Winkler S, Huitric E, Sandgren A, Manissero D. Interferon-γrelease assays for the diagnosis of active tuberculosis: a systematic review and meta-analysis. Eur Respir J. 2011;37:100–11.
47. Mistry R, Cliff JM, Clayton CL, Beyers N, Mohamed YS, Wilson PA, Dockrell HM, Wallace DM, van Helden PD, Duncan K, Lukey PT. Gene-expression patterns in whole blood identify subjects at risk for recurrent tuberculosis. J Infect Dis. 2007;195:357–65.
48. Bloom CI, Graham CM, Berry MPR, Rozakeas F, Redford PS, Wang Y, Xu Z, Wilkinson KA, Wilkinson RJ, Kendrick Y, Devouassoux G, Ferry T, Miyara M, Bouvry D, Dominique V, Gorochov G, Blankenship D, Saadatian M, Vanhems P, Beynon H, Vancheeswaran R, Wickremasinghe M,Chaussabel D, Banchereau J, Pascual V, Ho L, Lipman M, O’Garra A. Transcriptional blood signatures distinguish pulmonary tuberculosis, pulmonary sarcoidosis, pneumonias and lung cancers. PLoS One. 2013;8:e70630.
49. Koth LL, Solberg OD, Peng JC, Bhakta NR, Nguyen CP, Woodruff PG. Sarcoidosis blood transcriptome reflects lung inflammation and overlaps with tuberculosis. Am J Respir Crit Care Med. 2011;184:1153–63.
50. Maertzdorf J, Ota M, Repsilber D, Mollenkopf HJ, Weiner J, Hill PC, Kaufmann SHE. Functional Correlations of pathogenesis-driven gene expression signatures in tuberculosis. PLoS One. 2011;6:e26938.
51. Maertzdorf J, Weiner J, Mollenkopf H-J, TBornotTB Network, Bauer T, Prasse A, Müller-Quernheim J, Kaufmann SHE. Common patterns and disease-related signatures in tuberculosis and sarcoidosis. Proc Natl Acad Sci U S A. 2012;109:7853–8.
52. Ottenhoff THM, Dass RH, Yang N, Zhang MM, Wong HEE, Sahiratmadja E, Khor CC, Alisjahbana B, van Crevel R, Marzuki S, Seielstad M, van de Vosse E, Hibberd ML. Genome-wide expression profiling identifies type 1 interferon response pathways in active tuberculosis. PLoS One. 2012;7:e45839. 53. Stern JNH, Keskin DB, Romero V, Zuniga J, Encinales L, Li C, Awad C, Yunis
EJ. Molecular signatures distinguishing active from latent tuberculosis in peripheral blood mononuclear cells, after in vitro antigenic stimulation with purified protein derivative of tuberculin (PPD) or Candida: a preliminary report. Immunol Res. 2009;45:1–12.
54. Cliff JM, Lee J-S, Constantinou N, Cho J-E, Clark TG, Ronacher K, King EC, Lukey PT, Duncan K, Helden PDV, Walzl G, Dockrell HM. Distinct phases of blood gene expression pattern through tuberculosis treatment reflect modulation of the humoral immune response. J Infect Dis. 2013;207(1):18–29.
55. Bloom CI, Graham CM, Berry MPR, Wilkinson KA, Oni T, Rozakeas F, Xu Z, Rossello-Urgell J, Chaussabel D, Banchereau J, Pascual V, Lipman M, Wilkinson RJ, O’Garra A. Detectable changes in the blood transcriptome are present after two weeks of antituberculosis therapy. PLoS One. 2012;7:e46191.
56. Maertzdorf J, Repsilber D, Parida SK, Stanley K, Roberts T, Black G, Walzl G, Kaufmann SHE. Human gene expression profiles of susceptibility and resistance in tuberculosis. Genes Immun. 2011;12:15–22.
57. Berry MPR, Graham CM, McNab FW, Xu Z, Bloch SAA, Oni T, Wilkinson KA, Banchereau R, Skinner J, Wilkinson RJ, Quinn C, Blankenship D, Dhawan R, Cush JJ, Mejias A, Ramilo O, Kon OM, Pascual V, Banchereau J, Chaussabel D, O’Garra A. An interferon-inducible neutrophil-driven blood transcriptional signature in human tuberculosis. Nature. 2010;466:973–7.
58. Cai Y, Yang Q, Tang Y, Zhang M, Liu H, Zhang G, Deng Q, Huang J, Gao Z, Zhou B, Feng CG, Chen X. Increased complement C1q level marks active disease in human tuberculosis. PLoS One. 2014;9:e92340.
59. Kaforou M, Wright VJ, Oni T, French N, Anderson ST, Bangani N, Banwell CM, Brent AJ, Crampin AC, Dockrell HM, Eley B, Heyderman RS, Hibberd ML, Kern F, Langford PR, Ling L, Mendelson M, Ottenhoff TH, Zgambo F, Wilkinson RJ, Coin LJ, Levin M. Detection of Tuberculosis in HIV-infected and -uninfected African adults using whole blood RNA Expression signatures: a case-control study. PLoS Med. 2013;10:e1001538.
60. Anderson ST, Kaforou M, Brent AJ, Wright VJ, Banwell CM, Chagaluka G, Crampin AC, Dockrell HM, French N, Hamilton MS, Hibberd ML, Kern F, Langford PR, Ling L, Mlotha R, Ottenhoff THM, Pienaar S, Pillay V, Scott JAG, Twahir H, Wilkinson RJ, Coin LJ, Heyderman RS, Levin M, Eley B, ILULU Consortium. KIDS TB Study Group. Diagnosis of childhood tuberculosis and host RNA expression in Africa. N Engl J Med. 2014;370:1712–23.
61. Walter ND, Miller MA, Vasquez J, Weiner M, Chapman A, Engle M, Higgins M, Quinones AM, Roselli V, Canono E, Yoon C, Cattamanchi A, Davis JL, Phang T, Stearman RS, Datta G, Garcia BJ, Daley CL, Strong M, Kechris K, Fingerlin TE, Reves R, Geraci MW. Blood transcriptional biomarkers for active TB among US patients: A case-control study with systematic cross-classifier evaluation. J Clin Microbiol. 2016;54(2):274–82.
62. Maertzdorf J, McEwen G, Weiner J, Tian S, Lader E, Schriek U, Mayanja-Kizza H, Ota M, Kenneth J, Kaufmann SH. Concise gene signature for point-of-care classification of tuberculosis. EMBO Mol Med. 2015;8(2):86–95.
63. Dawany N, Showe LC, Kossenkov AV, Chang C, Ive P, Conradie F, Stevens W, Sanne I, Azzoni L, Montaner LJ. Identification of a 251 gene expression signature that can accurately detect M. tuberculosis in patients with and without HIV co-infection. PLoS One. 2014;9:e89925.
![Fig. 1 Venn diagrams of selected published transcriptomic signatures. Signatures were compared by gene symbol annotation, and the overlaptuberculosis infection,27 = 27-transcript signature of TB versus LTBI [59]; Anderson 42 = 42-transcript signature of TB](https://thumb-us.123doks.com/thumbv2/123dok_us/8918007.1840127/7.595.56.541.86.273/transcriptomic-signatures-signatures-annotation-overlaptuberculosis-transcript-signature-transcript.webp)