www.ijper.org
Assessment of reliability, sensitivity, objectivity and
validity of MCQ Pharmacology Exams as a potential
output variable for predictive analysis
Mariusz Panczyk*, Joanna Gotlib
Department of Teaching and Outcomes of Education, Faculty of Health Science, Medical University of Warsaw, Poland
ABSTRACT
Aim: The study aimed to assess the reliability, sensitivity, objectivity and validity of the multiple-choice question (MCQ) Pharmacology Exams conducted between 2009-2014 at the Faculty of Pharmacy, Medical University of Warsaw (MUW), and to analyse the correlations between its results and the chosen criteria of selection of candidates for Pharmacy. Methods: A 6-year retrospective surveillance analysis using the admissions data of candidates for Pharmacy in the years 2005-2010 (N=584) and multi-stage pharmacology exam results from the years 2009-2014 (N=757) conducted at the MUW. The analysis of the quality of the MCQ Pharmacology Exams conducted in the form of a 100-question test comprised a comparison of parameters of item easiness and discriminating power of particular exam tasks and mean test difficulty of the entire exam. Cranach’s α coefficient and Guttman split-half reliability coefficient was estimated to determine the reliability level of the MCQ exams. Results: Reliability of Pharmacology exams estimated with Cronbach’s α coefficient (values ranging between 0.786 and 0.884) as well as Guttman split-half reliability coefficient (between 0.807 and 0.894) showed diversity of internal consistency. The objectivity of assessment of students was analysed with the use of score thresholds, which demonstrated that the “passed/failed” cut-off point was always at the same level. The analysis of correlations between the results of MCQ Pharmacology Exams and admission exam showed no systematically occurring correlations between those variables. Conclusion: The analysis of reliability, sensitivity, objectivity and validity of the Pharmacology Exams conducted at the Faculty of Pharmacy, MUW demonstrated that, with all methodological limitations of retrospective studies, the scores of these exams might constitute a good output variable for a predictive assessment.
Key words: Performance, Admission, Output variable, Academic Progression, Pharmacy
Students, Pharmacy Education. DOI: Correspondence Address10.5530/ijper.49.1.1
Mr. Mariusz Panczyk
Division of Teaching and Outcomes of Education, Faculty of Health Sci-ence, Medical University of Warsaw, Zwirki i Wigury- 61, 02-091 Warsaw, Poland. E-Mail: mariusz.panczyk@ wum.edu.pl
INTRODUCTION
An admission policy of university-level schools offering programmes for apoth-ecaries and pharmacists should ensure the selection of the best candidates for this responsible profession. In Poland, begin-ning with 2005, the admission system for pharmacy is based on the selection of candidates on account of the results of their matura exam –high-school exit exam (equivalent to A-levels in UK, Baccalauréat
Submission Date : 24-08-2014 Revision Date : 17-10-2014 Accepted Date : 09-12-2014
at the basic level. However, the selection of candidates based solely on the “cognitive” criteria is somewhat crit-icised.3 The lack of structured non-cognitive measures does not give certainty with reference to anticipating the potential to develop professional attitudes. The above admission strategy lies between two opposite patterns: the one used in countries admitting all candidates reach-ing minimal standards with subsequent selection after
the first year of studies and the other used in countries
applying both cognitive and structured non-cognitive instruments for the selection process.1
Over 100 persons graduate from the Faculty of Phar-macy, MUW each year and the number of failures among students does not exceed 15% of the total. The selection of reliable and valid selection criteria allows for a better assessment whether students shall achieve the assumed outcomes of education and whether grad-uates shall achieve professional success. The available literature presents a number of publications on
assess-ment of various factors that may influence the effec -tiveness of studying this major.4-16 Different authors most often list the following predictors (explanatory variables): pre-pharmacy GPA (grade point average),11 personal interview scores,14 California Critical Think-ing Skills Test (CCTST), Health Sciences ReasonThink-ing Test (HSRT)15 and Pharmacy College Admission Test (PCAT) scores.6 In order to make the predictive analy-sis reliable, selected outcome variables should accurately assess this very competence that may account for the success of a Pharmacy student or graduate. The most common output variables in correlation analyses and multiple regression include: academic performance in
the first-year of pharmacy school,12 GPA for biomedi-cal courses, performance in pharmaceutibiomedi-cal science courses, performance in the pharmacotherapy course sequence, GPA in all pharmacy practice and required clerkship courses,13 and finally North American Phar
-macist Licensure Examination (NAPLEX) test.16 Pharmacists in Poland are trained on integrated full-time programmes17 that last five and half years, includ -ing 10 semesters of study-ing at university and one additional semester of a compulsory internship in a pharmacy leading to be granted the right to practise the
profession (no NAPLEX type final exam). Following
the curriculum, students take an exam in pharmacol-ogy and pharmacodynamics at the end of the eighth semester. With pharmacokinetic issues, they constitute an essential component of proper understanding of the mechanisms of action of drugs and practical use of medicinal products in pharmacotherapy. Due to the
fact that acquiring knowledge and skills in this field is
of great importance for development of key compe-tence of prospective pharmacists,18 it may be assumed
that this might be a good output variable for predictive assessment. Performance in the pharmacology course,13
that is reflected by the score obtained on multiple-choice
question (MCQ) exam, may be one of the most impor-tant methods for assessment of the level of student’s preparation for the profession of pharmacist.
The present study aimed to assess the reliability, sen-sitivity, objectivity and validity of the MCQ Pharma-cology Exams conducted between 2009-2014 at the Faculty of Pharmacy, MUW and to analyse the correla-tions between its results and the chosen criteria of selec-tion of candidates for Pharmacy.
METHODS
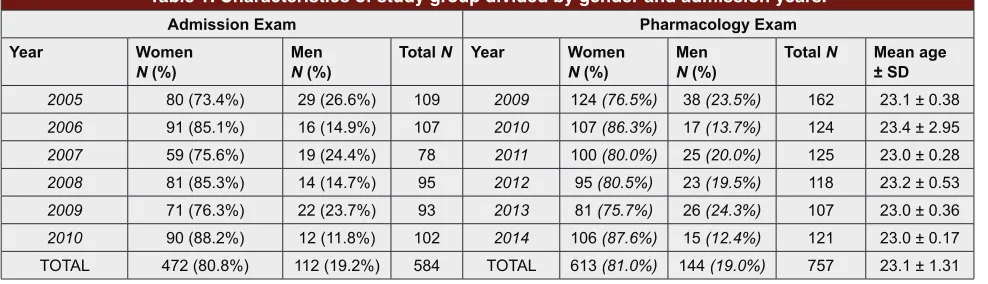
A 6-year retrospective surveillance analysis was per-formed using the admission data of candidates for Pharmacy in the years 2005-2010 (N=584) and the results of multi-stage exams in pharmacology in the years 2009-2014 (N=757, mean age for each year: 23.1 ±1.31) conducted at the MUW. See Table 1 for details on the study group.
Raw data were preprocessed using TESTY version 7 (Testy komputerowe, Copyright© 1994-2014 by
Sławomir Zalewski). Information was read in the data -base, processed in Microsoft Excel 2010 (Microsoft Corporation) and exported to Statistical version 10 (Stat Soft, Inc.) for further analysis. All programs were used in compliance with the MUW license.
The admission data comprised the following: total point score obtained on the admission exam and isolated scores in chemistry and biology, as well as, addition-ally, in mathematics for the year 2010. The analysis of quality of the Pharmacology Exams conducted in the form of a 100-question test comprised a comparison of parameters of item easiness and discriminating power
of particular exam tasks and mean test difficulty of the entire exam. Cronbach’s α coefficient (the Kuder–Rich -ardson Formula 20 for a test comprising dichotomous variables)19 and Guttman split-half reliability coeffi -cient were estimated to determine the reliability level of tests.20
Normal distribution parameters of particular pharma -cology exam results were assessed using the Shapiro-Wilk test and data were screened for outliers using Grubbs test. The equivalence of particular editions of the exam was estimated with a comparison of medians with the Mann-Whitney U test or comparison of means with Student’s t-test, depending on meeting the condi-tions. Cohen’s d was used to estimate the effect size of difference.21
One-way analysis of variance ANOVA and post-hoc RIR
assess the discriminatory capacity of the pool of ques-tions in particular pharmacology exams. The analysis was preceded by Levene’s test for homogeneity of vari-ances. The Kruskal–Wallis one-way analysis of variance test and post-hoc multiple comparisons of mean ranks were used to compare score requirements for particular grades on the pharmacology exam.
Pearson’s r linear correlation coefficient was used to
assess the strength of the correlation between the score obtained by a student on the admission exam and the score on the pharmacology exam. The correlation anal-ysis was also performed for the results in thematic sub-groups: chemistry and biology (years 2005-2010) as well as mathematics (only for the 2010 year).
For all analyses, the a priori level of significance was
established at 0.05.
RESULTS
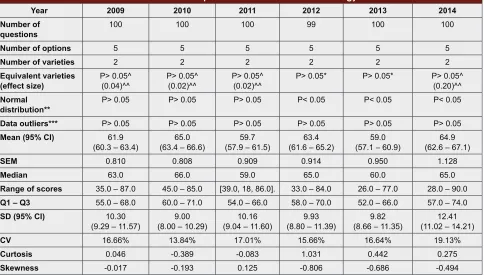
The analysis of particular pharmacology exam edi-tions by nature of distribution of this variable showed a nearly normal distribution with a slight deviation from symmetry (slight skewness) in most cases. Furthermore, particular editions of the MCQ exams did not differ
sig-nificantly with respect to the scope of variability of the
results. The comparative analysis of both exam varieties in each year of the study demonstrated the maintenance of equivalence. All effect sizes were less than 0.20, the value below which it is commonly considered to indicate a negligible effect. See Table 2 for a list of all results. Reliability of Pharmacology exams estimated with
Cronbach’s αcoefficient (values ranging between0.786 and 0.884) as well as Guttman split-half reliability
coef-ficient (between 0.807 and 0.894) showed diversity of
internal consistency. A detailed evaluation of the test scores allowed for the selection of test questions with a
negative correlation, i.e. significantly decreasing the reli -ability of the exam. With these questions excluded from the exam set, the overall reliability of tests, measured
with Cronbach’s α, has increased (Table 3).
A detailed analysis of quality parameters of particular questions in pharmacology allowed for an assessment
of the level of difficulty and discriminating power of
exam tasks in subsequent years. Although the index of
test difficulty was slightly different for particular exams
(values ranging between 0.59 and 0.65), no statistically
significant difference was found in the mean values of
item easiness of the pool of questions for subsequent years (analysis of variance, P>0.05). A comparison of discriminating power of the exam questions
dem-onstrated significant differences (analysis of variance,
P<0.01). The analysis with post-hoc RIR Tukey
hon-estly significant difference test showed that the mean
discriminating power of the questions in the 2014 exam
was significantly greater compared to those used in the
preceding years.
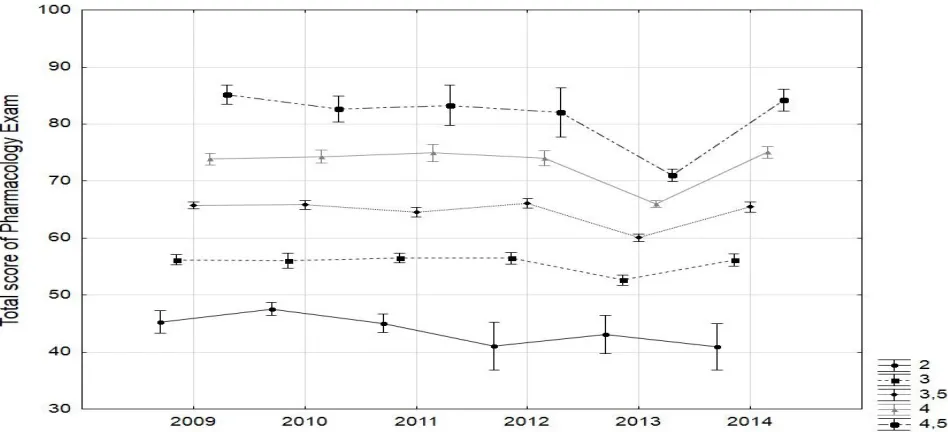
Due to the fact that the course grade ranging between 2
and 5 (2, 3, 3.5, 4, 4.5, 5) constituted the final result of
pharmacology exam, score requirements for particular grades were compared. Figure 1 show that only in 2013 score thresholds were lowered for all grades, except for the “passed/failed” cut-off point (discrimination between grades 2 and 3). The point range and degree of
diversification of scores within particular grades were
constant in the remaining exam editions. See Table 4 for detailed comparative analysis of the grading scale. The analysis of correlations between the score obtained by students on pharmacology exam and results of the
entrance exam for Pharmacy demonstrated no signifi -cant correlations between the variables for the 2011 and 2012 years. Among the remaining years, positive corre-lations were observed for the results in chemistry (2009, 2010, and 2013) and biology (2013 and 2014), but they were not strongly correlated (Pearson’s r<0.35). The sum of ranking points also correlated with the pharma-cology exam results in the following three editions: the 2009, 2013 and 2014 years. Positive correlations between the results of the pharmacology exam and all selection criteria for Pharmacy candidates were observed only in 2013. See Table 5 for the results of correlation analysis.
Table 1: Characteristics of study group divided by gender and admission years.
Admission Exam Pharmacology Exam
Year Women
N (%) MenN (%) Total N Year WomenN (%) MenN (%) Total N Mean age ± SD
2005 80 (73.4%) 29 (26.6%) 109 2009 124 (76.5%) 38 (23.5%) 162 23.1 ± 0.38
2006 91 (85.1%) 16 (14.9%) 107 2010 107 (86.3%) 17 (13.7%) 124 23.4 ± 2.95
2007 59 (75.6%) 19 (24.4%) 78 2011 100 (80.0%) 25 (20.0%) 125 23.0 ± 0.28
2008 81 (85.3%) 14 (14.7%) 95 2012 95 (80.5%) 23 (19.5%) 118 23.2 ± 0.53
2009 71 (76.3%) 22 (23.7%) 93 2013 81 (75.7%) 26 (24.3%) 107 23.0 ± 0.36
2010 90 (88.2%) 12 (11.8%) 102 2014 106 (87.6%) 15 (12.4%) 121 23.0 ± 0.17
Table 2: Characteristics of particular editions of Pharmacology Exams
Year 2009 2010 2011 2012 2013 2014
Number of
questions 100 100 100 99 100 100
Number of options 5 5 5 5 5 5
Number of varieties 2 2 2 2 2 2
Equivalent varieties
(effect size) P> 0.05^(0.04)^^ P> 0.05^(0.02)^^ P> 0.05^(0.02)^^ P> 0.05* P> 0.05* P> 0.05^(0.20)^^ Normal
distribution** P> 0.05 P> 0.05 P> 0.05 P< 0.05 P< 0.05 P< 0.05
Data outliers*** P> 0.05 P> 0.05 P> 0.05 P> 0.05 P> 0.05 P> 0.05
Mean (95% CI) 61.9
(60.3 – 63.4) (63.4 – 66.6)65.0 (57.9 – 61.5)59.7 (61.6 – 65.2)63.4 (57.1 – 60.9)59.0 (62.6 – 67.1)64.9
SEM 0.810 0.808 0.909 0.914 0.950 1.128
Median 63.0 66.0 59.0 65.0 60.0 65.0
Range of scores 35.0 – 87.0 45.0 – 85.0 [39.0, 18, 86.0]. 33.0 – 84.0 26.0 – 77.0 28.0 – 90.0
Q1 – Q3 55.0 – 68.0 60.0 – 71.0 54.0 – 66.0 58.0 – 70.0 52.0 – 66.0 57.0 – 74.0
SD (95% CI) 10.30
(9.29 – 11.57) (8.00 – 10.29)9.00 (9.04 – 11.60)10.16 (8.80 – 11.39)9.93 (8.66 – 11.35)9.82 (11.02 – 14.21)12.41
CV 16.66% 13.84% 17.01% 15.66% 16.64% 19.13%
Curtosis 0.046 -0.389 -0.083 1.031 0.442 0.275
Skewness -0.017 -0.193 0.125 -0.806 -0.686 -0.494
^ Student's t-test (for P< 0.05 varieties are not equivalent) : ^^ Effect size - based on mean differences between samples in terms of standard deviation units (Cohen's d) : * Mann-Whitney U test(for P< 0.05 varieties are not equivalent) : ** Shapiro-Wilk test (for P < 0.05 distribution is not normal) : *** Grubbs test for outliers (for P < 0.05 presence of outliers) : CI – confidence interval; SEM – standard error of the mean; Q1 – first quartile; Q3 – third quartile; SD - standard deviation; CV - coefficient of
variation
Table 3: Results of analysis of reliability and qualitative parameters for pharmacology tests conducted between 2009-2014
Year 2009 2010 2011 2012 2013 2014
Guttman split-half reliability
coefficient 0.807 0.821 0.809 0.873 0.851 0.894
Cronbach’s α 0.821 0.786 0.827 0.828 0.818 0.884
Number of questions needed to
achieve α = 0.85* 124 154 118 116 126 74
Number of questions with negative
correlation 8 8 6 9 11 3
Cronbach’s α after optimization 0.843 0.805 0.845 0.848 0.845 0.888
Index of test difficulty 0.62 0.65 0.60 0.64 0.59 0.65
Average power discriminating 0.233 0.209 0.238 0.245 0.234 0.283
* calculated using the Spearman–Brown prediction formula
DISCUSSION
Predictive studies on the effectiveness of the admission procedure for Pharmacy candidates are usually based on correlation analyses and regression models.4-16 However,
these studies shall not be reliable without verified output
variables. Reliability (how is it measured?), sensitivity, objectivity, and validity (what is measured?) constitute important components of a comprehensive assessment of tools used for educational measurement.
Various analytical methods may be applied to assess
whether a particular assessment tool (such as an exam test) is reliable. Estimating the degree of correlation
between the scores in particular parts of a test (e.g. odd-even or split-half reliability)20 and assessing internal con-sistency of the results using the assessment of average
variances of all exam tasks (Cronbach’s α-coefficient –
the Kuder–Richardson Formula 20 for a test comprising dichotomous variables) are most frequently applied.19
Cronbach’s α yields a reliability estimate of internal con -sistency by examining the homogeneity of the questions within a test based on the number of items in the test, standard deviation of the total score, and proportion of candidates answering each item correctly.22 In the
accepted, is enough to evaluate individual differences between candidates.23 The assessment with Guttman
split-half reliability coefficient that measures correla -tions between both halves of a test, also produced values greater than 0.8. In order to select test halves, a random sampling of 50 questions was performed using
stratification that involved dividing the pool of ques -tions into thematic areas, distinguished in accordance with the test content outlines. It needs to be emphasised that it is important to obtain high values of the
reli-ability coefficient (higher than 0.9) if it is necessary to
perform differentiation inside general results, e.g. when we need to compare achievements of candidates within
different thematic areas or fields of a particular subject
(so called subtests). An improvement of reliability of the MCQ exam may be achieved by extending a mea-surement scale. Calculations with Spearman-Brown prophecy formula showed that an increase in reliability of measurement may be achieved by adding more ques-tions to the pool. Obviously, seeking exclusively high
values of Cronbach’s and Guttman’s coefficients does
not guarantee exam reliability, since high values of these
coefficients only minimize the impact of random errors
on the results and do not guarantee the lack of system-atic errors that might be even serious.24
Apart from the reliability coefficient, a standard error
of the mean (SEM) is also an essential parameter for assessment of tools used for educational measurement. SEM represents an estimate of the possible amount of error present in a test score, or the variability of candidate’s scores if tested repeatedly with the same test.22 Measurement theoreticians (among them Robert L. Brennan) have emphasised that a standard error of
measurement is less dependent on the study
popula-tion compared to a reliability coefficient.25 Low value of SEM (<1.0) allowed for an assumption that the pharma-cology tests produced very precise assessment. This was
indicated by narrow (95%) confidence intervals for the
mean and standard deviation in subsequent editions of the MCQ exams.
Sensitivity, understood as a capacity of a particular tool
to find even the smallest differences between the study
parameters, is an important feature of exam tests that needs to be evaluated.26 An MCQ exam should have high discriminatory capacity measured with discrimi-nating power. In the literature, questions with high dis-criminatory capacity are referred to as “burst tasks”27
since they cause the flatness of the distribution of
results (curtosis<0), which facilitates discrimination and grading. Discriminating capacity with the MCQs is also associated with the item easiness parameter. Questions
from opposite categories (very difficult and very easy)
are characterised by low discriminating power, occasion-ally even negative. It needs to be emphasised that a large number of easy and approving questions that require
only confirmation of correctness of given information
(e.g. the use of ‘‘all of the above’’ (AOTA) and ‘‘none
of the above’’ (NOTA) as options) is intellectually less
demanding and contributes to obtaining better scores.28 Therefore, a proper selection of questions with refer-ence to item easiness and differentiating power needs to be assured during the test making process. The com-parison of the above qualitative parameters for subse-quent editions of pharmacology exam showed that the mean values of differentiating power of questions was
higher than 0.2 (for the 2014 exam it was significantly
Figure 1: Diagram for mean scores necessary to receive a particular grade that was given on the basis of pharmacology exam results (vertical columns show 95% confidence intervals for mean). Due to a small number of students with a 5, the analysis
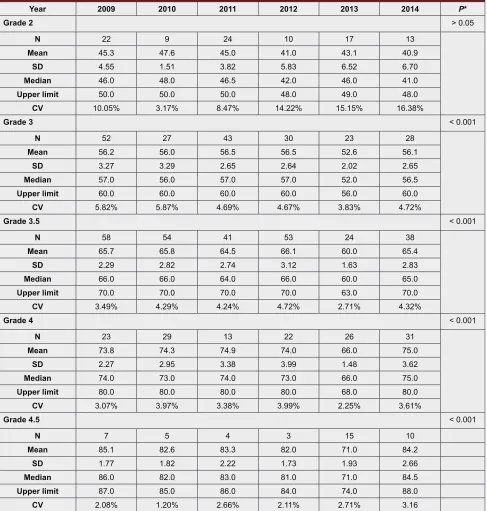
Table 4: Comparison of scores required for particular grades on pharmacology exam in subsequent years of the study.
Year 2009 2010 2011 2012 2013 2014 P*
Grade 2 > 0.05
N 22 9 24 10 17 13
Mean 45.3 47.6 45.0 41.0 43.1 40.9
SD 4.55 1.51 3.82 5.83 6.52 6.70
Median 46.0 48.0 46.5 42.0 46.0 41.0
Upper limit 50.0 50.0 50.0 48.0 49.0 48.0
CV 10.05% 3.17% 8.47% 14.22% 15.15% 16.38%
Grade 3 < 0.001
N 52 27 43 30 23 28
Mean 56.2 56.0 56.5 56.5 52.6 56.1
SD 3.27 3.29 2.65 2.64 2.02 2.65
Median 57.0 56.0 57.0 57.0 52.0 56.5
Upper limit 60.0 60.0 60.0 60.0 56.0 60.0
CV 5.82% 5.87% 4.69% 4.67% 3.83% 4.72%
Grade 3.5 < 0.001
N 58 54 41 53 24 38
Mean 65.7 65.8 64.5 66.1 60.0 65.4
SD 2.29 2.82 2.74 3.12 1.63 2.83
Median 66.0 66.0 64.0 66.0 60.0 65.0
Upper limit 70.0 70.0 70.0 70.0 63.0 70.0
CV 3.49% 4.29% 4.24% 4.72% 2.71% 4.32%
Grade 4 < 0.001
N 23 29 13 22 26 31
Mean 73.8 74.3 74.9 74.0 66.0 75.0
SD 2.27 2.95 3.38 3.99 1.48 3.62
Median 74.0 73.0 74.0 73.0 66.0 75.0
Upper limit 80.0 80.0 80.0 80.0 68.0 80.0
CV 3.07% 3.97% 3.38% 3.99% 2.25% 3.61%
Grade 4.5 < 0.001
N 7 5 4 3 15 10
Mean 85.1 82.6 83.3 82.0 71.0 84.2
SD 1.77 1.82 2.22 1.73 1.93 2.66
Median 86.0 82.0 83.0 81.0 71.0 84.5
Upper limit 87.0 85.0 86.0 84.0 74.0 88.0
CV 2.08% 1.20% 2.66% 2.11% 2.71% 3.16
* Kruskal–Wallis one-way analysis of variance (for P< 0.05, variances are significantly different for years of the study)
Table 5: Analysis of correlation between score on pharmacology exam and criteria used for selection of candi-dates for Pharmacy
Admission Exam Pharmacology Exam
2009 2010 2011 2012 2013 2014
Total scoring 0.286* 0.182 0.066 0.205 0.401* 0.195*
Biology 0.175 0.009 -0.067 0.112 0.258* 0.242*
Chemistry 0.234* 0.247* 0.129 0.038 0.345* 0.105
Mathematics --- --- --- --- --- 0.137
higher compared to the remaining years of the study)
and the mean item easiness was over 0.59 (no significant
differences). Discriminatory capacity may be increased by a detailed analysis of particular questions comprising the pool of exam questions. This kind of assessment provides very useful information on an exam group and it also constitutes a foundation for evaluation and devel-opment of a high-quality database of exam questions.
Questions with optimum easiness and sufficient differ -entiation parameters have a major impact on test sensi-tivity and they should constitute the core of the pool of exam questions and this is what should be pursued in the next years. The development of a proper database of exam questions is a long-lasting process and database resources need to be successively updated due to the process of “ageing” of exam questions. This process consists in an increase of easiness and decrease of dif-ferentiation power in the subsequent editions compris-ing the database.29
Since multistage MCQ exams are not standardized and normalized, the problem of reliability and comparabil-ity of students’ grades in the subsequent years arises. The requirement of objectivity in assessment of stu-dents’ achievements forces us to ask a question whether the system of converting scores into grades in the sub-sequent exam editions ensures a fair and comparable assessment of the same competences. Grades for the Pharmacology course are assigned exclusively on the
basis of the results of the final exam (the so called sum
-mative assessment). According to the classification by
Susan Brookhart,30 it can be assumed that it is meet-ing exam requirements (“outcome-based assessment”) and not taking into consideration the effort made by students during the course (“effort-based assessment”) that constitutes the only measurement of the outcomes of education in pharmacology. The above measure-ment is compliant with the idea of analytical assessmeasure-ment that is a three-stage process, comprising the following: determination of curricular requirements (stated in the standards of education), determination of standards of requirements (concluding based on the measurement results, e.g. using a test), and development of a student achievement scale (operationalization of a grading scale using requirements and standards). The performance standards are applicable in the case of the pharmacology exam, since no standardization of a test was performed with a selected sample in order to establish an empirical standard. With reference to this particular MCQ exam, from the practical point of view, it is most important to determine a quantitative standard, i.e. the smallest
num-ber of points obtained on the exam that confirms that
a student met the requirements of a particular level.31 However, the a priori quantitative standard for
phar-macology exams underwent a posteriori revision after receiving the test results. The analysis of the required score thresholds for MCQ exams demonstrated that the “passed/failed” cut-off point was always at the same level. With reference to the remaining score thresholds for the school grading scale (3, 3.5, 4, and 4.5), it was
found that in the case of the most difficult exam from
those studied here (the 2013 year), score requirements
for particular grades were significantly lower compared
to the MCQ exams in the remaining years. The dif-ferences were particularly visible for grades over 3. It needs to be emphasised that both the variability
coef-ficient and interquartile range for the 2013 exam was not significantly different from those established for the
remaining exams. A small number of persons with the
“very good” grade were also an important finding with
reference to the analysis of scores required for particu-lar grades.
The determination of measurement validity that answers the question: “what is measured?” is also essential for
the development of quality of assessment tools. Validity
should be here understood as the degree of consistency to which a measurement tool measures what it is sup-posed to measure. Therefore, it is the usefulness of a particular test for assessment of a certain set of features and qualities of a candidate.32 If a selected method de facto checks the ability of a candidate to adjust to an assessment tool (literally “What Do They Want Me To Say?”), then the assessment is not focused on features we would like to evaluate.33 There is no precise method to measure validity, only its indirect evaluation is pos-sible and it usually consists in using one out of three ideas used for establishing measurement validity: con-tent,34 empirical,35 and construct validity.36,22 analysed the validity of PCAT and showed that a number of assess-ment strategies can be used: content, internal structure, concurrent, and predictive validity. One important type of validity is content validity - the degree of correspon-dence between the contents of the test and the logical and curricular domains intended to be measured.22 In the case of the pharmacology exam, the consistency of the contents of exam questions and standards of educa-tion for this particular course are important with
refer-ence to curricular validity. Validation of this parameter
subtests. The analysis of validity with the use of the correlation between the scores obtained on one exam and the scores obtained by the same students on a dif-ferent test is referred to as concurrent validity.13,15,16 Still, the predictive validity refers to the assessment of the prognostic capacity of exam scores to predict future careers of candidates, e.g. achievement of professional success during the university education or the future professional status of a graduate.4-7,9,13, 16,37-41 Due to the obvious reasons, the term “concurrent and predic-tive validity” is impossible in the case of pharmacol-ogy exams. There are no results of a simultaneously conducted assessment and there are no data on future careers of students13 and graduates16 with reference to their professional activity after graduation from phar-macy school.
The analysis of correlations between the results of the pharmacology exam and admission exam showed no systematically occurring correlations between those variables. It is symptomatic that only the 2013 exam
results were significantly correlated with the two selec -tion criteria used in the admission process for Phar-macy (Pearson’s r for biology and chemistry amounted to 0.258 and 0.345, respectively). With reference to the analysis of score requirements for particular grades, the 2013 exam was the only one that differed from the established score thresholds. This exam was also most
difficult (index of test difficulty of 0.59 and average
discriminating power of 0.234). Considering the above
findings, the outcomes of the 2013 exam should provide
the basis for future efforts to improve the Pharmacol-ogy exam. Assuming that the matura exam in chem-istry and biology at the extended level is standardized and normalized by the Central Examinations Board, which supervises the national exam, the results of the admission exam should be treated as a very important predictor.42 The literature shows that good results of predictive analyses may be achieved for the output variable, namely for the academic performance in the
first-year of pharmacy school.4,5 Therefore, prospective studies on developing multiple regression model for making predictions should be based on several factors, including also the results of the pharmacology exam.
CONCLUSION
Conclusion states that the above findings concern -ing the reliability, sensitivity, objectivity and validity of the Pharmacology Exams conducted at the Faculty of Pharmacy, MUW demonstrated that, with all method-ological limitations of retrospective studies, the scores of these exams might constitute a good output variable for a predictive assessment. However, continuous
evalu-ation and improvement of the exam test are necessary, particularly with reference to the assessment of mea-surement validity. Moreover, data on future careers of students and graduates should be consistently collected for the needs of a predictive analysis conducted with the use of a regression model including various explanatory variables.
ACKNOWLEDGMENTS
Acknowledgements for Henryk Rebandel, PhD, long-term chairperson of the Medical University of Warsaw Admission Board, for help in preparation of data for analysis.
COMPETING INTERESTS
The authors declare that they have no competing inter-ests.
STUDY FUNDING
This work was supported by the Medical University of
Warsaw under number NZD/PM41/14 (Young Inves -tigator Grant).
REFERENCES
1. Janczukowicz J. Medical education in Poland. Med Teach. 2013; 35(7): 537-43. 2. Bartkowiak LE. Professional views of pharmacy faculty graduates.
Wiadomosci lekarskie 2006; 59(5-6): 303-10.
3. Wolkowitz AA. Multiple attempts on a nursing admissions examination: Effects on the total score. Journal of Nursing Education 2011; 50(9): 493-501. 4. Meagher DG, Lin A, Stellato CP. A predictive validity study of the Pharmacy
College Admission Test. Am J Pharm Educ. 2006; 70(3): 53.
5. Meagher DG, Lin A, Perez CD. Predicting pharmacy students’ performance from PCAT scores: a further analysis of predictive validity study data. Am J Pharm Educ. 2007; 71(5): 101.
6. Kuncel NR, Crede M, Thomas LL, Klieger DM, Seiler SN, Woo SE. A meta-analysis of the validity of the Pharmacy College Admission Test (PCAT) and grade predictors of pharmacy student performance. Am J Pharm Educ. 2005; 69(3): 339-47.
7. Kidd RS, Latif DA. Traditional and novel predictors of classroom and clerkship success of pharmacy students. Am J Pharm Educ. 2003; 67(4): 109.
8. Houglum JE, Aparasu RR, Delfinis TM. Predictors of academic success and
failure in a pharmacy professional program. Am J Pharm Educ. 2005; 69(3): 43.
9. Meagher DG, Pan T, Perez CD. Predicting performance in the first-year of
pharmacy school. Am J Pharm Educ. 2011; 75(5): 81.
10. Renzi SE, Krzeminski MA, Sauberan MM, Brazeau DA, Brazeau GA. Prepharmacy years in college and academic performance in a professional program. Am J Pharm Educ. 2007; 71(4): 69.
11. Hardinger KL, Schauner S, Graham M, Garavalia L. Admission predictors of academic dismissal for provisional and traditionally admitted students. Currents in Pharmacy Teaching and Learning 2013; 5(1): 33-8.
12. Myers TL, DeHart RM, Vuk J, Zoran B. Prior degree status of student
pharmacists: Is there an association with first-year pharmacy school
academic performance? Currents in Pharmacy Teaching and Learning 2013; 5(5): 490-3.
14. Cameron AJ, Mackeigan LD. Development and pilot testing of a multiple mini-interview for admission to a pharmacy degree program. Am J Pharm Educ. 2012; 76(1): 10.
15. Cox WC, Persky A, Blalock SJ. Correlation of the Health Sciences Reasoning Test with student admission variables. Am J Pharm Educ. 2013; 77(6): 118. 16. McCall KL, MacLaughlin EJ, Fike DS, Ruiz B. Preadmission predictors of
PharmD graduates’ performance on the NAPLEX. Am J Pharm Educ. 2007; 71(1): 5.
17. Atkinson J, Rombaut B. The PHARMINE study on the impact of the European Union directive on sectoral professions and of the Bologna declaration on pharmacy education in Europe. Pharmacy practice 2011; 9(4): 188-94. 18. Wilson S, Tordoff A, Beckett G. Pharmacy professionalism: A systematic
analysis of contemporary literature (1998-2009). Pharmacy Education 2010; 10(1): 27-31.
19. Feldt LS. A test of hypothesis that Cronbachs alpha or Kuder-Richardson
coefficent 20 is same for 2 tests. Psychometrika. 1969; 34(3): 363-73.
20. Guttman L. A basis for analyzing test-retest reliability. Psychometrika 1945; 10(4): 255-82.
21. Cohen J. Statistical power analysis for the behavioral sciences. 2nd ed. Hillsdale, NJ: Lawrence Erlbaum Associates; 1988.
22. Meagher DG, Pan T, Wegner R, Olson AT, Overgaard SL, Mehle JJ. PCAT
Reliability and Validity. 3rd ed. San Antonio: Pearson Executive Office; 2012.
23. Streiner DL. Starting at the beginning: an introduction to coefficient alpha and
internal consistency. Journal of personality assessment 2003; 80(1): 99-103. 24. Guilford JP. Psychometric methods. 2nd ed. New York: McGraw-Hill; 1954. 25. Kolen MJ, Hanson BA, Brennan RL. Conditional Standard Errors of
Measurement for Scale Scores. Journal of Educational Measurement 1992; 29(4): 285-307.
26. Baker FB. Computer technology in test construction and processing. In: Linn RL, editor. Educational Measurement. 3rd ed. New York: ACE; 1989.
27. Downing SM. The effects of violating standard item writing principles on tests
and students: the consequences of using flawed test items on achievement
examinations in medical education. Advances in health sciences education : theory and practice 2005; 10(2): 133-43.
28. Boland RJ, Lester NA, Williams E. Writing Multiple-Choice Questions. Academic Psychiatry 2010; 34(4): 310-6.
29. Case SM, Swanson DB. Constructing Written Test Questions For the Basic and Clinical Sciences. 3rd ed: National Board of Medical Examiners; 2002. 30. Brookhart SM. Teachers’ grading practices: Meaning and values. Journal of
Educational Measurement. 1993; 30(2): 123-42.
31. Ben-David MF. AMEE Guide No. 18: Standard setting in student assessment. Medical Teacher 2000; 22(2): 120-30.
32. Goodwin LD. Changing conceptions of measurement validity: an update on the new standards. The Journal of nursing education 2002; 41(3): 100-6. 33. White J, Brownell K, Lemay JF, Lockyer JM. “What do they want me to say?”
The hidden curriculum at work in the medical school selection process: a qualitative study. BMC Medical Education 2012; 12(1):17.
34. Ebel RL. Must all tests be valid? American Psychologist 1961; 16(10): 640. 35. Reezigt GJ, Guldemond H, Creemers BP. Empirical validity for a
comprehensive model on educational effectiveness. School effectiveness and school improvement. 1999; 10(2): 193-216.
36. Cronbach LJ, Meehl PE. Construct validity in psychological tests. Psychological bulletin 1955; 52(4): 281.
37. Kuncel NR, Hezlett SA. Assessment. Standardized tests predict graduate students’ success. Science 2007; 315(5815): 1080-1.
38. Hardigan PC, Lai LL, Arneson D, Robeson A. Significance of academic merit,
test scores, interviews and the admissions process: A case study. AAm J Pharm Educ. 2001; 65(1): 40-4.
39. Lobb WB, Wilkin NE, McCaffrey DJ, Wilson MC, Bentley JP. The predictive
utility of nontraditional test scores for first-year pharmacy student academic
performance. Am J Pharm Educ. 2006; 70(6): 128.
40. Cunny KA, Perri M. Historical-perspective on undergraduate pharmacy student admissions - the PCAT. AAm J Pharm Educ. 1990; 54(1): 1-6. 41. Thomas MC, Draugalis JR. Utility of the Pharmacy College Admission Test
(PCAT): Implications for Admissions Committees. Am J Pharm Educ. 2002; 66(1): 47-51.