R. Aruna Kirithika et al, International Journal of Computer Science and Mobile Applications, Vol.2 Issue. 4, April- 2014, pg. 14-22 ISSN: 2321-8363
©2014, IJCSMA All Rights Reserved, www.ijcsma.com 14
Estimation of Clustering Algorithms in
Logistics Database of an Online Trade Centre
R. Aruna Kirithika
1,
K. Padmavathi
2Assistant Professor, Department of Computer Applications, St. Joseph’s College, Cuddalore
E-Mail id: [email protected] 1, E-Mail id: [email protected] 2
Abstract
The logistics division in any trade organization is a typical task that involves a huge man power, time and needs more currency to be spent while ensuring safe delivery of the product involved. Any organization that does trade across the world is in need to maintain a huge database that has records of almost numerous numbers of attributes involved in it. Either a survey or a thorough study of the database will be a tremendous process. Here in this paper such a logistics division database is traced with the help of the clustering algorithm to show the performance of the clusters with the data given. The response and retrieval of data avoiding the noisy data from the database is a huge task. Such process is done with the help of clustering algorithms. Upon applying the database to various clustering algorithms certain results have been found and discussed. Three clustering algorithms have been chosen for analysis such as K-means, EM and Make density based algorithm are applied with the same database and a comparative results have been derived in this paper. The clustering algorithms used for the prediction of results are based upon the statistical calculation. All algorithms that are used in the field of Data Mining make use of the statistical equation to predict results out of the entire data warehouse for all bounded and arbitrary values.
Keywords: Clustering algorithms, Density based algorithm, logistics, EM
1. Introduction
As the world trade now-a-days has gone online, people purchasing goods from malls throughout the entire world has become a trivial phenomenon. When such trade is being done a database has to be maintained electronically to keep a trace out of those orders and logistics around the world. The maintenance of database and retrieval of data from those databases is a huge task. Avoiding noisy data and retrieval of data to accuracy is very difficult. In practice digitally there are many algorithms which do the above said job. Here we have taken three such algorithms K means, Make density based and EM algorithm. Mining the data and search results from huge data warehouses is the main process that is carried around the world in recent years [7].
Data mining, an interdisciplinary subfield of computer science, is the computational process of discovering patterns in large data sets involving methods at the intersection of artificial intelligence, machine learning, statistics, and database systems.[1] The overall goal of the data mining process is to extract information from a data set and transform it into an understandable structure for further use. Aside from the raw analysis step, it involves database and data management aspects, data pre-processing, model and inference considerations, interestingness metrics, complexity considerations, post-processing of discovered structures, visualization, and online updating . The process of data mining is carried away by some algorithms which includes clustering, classification, association rules etc. Data Mining does supervised and unsupervised learning.
R. Aruna Kirithika et al, International Journal of Computer Science and Mobile Applications, Vol.2 Issue. 4, April- 2014, pg. 14-22 ISSN: 2321-8363
©2014, IJCSMA All Rights Reserved, www.ijcsma.com 15
analyzes the data and produces an inferred function called a classifier [2]. A classifier always gives a resultant dataset even from an unseen situation in a reasonable way. The parallel task carried out in the human and animal psychology is referred as concept learning. Classification is a data mining technique used to predict group membership for data instances. It is one of the techniques in supervised learning.
Unsupervised learning is a class of problem in machine learning where the goal is to determine how data is organized. Unsupervised learning is closely related to problems of density estimation in statistics. Unsupervised learning encompasses many techniques that seek to summarize and explain key features of the data. One such learning is clustering. Feature selection from the data
Helps improve the performance of the learning models. Feature selection algorithm is done under two categories: feature ranking and subset selection. Feature ranking ranks the features by a metric and eliminates all features that do not achieve an adequate score [12]. Subset selection searches the set of possible features for the optimal subset.
Here the clustering algorithms are deployed for the database of a trade mall. The algorithms infers results and a graph is shown to highlight the deviation of the same database among the three algorithms (k-means, make density based and EM) [20].Thus the performance of the algorithms are inferred and the status are registered for the same.
2. Evaluation Steps
The evaluation Steps are as follows:
2.1. Data Set Collection
2.2. Data Preprocessing
2.3. Clustering
2.4. Experimental results.
2.1. Data Set Collection:
R. Aruna Kirithika et al, International Journal of Computer Science and Mobile Applications, Vol.2 Issue. 4, April- 2014, pg. 14-22 ISSN: 2321-8363
©2014, IJCSMA All Rights Reserved, www.ijcsma.com 16 Figure 1. Logistics dataset
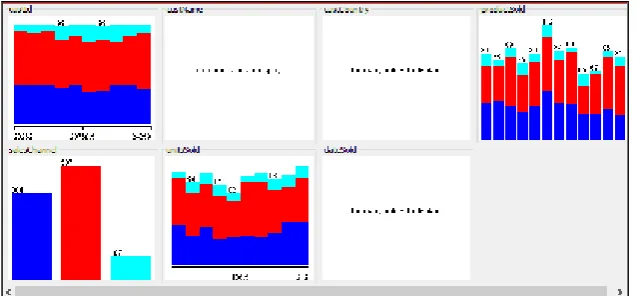
The following graph shows the visualization of each attribute
.
Figure 2. Visualization of Attributes
2.2. Data pre-processing
Any irrelevant and redundant information or noisy and unreliable data is found the knowledge discovery during the training phase of the database, the sophisticated users becomes more difficult. Data preparation and filtering steps can take considerable amount of processing time. Data pre-processing includes cleaning, normalization, transformation, feature extraction and selection etc.[3]
Data preprocessing algorithms include data Cleaning, Data Transformation, Data Reduction, Data Integration and Normalization. The Data Cleaning is the process of removing noisy or irrelevant, inconsistent and redundant data. The Data Transformation technique deals with conversion of the required data in required format during the process of data mining.[5]
R. Aruna Kirithika et al, International Journal of Computer Science and Mobile Applications, Vol.2 Issue. 4, April- 2014, pg. 14-22 ISSN: 2321-8363
©2014, IJCSMA All Rights Reserved, www.ijcsma.com 17 2.3. Clustering
The Clustering is the process of grouping the similar data items. It is the unsupervised learning techniques, in which the class label will not be provided. The clustering methods are partitioned clustering, hierarchical methods, Density based Clustering and Sub space clustering [17].
2.3.1. K-means clustering
K-means is one of the simplest unsupervised learning algorithms that solve the well known clustering problem. The procedure follows a simple and easy way to classify a given data set through a certain number of clusters (assume k clusters) fixed a priori. The main idea is to define k centroids, one for each cluster.[19] These centroids should be placed in a cunning way because of different location causes different result. So, the better choice is to place them as much as possible far away from each other. The next step is to take each point belonging to a given data set and associate it to the nearest centroid. When no point is pending, the first step is completed and an early group age is done. At this point we need to re-calculate k new centroids as bar centers of the clusters resulting from the previous step. After we have these k new centroids, a new binding has to be done between the same data set points and the nearest new centroid. A loop has been generated. As a result of this loop we may notice that the k centroids change their location step by step until no more changes are done.
In other words centroids do not move any more.
Finally, this algorithm aims at minimizing an objective function, in this case a squared error function. The objective function
(1)
Where is a chosen distance measure between a data point and the cluster centre , is
an indicator of the distance of the n data points from their respective cluster centers [15].
2.3.2. EM
An expectation–maximization (EM) algorithm is an iterative method for finding maximum likelihood or maximum aposteriori (MAP) estimates of parameters in statistical models, where the model depends on unobserved latent variables [10]. The EM iteration alternates between performing an expectation (E) step, which creates a function for the expectation of the log-likelihood evaluated using the current estimate for the parameters, and maximization (M) step, which computes parameters maximizing the expected log-likelihood found on the E step. These parameter-estimates are then used to determine the distribution of the latent variables in the next E step [11].
Given a statistical model consisting of a set
X
observed data, a set of unobserved latent data or missing valuesZ
, and a vector of unknown parameters𝝦
, along with a likelihood function the maximum likelihood estimate (MLE) of the unknown parameters isdetermined by the marginal likelihood of the observed data
R. Aruna Kirithika et al, International Journal of Computer Science and Mobile Applications, Vol.2 Issue. 4, April- 2014, pg. 14-22 ISSN: 2321-8363
©2014, IJCSMA All Rights Reserved, www.ijcsma.com 18
However, this quantity is often intractable (e.g. if
Z
is a sequence of events, so that the number of values grows exponentially with the sequence length, making the exact calculation of the sum extremely difficult).The EM algorithm seeks to find the MLE of the marginal likelihood by iteratively applying the following two steps:
2.3.2.1. Expectation step (E step): Calculate the expected value of the log likelihood function, with respect to
the conditional distribution of
Z
givenX
under the current estimate of the parameters𝝦
(t):(3)
2.3.2.2. Maximization step (M step): Find the parameter that maximizes this quantity:
(4)
2.3.3. Make Density based Algorithm
Density based clustering algorithm has played a vital role in finding non linear shapes structure based on the density. Density-Based Spatial Clustering of Applications with Noise (DBSCAN) is most widely used density based algorithm. It uses the concept of density reach ability and density connectivity [16].
2.3.3.1. Density Reachability - A point "p" is said to be density reachable from a point "q" if point "p" is within ε distance from point "q" and "q" has sufficient number of points in its neighbours which are within
distance ε [9].
2.3.3.2. Density Connectivity - A point "p" and "q" are said to be density connected if there exist a point "r" which has sufficient number of points in its neighbours and both the points "p" and "q" are within the ε distance. This is chaining process. So, if "q" is neighbour of "r", "r" is neighbour of "s", "s" is neighbour of "t" which in turn is neighbour of "p" implies that "q" is neighbour of "p"[8].
Algorithmic steps for DBSCAN clustering
Let X = {x1, x2, x3, ..., xn} be the set of data points. DBSCAN requires two parameters: ε (eps) and the
minimum number of points required to form a cluster (minPts).
i. Start with an arbitrary starting point that has not been visited.
ii. Extract the neighbourhood of this point using ε (All points which are within the ε distance are neighbourhood).
iii. If there are sufficient neighbourhoods around this point then clustering process starts and point is marked as visited else this point is labelled as noise (Later this point can become the part of the cluster).
iv. If a point is found to be a part of the cluster then its ε neighbourhood is also the part of the cluster and the above procedure from step 2 is repeated for all ε neighbourhood points. This is repeated until all points in the cluster are determined.
R. Aruna Kirithika et al, International Journal of Computer Science and Mobile Applications, Vol.2 Issue. 4, April- 2014, pg. 14-22 ISSN: 2321-8363
©2014, IJCSMA All Rights Reserved, www.ijcsma.com 19
vi. This process continues until all points are marked.
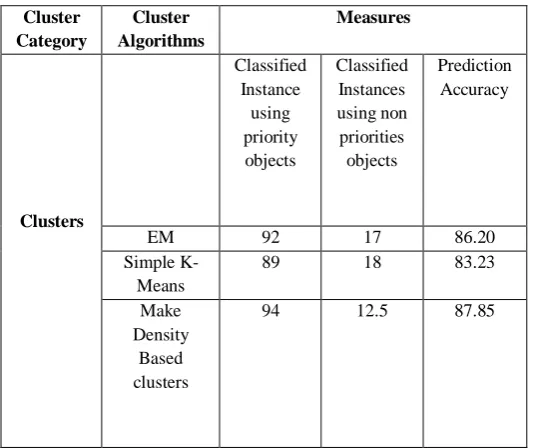
Table 1. Performance of Clustering Algorithms –Measures taken under priority based objects.
2.3.4.1. Performance Evaluation
The performance of clustering algorithm is shown in the above table under the prioritized objects instances. The Make density based algorithm shows a higher degree of performance of 87.85%.The Expectation Maximization algorithm shows a performance of 86.20%
Figure 3. Evaluation Graph Cluster
Category
Cluster Algorithms
Measures
Clusters
Classified Instance
using priority objects
Classified Instances using non priorities objects
Prediction Accuracy
EM 92 17 86.20
Simple K-Means
89 18 83.23
Make Density
Based clusters
R. Aruna Kirithika et al, International Journal of Computer Science and Mobile Applications, Vol.2 Issue. 4, April- 2014, pg. 14-22 ISSN: 2321-8363
©2014, IJCSMA All Rights Reserved, www.ijcsma.com 20
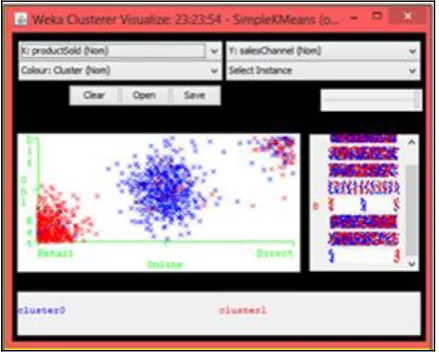
2.3.4.2. Visualization of Cluster Assignments
In Classes to clusters evaluation mode first ignores the class attribute and generates the clustering. Then during the test phase it assigns classes to the clusters, based on the majority value of the class attribute within each cluster. Then it computes the classification error, based on this assignment and also shows the corresponding confusion matrix. It can show how these errors are related to the different attributes. This kind of information helps when trying to decide what do to with the misclassified cases. It can be used to see if the misclassified cases had something in common, or if they were particularly concentrated around certain values of an attribute [4].
Figure 4. Visualization of Simple K-means
R. Aruna Kirithika et al, International Journal of Computer Science and Mobile Applications, Vol.2 Issue. 4, April- 2014, pg. 14-22 ISSN: 2321-8363
©2014, IJCSMA All Rights Reserved, www.ijcsma.com 21
Figure 6. Visualization of Make DensityBased
4. Conclusions
The on line trade mall dataset that is applied for clustering of the results under certain bounded and arbitary attributes to three clustering algorithms predicts that the make density algorithm gives a perfect clustering of attributes compared with simple k means and Expectation Maximum algorithms. The distribution of the attributes under the cluster show the performance of each algorithm that can be visualized in the experimental results. The same performance can be extended with Medical databases, biological databases, databases of various companies, institution etc., and the results can be analysed.
References
[1] Varun Kumar, Nisha Rathee,”Knowledge Discovery from Database using an Integration of clustering and
Classification”, IJACSA, vol 2 No.3, pp. 29-33, March 2011.
[2] N.A.Setiawan, A.F.M.Hani,”Missing Attribute Value Prediction Based on Artificial Neural Network and Rough Set
Theory”, IEEE, Vol 1, pp.306-310, 2008.
[3] Weka – Data Mining Machine Learning Software, http://www.cs.waikato.ac.nz/ml/.
[4] Witten, I.H., Frank E.: Data Mining: Practical Machine Learning Tools and Techniques, 2nd edn. Morgan Kaufmann,
San Francisco (2005).
[5] Ian H.Witten, et al, “Weka: Practical Machine Learning Tools and Techniques with Java implementations,” Working
Paper 99/11, Department of Computer Science, The University of Waikato, Hamilton, 1999.
[6] P. T. et al. Introduction to Data Mining. Addison Wesley, 2005.
[7] Hartigan, J.A., Clustering Algorithms (Probability & Mathematical Statistics). John Wiley & Sons Inc, 1975.
[8] Pazzani, M.J., and Billsus, D., Learning and revising user profiles: The identification of interesting web sites. Machine
Learning, 27(3):313–331, 1997.
[9] Li, B., K.Q., Clustering approach for hybrid recommender system. In Web Intelligence 03, 2003.
[10] C. C. Aggarwal, J. Han, J. Wang, and P. S. Yu.A framework for clustering evolving data streams. In Proc. of VLDB,
2003.
[11] C. C. Aggarwal, J. Han, J. Wang, and P. S. Yu. A framework for projected clustering of high dimensional data
streams. In Proc. of VLDB, 2004.
[12] M. Ankerst, M. Breunig, H.-P. Kriegel and J. Sander. Optics: Ordering points to identify the clustering structure. In
Proc. of SIGMOD, pages 49–60, 1999.
[13] M. Charikar, L. O’Callaghan, and R. Panigrahy. Better streaming algorithms for clustering problems. In Proc.of
R. Aruna Kirithika et al, International Journal of Computer Science and Mobile Applications, Vol.2 Issue. 4, April- 2014, pg. 14-22 ISSN: 2321-8363
©2014, IJCSMA All Rights Reserved, www.ijcsma.com 22 [14] B. Dai, J. Huang, M. Yeh, and M. Chen. Clustering on demand for multiple data streams. In Proc. of ICDM, pages 367–370, 2004.
[15] P. Domingos and G. Hulten. Mining high-speed data streams. In Proc. of KDD, 2000.
[16] P. Domingos and G. Hulton. A general method for scaling up machine learning algorithms and its application to
clustering. In Proc. of the 18th International Conference on Machine Learning (ICML 2001), pages 106–113, 2001.
[17] M. Ester, H.-P. Kriegel, J. Sander, and X. Xu. A density-based algorithm for discovering clusters in large spatial
databases with noise. In Proc. of KDD, 1996.
[19] M. Ester, H.-P. Kriegel, J. Sander, and X. Xu. Incremental clustering for mining in a data warehousing environment. In Proc. of VLDB, pages 323–333, 1998.
[20] S. Guha, A. Meyerson, N. Mishra, R. Motwani, and
L.O’Callaghan. Clustering data streams: theory and practice. In IEEE Transactions on Knowledge and Data Engineering,