ISSN: 2306-9007 Hsieh (2017) 289
I
www.irmbrjournal.com March 2017I
nternationalR
eview ofM
anagement andB
usinessR
esearchVol. 6 Issue.1
R
M
B
R
Does User Orientation Matter? The Development of Social
Networking Sites Implementation Matrix – User Perspectives
MIN-DER HSIEH
Department of International Business, National Taiwan University No.1, Sec.4, Roosevelt Road., Taipei, 10617,Taiwan (R.O.C.)
E-mail: [email protected]; [email protected]
Tel: +886-958-967671
Abstract
This study goes one step further to clarify the relationships of Social Networking Sites (SNSs) to satisfaction and royalty. The study findings recognize a total of five Critical Success Factors (CSF) of Social Networking Sites (SNSs) for enterprises implementing Social Networking Sites (SNSs). They are satisfaction of customer requirements, identification of customer differentiation, quality interface design, establishment of customer recognition and provision of customized services. Among these factors, satisfaction of customer requirements and identification of customer differentiation are significantly related to user satisfaction and royalty. Quality interface design and establishment of customer recognition have significant relationships with satisfaction; and provision of customized services and royalty are significantly related. Finally, this study also develops a Social Networking Sites (SNSs) Implementation Matrix on the basis of different levels (high/low) of satisfaction and royalty. Focusing on high satisfaction and royalty, the success rate can be increased by the establishment of customer recognition; at low level of satisfaction and high level of royalty, satisfaction of customer requirements can promote a higher success rate; at low satisfaction and royalty, the establishment of customer recognition and provision of customized services can promote a higher success rate; and within the quadrant of high satisfaction and low royalty, a higher success rate can be enhanced by utilizing identification of customer differentiation and quality interface design.
Key Words: Social Networking Sites (SNSs); User Perspectives; Satisfaction; Royalty; Social Networking Sites (SNSs) Implementation Matrix.
Introduction
ISSN: 2306-9007 Hsieh (2017) 290
I
www.irmbrjournal.com March 2017I
nternationalR
eview ofM
anagement andB
usinessR
esearchVol. 6 Issue.1
R
M
B
R
There exists little research investigating the significant relationships between SNSs and user satisfaction, and the same for royalty. The result is that websites provide little understanding relating to how SNSs can be implemented, in order to increase user satisfaction and royalty. Consequently, this study combined qualitative and quantitative research approaches to, first, conduct focus group interviews with 38 Internet users. After that, the quantitative research method was used to investigate, in particular, the relationships between SNSs and satisfaction/ royalty. In turn, the implementation matrix of SNSs was developed and discussion on the research results was carried out in interviews with business professionals in practice. Finally, relevant actions were proposed to assist businesses in proceeding with plans for SNSs projects.
Literature Review
Definition of Social Networking Sites (SNSs)
To recognize how Social Networking Sites(SNSs) features and their impacts in engaging consumers, it is important to close the research gap (Chun & Lee,2016). SNSs have gained much popularity and subsequently as interactive communication tools (Boyd & Ellison, 2007). The primary concept underlying SNSs is the emphasis on differentiation of service in light of the varying needs of customers.
The user orientation system of SNSs was provided in divergent online services that SNSs are intended for building and keeping social networks (Rau et al., 2008). Using this approach, business providers are able to identify target groups through the use of intelligence databases and the interpersonal interconnectivity.
Concerning the types of Social Networking Sites(SNSs) services, after summarizing the concepts proposed by Weber, Fulk, and Monge (2016). SNSs as a debate refers to digital media that allow people interaction in the online services. In general, SNSs have different form such as Facebook focus on users to create directories of their social networks and to interactive on peer-to-peer, whereas the social media encompasses blogs (e.g., Twitter.com), photo sharing (e.g., Flickr.com), and music (e.g., Spotify), among others. The SNSs can be closely organized and extended from interpersonal level to organizational level.
Some literature offers that most companies do not only basically use SNSs (e.g., companies' Facebook pages) to carry information associated to their businesses directly, but also to link with their customers (Zhang, Benyoucef, & Zhao, 2015; Chun & Lee, 2016). Studies of SNSs often provide the potential benefits of SNSs for attractive and relating with their publics/consumers (e.g. Fletcer & Lee, 2012), but very few studies exist with regard to tangible effects of SNSs in the context of business management(e.g. Sung & Kim, 2014; Sung & Lee, 2015; Men &Tsai, 2015). With respect to SNSs research, this situation presents the main question, ―What CSFs influence people to accept, follow, and promote a company's SNS?
Critical Success Factors of SNSs
ISSN: 2306-9007 Hsieh (2017) 291
I
www.irmbrjournal.com March 2017I
nternationalR
eview ofM
anagement andB
usinessR
esearchVol. 6 Issue.1
R
M
B
R
satisfy each customer’s different and potential requirements --including the providing of personalized product information, the providing of customized service to save time for customers, and recommendations of customized products to individual customers.
Based on the abovementioned literature, this study compiles relevant studies (Allen et al., 2001; Clow and
Cole, 2004; DeLone and McLean, 2003; Flor and Maglio, 2004; Jarach, 2002; Jelassi and Leenen, 2003; Jun and Cai, 2001; Liu and Arnett, 2000; Menon and Kahn, 2002; Peppers and Rogers, 2000; Peppers et al., 1999; Teo and Yeong , 2003; Wells and Hess, 2002; Wixom and Watson, 2001) to develop the preliminary assessment framework and scale of SNSs CSF. The majority of the abovementioned research begins from the perspective of enterprises, but the subjects of this study are users-oriented. Therefore, this study again summarizes the measurement items for SNSs CSF under users views produced through the focus group interviews carried out with users and uses these items as the basis for developing quantitative questionnaire.
User Satisfaction
The so-called satisfaction refers to the level of satisfaction a customer has for that particular service (Oliver, 1999; Khalifa and Liu, 2003), that is, when the feeling of a customer about a product or service surpasses his/her expectation, they will feel satisfied. If the feeling does not match the level previously expected, then the customer will form an unsatisfied attitude (Shankar et al., 2003). Szymanski and Hise (2000) pointed out that user satisfaction can be measured by convenience, merchandising, website design and financial security. After completing the literature review, this study integrated relevant research contents and constructs (Owen, 2004; DeLone and McLean, 2003; Cho and Park, 2001), coupled with the information gathered from the focus group interviews. Related constructs were then deleted or modified for the purpose of developing the measurement items for user satisfaction towards SNSs. Some studies used theory lens of the self-regulation framework to investigate the antecedents and the effects of satisfaction, others use the relationship marketing theory to investigate the effects of a set of operator-side factors on the cultivation of user satisfaction (Lin et al. 2014; Gu et al. 2016).
User Royalty
We have observed the growing of hundreds of social networking sites (SNSs) worldwide in recent years. Every day billions of people join in these relationship-development-oriented Internet platforms. The total Number of social media users worldwide from 2010 to 2020 was 1.91 billion in 2014, and the number will increase to 2.67 billion in 2018 (Statista 2016). The so-called customer royalty indicates that the customers do not leave that particular website because there are other better choices (Dick and Basu, 1994). To establish royalty in the Internet world, Hagel and Armstrong (1997) suggested development of a one-to-one relationship between the company and customer. Srinivasan et al.(2002) proved that the customized services of the website stimulate users to revisit that website and the better the website can increase the level of service customization, the higher the customer royalty (Grewal et al., 2003). As Frantz, and McDougall’s (2004) research that (1) it did not cost less to serve loyal customers, (2) loyal customers do not pay higher prices for bundles of goods (in fact, the loyal customers consistently paid lower prices than newer customers), and (3) loyal customers who had both behavioral and attitudinal loyalty (as opposed to behavioral loyalty only), were word-of-mouth marketers for the firm.
ISSN: 2306-9007 Hsieh (2017) 292
I
www.irmbrjournal.com March 2017I
nternationalR
eview ofM
anagement andB
usinessR
esearchVol. 6 Issue.1
R
M
B
R
al., 2002), and together with the focus group information, revisions/modifications were initiated to measure the website users’ royalty.
The SNSs be surrounded with by the increasing acceptance and the significant business potential, SNS operators are excited to attract and retain users in the hopes of keeping their toehold in such an powerfully competitive market. Users’ sustained use and loyalty is seemingly critical to the long-term benefit of SNS operators. The empirical findings in critical success factors of SNSs, we have clarified the significantly affect SNS users’ loyalty factors such as perceived usefulness (Kang et al. 2009), sense of belonging (Lin et al. 2014), and arousal (Wang et al. 2015).
Research Design
Bryman (1992) indicated that the enhancement of the reliability in research conclusions can be accomplished by integrating the separate data in qualitative and quantitative investigations for the purpose of verifying the other one. Therefore, this study combines both qualitative and quantitative measurement methods, known as the Triangulation method, to proceed with the exploration (Burgess, 1993).
Literature Review and Pilot Interview
This study first reviewed the literature to outline the possible items for measuring SNSs services, satisfaction and royalty. However, to avoid the omission of other possible items, this study focused on 38 users who engaged in SNSs and carried out focus group interviews. The length of each interview was limited to 30 minutes to an hour. Each was facilitated by an open-ended questionnaire. This study cooperated with Taiwan’s largest educational training center and filtered the interviewees for information on whether they have received the aforementioned six types of SNSs services where the Convenience Sampling method was used for sample selection.
After obtaining the willingness of interviewees to cooperate, this study divided the participants into groups. The number of interviewees in each group was limited to 6-7. After deducting those who were unable to make it to the interviews, the actual number of participants turned out to be 38. There were 26 males and 12 females whose ages fell between 19-35 years. The basis of grouping was to incorporate those users who have used the Internet for over four years, gotten online for more than six times weekly in average or surfed the Internet for over two hours each time as high Internet users. Other interviewees were grouped as low Internet users. The interviews were carried out in the conference room where there was no interference. The researchers first explained the research procedure to the participants, and constructed a relaxed interview atmosphere. Each interview lasted 100 minutes in average. This study carried out a total of six focus group interviews and after the interview, related courses and books were given as the rewards for participating in the interview. The questions asked in the interviews consisted of what functions SNSs should include, and involved the users’ understandings of SNSs, royalty and satisfaction and their own usage experiences.
ISSN: 2306-9007 Hsieh (2017) 293
I
www.irmbrjournal.com March 2017I
nternationalR
eview ofM
anagement andB
usinessR
esearchVol. 6 Issue.1
R
M
B
R
integrating the literature and arranging the in-depth interview data, this study arrived at 35 SNSs related questions. 13 questions related to satisfaction and 17 questions related to royalty. .
Questionnaire Design
The main body of the questionnaire contained three sections. Based on what was offered by scholars Tull and Hawkins(1990), the first section of a questionnaire was designed to be the simplest to answer. Accordingly, the first part of this study’s questionnaire concerned general information and covered questions about the information related to population statistical variables. With this approach, it was determined that interviewees would feel comfortable, which made it easier to proceed with questions in the following section. This section concerned the measurement related to the functions One-to-one Web-marketing should provide, and several open-ended questions were added to assist the researchers in identifying possibilities for question omission. The third section was the measurement of satisfaction and royalty.
In the questionnaire, five-point Likert scales were used to assess the attitude of the interviewees. In conducting the questionnaire investigation, it was unrealistic to hypothesize that all of the interviewees would respond to all questions. Therefore, ―Don’t know‖ was designed and assigned to each question as a selection choice for the interviewees; and, during the coding, the method proposed by Boyd et al. (1989) was adopted to treat ―Don’t know‖ as a separate category. This was to avoid the occurrence of a situation
whereby interviewees might not know the answer to some question or were notin a position to answer the
questions. In addition, this study designed a few reverse questions to enhance the accuracy of analysis results. After the questionnaire design was complete, the researchers asked six postgraduate students to exchange their opinions on the context, wording and page layout of the pre-test questionnaire and improvement was made to reduce the possibility of errors occurring during recording.
Pre-test
For the pre-test, one-to-one meetings were arranged with each of the participants to discuss all items in the questionnaire. The researchers invited two PhD students and four MA students, from the National Taiwan University, and four interviewees, from the earlier focus group interview stage, to read and fill out the questionnaire. Each of the discussions lasted from 30 minutes to one hour in duration. The pre-test results found that a few question items needed revision to ensure that the relevant questions were clearly conveyed, and those technical jargons that were not easily understood were also adjusted.
Sampling Design
The sample population of this study focuses on those users who have received SNSs services before. One hundred (100) copies of questionnaires were distributed in the National Taiwan University, 260 copies in Takming College, 108 copies in Yuan Ze University, 312 copies in Soochow University and 250 copies in Lunghwa University of Science and Technology and 270 in NOVA Information Concourse and the Sampling method adopted was Convenience Sampling method. In addition, this study gave away small gifts to increase the interviewees’ willingness to fill in the questionnaires.
ISSN: 2306-9007 Hsieh (2017) 294
I
www.irmbrjournal.com March 2017I
nternationalR
eview ofM
anagement andB
usinessR
esearchVol. 6 Issue.1
R
M
B
R
Reliability and Validity
Reliability
Reaves (1992) indicated that small-scale test-retest experiments can be used to verify the reliability of research tools. After preparing the final questionnaire, those people who had previously participated in the pilot interview, were again asked to fill out the questionnaires. Their answers were compared with their previous answers and it was discovered by this study that they were similar. In addition to this, in the data analysis (See Table 2), the range of the Cronbach Alpha values of all the factors were from 0.72 to 0.84, which demonstrated that the questionnaire has a high level of reliability (Nunnally, 1967).
Validity
The development of the research measurement tools was complete based on the literature review and the information gained through the interviews with the 38 professionals. Although the determination of this content validity is relatively subjective, the research tools can still be regarded to have a high level of content validity. Scholars Madu et al. (1996)indicated that the item-total correlation of each factor to the total serves as the measurement index of criterion validity. The item-total correlation value of each item in this study is above 0.6 (See Table 2), which reveals that the results of the measurement scales match with the criterion validity standard. Moreover, in order to prove the criterion validity of CSF measurement, a positive correlation between the CSF measurement results and consumer satisfaction and royalty must be shown. The data obtained from this study indicates that, of the five CSF, four have a significant relationship with satisfaction (See Table 3) and three have a significant relationship with royalty (See Table 4). This result demonstrates that the research tools have high criterion validity.
The factor analysis was utilized to measure and verify the construct validity of research tools and this is an approach that is used extensively by researchers (Churchill et al., 1974; Allison, 1978; Noerager, 1979). The Kaiser-Meyer-Olkin (KMO) index of this study is 0.906 and the Bartlett’s test is significant (Approx. Chi-Square =10035.21, Sig = 0.00), which demonstrates that the measurement results of this study have obvious construct validity.
Validating Interview
The researchers first sent the research results to ten business professionals engaged in SNSs and then conducted face-to-face or telephone interviews with them. The purpose was to discuss the research conclusions and understand whether this study was helpful to them in their execution of SNSs. Simultaneously they were also asked to explain the research conclusions and this in turn could help the researchers to clarify the research findings. The interviews with each of the interviewees lasted from 20 to 40 minutes.
Data Analysis
Data Collection and Analysis
ISSN: 2306-9007 Hsieh (2017) 295
I
www.irmbrjournal.com March 2017I
nternationalR
eview ofM
anagement andB
usinessR
esearchVol. 6 Issue.1
R
M
B
R
Table 1. Interviewee Profile.
Sex Education Level Average Time Service Best Able to Service Most Able to
Spent on Browsing Websites Daily
Increase Satisfaction Increase Royalty
M F
509 646
Elementary School or Lower Junior High School Senior High School (Vocational
College)
Undergraduate MA or Higher
2
4
141 956 52
Less Than 1 Hr.
1~3 Hrs
4~6 Hrs
7~9 Hrs
10~12 Hrs
More than 12 Hrs
153 666 240 59 16
21
SNSs advertising SNSs cross-selling/ upselling
SNSs information SNSs service SNSs community SNSs experience
8.4% 21.6%
19.0% 33.2% 6.6% 11.1%
SNSs advertising SNSs cross-selling/ upselling
SNSs information SNSs service SNSs community SNSs experience
5.2% 19.3%
17.1% 38.0% 7.9% 12.6%
The majority of the sampling undertaken in this study involved students; their educational level was mainly university undergraduate. This fact makes it possible that the study’s results are more applicable to student groupings. Further, the average time spent on browsing the websites by the sample was 1-3 hours, which occupied 58% of the total sample time. Concerning the services that can increase user satisfaction and royalty, this study found that the interviewees, one after another, chose SNSs service. In the next section of this study, the factor analysis is utilized to extract the CSF of SNSs; the analysis of the factors for user satisfaction and royalty is carried out for determining the influence factors that can effectively enhance user satisfaction royalty.
Factor Analysis
This study adopts the principal components factoring method to extract common factors. Common factors selected have an eigen-value greater than 1.0. The varimax solution is then adopted to perform an orthogonal rotation process. Each factor item with an item-total correlation of greater than 0.6, and with a factor loading above 0.6, was retained, after the factor analysis of raw data was carried out.
Table 2 displays the results of the study’s factor analysis. A total of five factors, with an accumulative total variance of 65.46 %, were selected. The first factor is satisfaction of customer requirements which explains 35.56% of the total variance; the second factor is identification of customer differentiation; the third factor is quality interface design; the fourth factor is establishment of customer recognition; and the fifth factor is provision of customized services.
Next, this study attempts to verify whether CSF will influence user satisfaction as well as royalty. This study considers the five success factors as independent variables and the measurements of satisfaction and royalty as dependent variables. The scores of factors are calculated and standardized to make the mean score 0 and the standardized deviation 1.
ISSN: 2306-9007 Hsieh (2017) 296
I
www.irmbrjournal.com March 2017I
nternationalR
eview ofM
anagement andB
usinessR
esearchVol. 6 Issue.1
R
M
B
R
Table 2. Extraction of Factors.
Factor Activities Factor
loading Eigen- value Alpha value Correcte d- Item-Total Correlat ion Cumulati ve percent
1.Satisfaction of Customer
Requirements
Provide services for satisfying
customer requirements in a timely manner.
Create a flawless transaction security mechanism.
Provide functions for addressing customer complaints.
Have mechanisms for guaranteeing information security. 0.77 0.76 0.75 0.69 0.64
8.691 0.84
0.65 0.70 0.68 0.64 0.65 35.56 2.Identification of Customer Differentiation
Provide services that are directed at customer differences.
Proactively analyze customer
information.
0.75
0.68 2.51 0.80
0.72
0.63 52.94
3.Quality Interface Design
Provide links to related websites.
Provide links to relevant
communities.
Provide user interfaces that meet needs.
0.75 0.64 0.62
1.62 0.72
0.62 0.70 0.66
57.71
4.Establishment
of Customer
Recognition
Allow customers to sense that they belong to the focus of the website. Enable the customers to realize that the website was designed for themselves.
0.81
0.80 1.42 0.80
0.77
0.77 61.90
5.Provision of
Customized Services
Recommend dedicated products
according to individual customer’s interests.
Provide dedicated personal website space.
Provide mechanisms for
enterprise-customer interaction (e.g. chat
room).
Provide gifts to induce customers to register proactively.
0.68 0.66 0.64 0.77
1.21 0.73
0.62 0.62 0.66 0.63
65.46
Relationships between each Factor and Satisfaction
In the aspect of satisfaction, four factors -- satisfaction of customer requirements, identification of customer differentiation, quality interface design, and establishment of customer recognition -- have significant differences below a 5% degree (See Table 3).
ISSN: 2306-9007 Hsieh (2017) 297
I
www.irmbrjournal.com March 2017I
nternationalR
eview ofM
anagement andB
usinessR
esearchVol. 6 Issue.1
R
M
B
R
15 gave the opinion that: ―SNSs should offer or reward services within a very short period of time… then our satisfaction can be increased.‖
Chun and Lee (2016) expressed that the identification of customers’ information is the foundation of SNSs. Interviewee 14 said: ―I am quite satisfied with one of the functions. The CIA web intelligence agent proactively sends me emails containing the keywords I have been set up with. He provides the service that targets customer differences.‖
According to Nisar and Whitehead (2016), the enhancement of the quality in interface design can increase user satisfaction. Pavlou (2003) also provides that ease to use is likely to influence consumer behavioral intentions. Interviewee 27 pointed out: ―I teach part time at a school. The course discussion forum I use now doesn’t have an artistic layout effect that is as good as the school’s, but the maintenance interface is much more convenient than the school’s. It makes it easier for students to carry out online discussions. I like this website very much.‖
On the other hand, DeLone and McLean (2003) indicated that when users establish a sense of recognition about the website, it often means that they are satisfied with the services provided by the website. Interviewee 37 also mentioned: ―I have joined an online community for graduate school exam preparation. I post a lot of articles there and have met several friends this way. Occasionally, some people would post a question to ask for my opinions and of course I would participate in this. I am very satisfied and I use it often.‖
Nevertheless, as for factor 5, provision of customized services, the result is not significant. This may be due to the situation that users have a comparatively low recognition regarding the provision of customized services. For example, interviewee 23 mentioned that: ―I often feel that a special recommendation is not really a special recommendation. So I feel that this is just acceptable. Besides, the computer just selects people of the same group and gives them the same things. This is not really customized.‖ This is as what Hung et al. (2016) suggested -- that the so-called SNSs aims to provide services according to one specific consumer, not merely a large quantity of customized services.
Table 3. A Comparison of Success Factors and Non-success Factors through Satisfaction
Satisfaction Lower
Half
Upper Half
Mean Difference
Significance Level
1.Satisfaction of Customer Requirements 3.98 4.32 0.34 0.00**
2.Identification of Customer Differentiation 4.14 4.22 0.07 0.05*
3.Quality Interface Design 4.12 4.23 0.11 0.04*
4.Establishment of Customer Recognition 4.10 4.24 0.14 0.04*
5.Provision of Customized Services 4.16 4.19 0.02 0.14
Relationships between each Factor and Royalty
In determining the influence of SNSs CSF on user royalty, this study finds that three of the five factors -- satisfaction of customer requirements, identification of customer differentiation and provision of customized services -- have significant differences (See Table 4).
ISSN: 2306-9007 Hsieh (2017) 298
I
www.irmbrjournal.com March 2017I
nternationalR
eview ofM
anagement andB
usinessR
esearchVol. 6 Issue.1
R
M
B
R
The better a website can identify user information, the higher it can satisfy user expectations. The user royalty related to the website will also be higher (Dekimpe el al., 1997). Interviewee 23 also stated: ―I am used to buying the books published by Commonwealth Publishing Group at its website, although the books are not necessarily cheaper there. I will be informed proactively of my bonus award points, and I will receive emails informing me that books I want to read have been published. So I mostly buy Commonwealth Publishing Group’s books online.‖
Moreover, Grewal et al (2003) stated that the provision of customized services is the most effective way to increase a user royalty. Interviewee 23 pointed out: ― I can discuss my questions with the teachers (from the educational training center) on the community message board, and the teachers reply to my questions quickly. I think this kind of interaction is a leading factor for achieving excellent learning. This is also the reason for me to continue using it.‖
Nevertheless, factor 3, quality interface design and factor 4, establishment of customer recognition, appear insignificant. Srinivasan et al. (2002) also reported that since the websites are replaceable, one for another, the royalty cannot be increased if the services meeting customers’ requirements are not provided. Perhaps this is the reason for such insignificance. For example, Interviewee 34 mentioned: ―Yahoo has a very good interface design. PChome’s is also good. However, they almost the same. It doesn’t matter which one I use.‖
The possible reasons for the insignificance of factor 4 -- establishment of customer recognition -- lie in the extremely high number of substitutions available for websites, together with the large number of changes in user requirements. Therefore, even if the sense of recognition is very high, it is uncommon for customers to repeat their use when the websites cannot satisfy customer requirements. That is, it will not lead to a high royalty. Interviewee 10 pointed out: ―Taking my own web community as an example, I have a sense of recognition when using Yahoo, but the features provided by Yahoo are not as good as those of Taconet. That’s why I move my community to Taconet.‖ This is perhaps the possible reason for insignificant establishment of customer recognition.
In addition, this study summaries four reasons that may have caused the above factors to have insignificant relationships with satisfaction and royalty. First, the importance of these factors to the success of SNSs may be comparatively low. Second, they may be less important when compared with other factors. Third, it may be possible that the related questions used to describe these factors are not refined enough. If this is true, it is impossible to investigate into these factors in depth, resulting in the impossibility to demonstrate the roles they play in the implementation of SNSs. Fourth, the existence of research errors makes it impossible to show their significance.
Table 4. A Comparison of Success Factors and Non-success Factors through Royalty.
Royalty Lower
Half
Upper Half
Mean Difference
Significance Level
1.Satisfaction of customer requirements 3.48 3.57 0.06 0.02*
2.Identification of customer differentiation 3.41 3.53 0.13 0.03*
3.Quality interface design 3.43 3.51 0.06 0.09
4.Establishment of customer recognition 3.40 3.52 0.12 0.14
5.Provision of customized service 3.44 3.50 0.06 0.05*
* Significant at the 95% level ** Significant at the 99% level
ISSN: 2306-9007 Hsieh (2017) 299
I
www.irmbrjournal.com March 2017I
nternationalR
eview ofM
anagement andB
usinessR
esearchVol. 6 Issue.1
R
M
B
R
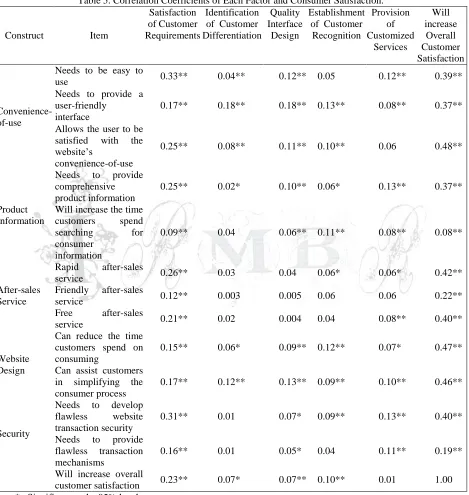
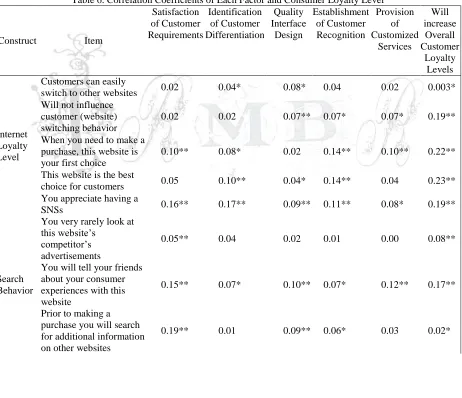
This study conducts a correlation analysis of the five factors and satisfaction and loyalty levels to understand the correlation between each factor and satisfaction and loyalty levels. This study organizes the correlation coefficients of the detailed constructs of each factor and the satisfaction and loyalty levels as shown in Tables 5 and 6.
Table 5. Correlation Coefficients of Each Factor and Consumer Satisfaction.
Construct Item
Satisfaction of Customer Requirements
Identification of Customer Differentiation
Quality Interface
Design
Establishment of Customer
Recognition
Provision of Customized
Services
Will increase
Overall Customer Satisfaction
Convenience-of-use
Needs to be easy to
use 0.33** 0.04** 0.12** 0.05 0.12** 0.39**
Needs to provide a user-friendly
interface
0.17** 0.18** 0.18** 0.13** 0.08** 0.37**
Allows the user to be
satisfied with the
website’s
convenience-of-use
0.25** 0.08** 0.11** 0.10** 0.06 0.48**
Product Information
Needs to provide
comprehensive product information
0.25** 0.02* 0.10** 0.06* 0.13** 0.37**
Will increase the time
customers spend
searching for
consumer information
0.09** 0.04 0.06** 0.11** 0.08** 0.08**
After-sales Service
Rapid after-sales
service 0.26** 0.03 0.04 0.06* 0.06* 0.42**
Friendly after-sales
service 0.12** 0.003 0.005 0.06 0.06 0.22**
Free after-sales
service 0.21** 0.02 0.004 0.04 0.08** 0.40**
Website Design
Can reduce the time customers spend on consuming
0.15** 0.06* 0.09** 0.12** 0.07* 0.47**
Can assist customers in simplifying the consumer process
0.17** 0.12** 0.13** 0.09** 0.10** 0.46**
Security
Needs to develop
flawless website
transaction security
0.31** 0.01 0.07* 0.09** 0.13** 0.40**
Needs to provide
flawless transaction
mechanisms
0.16** 0.01 0.05* 0.04 0.11** 0.19**
Will increase overall
customer satisfaction 0.23** 0.07* 0.07** 0.10** 0.01 1.00
ISSN: 2306-9007 Hsieh (2017) 300
I
www.irmbrjournal.com March 2017I
nternationalR
eview ofM
anagement andB
usinessR
esearchVol. 6 Issue.1
R
M
B
R
This study discovers that the results show correlation between Factor 1, satisfaction of customer requirements, and all of the satisfaction constructs; and that Factor 2, identification of customer differentiation is correlated to convenience-of-use, product information and website design. Factor 3, quality interface design is correlated to convenience-of-use, product information, website design and security. The results show correlation between Factor 4, establishment of customer recognition, and Factor 5, provision of customized services, with convenience-of-use, product information, after-sales service, website design, and security. At the same time, the study also reveals that in the relationship between the five factors and the loyalty level constructs, the majority all reveal correlating circumstances.
The results of this study clearly demonstrate that a certain complex correlation exists between the CSF of SNSs and satisfaction and loyalty levels. Prior research revealed that SNSs certainly has an influence on satisfaction and loyalty levels. This study extends these findings by addressing the influence of SNSs CSF on satisfaction and loyalty levels and by identifying the potential correlation between them and the satisfaction and loyalty constructs. Accordingly, an investigation into how SNSs CSF influence satisfaction and loyalty constructs is a topic worthy of in-depth investigation by subsequent research.
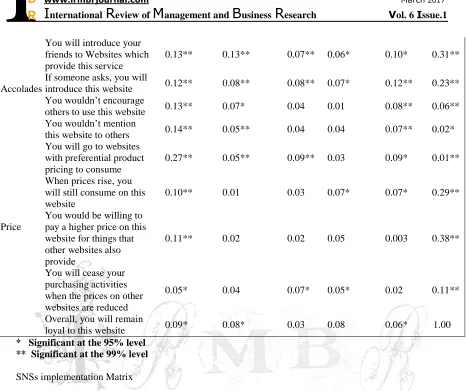
Table 6. Correlation Coefficients of Each Factor and Consumer Loyalty Level
Construct Item
Satisfaction of Customer Requirements
Identification of Customer Differentiation
Quality Interface
Design
Establishment of Customer Recognition
Provision of Customized
Services
Will increase
Overall Customer
Loyalty Levels
Internet Loyalty Level
Customers can easily
switch to other websites 0.02 0.04* 0.08* 0.04 0.02 0.003*
Will not influence customer (website) switching behavior
0.02 0.02 0.07** 0.07* 0.07* 0.19**
When you need to make a purchase, this website is your first choice
0.10** 0.08* 0.02 0.14** 0.10** 0.22**
This website is the best
choice for customers 0.05 0.10** 0.04* 0.14** 0.04 0.23**
You appreciate having a
SNSs 0.16** 0.17** 0.09** 0.11** 0.08* 0.19**
Search Behavior
You very rarely look at this website’s
competitor’s advertisements
0.05** 0.04 0.02 0.01 0.00 0.08**
You will tell your friends about your consumer experiences with this website
0.15** 0.07* 0.10** 0.07* 0.12** 0.17**
Prior to making a purchase you will search for additional information on other websites
ISSN: 2306-9007 Hsieh (2017) 301
I
www.irmbrjournal.com March 2017I
nternationalR
eview ofM
anagement andB
usinessR
esearchVol. 6 Issue.1
R
M
B
R
AccoladesYou will introduce your friends to Websites which provide this service
0.13** 0.13** 0.07** 0.06* 0.10* 0.31**
If someone asks, you will
introduce this website 0.12** 0.08** 0.08** 0.07* 0.12** 0.23**
You wouldn’t encourage
others to use this website 0.13** 0.07* 0.04 0.01 0.08** 0.06**
You wouldn’t mention
this website to others 0.14** 0.05** 0.04 0.04 0.07** 0.02*
Price
You will go to websites with preferential product pricing to consume
0.27** 0.05** 0.09** 0.03 0.09* 0.01**
When prices rise, you will still consume on this website
0.10** 0.01 0.03 0.07* 0.07* 0.29**
You would be willing to pay a higher price on this website for things that other websites also provide
0.11** 0.02 0.02 0.05 0.003 0.38**
You will cease your purchasing activities when the prices on other websites are reduced
0.05* 0.04 0.07* 0.05* 0.02 0.11**
Overall, you will remain
loyal to this website 0.09* 0.08* 0.03 0.08 0.06* 1.00
* Significant at the 95% level ** Significant at the 99% level
SNSs implementation Matrix
This study posits satisfaction and loyalty level as the X axis (satisfaction) and Y axis (loyalty level) respectively and divides users into four categories to constitute a four quadrant matrix graph. After this, the previously stated critical success factors are re-coordinated to conduct a Success -Rate test for the upper and lower groups of factors directed at the four quadrants (See Table 7). Finally, those test results that are significant are re-entered into the matrix graph to produce the SNSs implementation matrix (As shown in Graph 1).
Table 7. SNSs CSF Success Rate Test.
Succe ss Rate (%)
First Quadrant Second Quadrant Third Quadrant Fourth Quadrant
Fa cto r 1 Fa cto r 2 Fa cto r 3 Fa cto r 4 Fa cto r 5 Fa cto r 1 Fac tor2 Fac tor3 Fac tor4 Fac tor5 Fa cto r 1 Fa cto r 2 Fac tor3 Fac tor4 Fac tor 5 Fa cto r 1 Fac tor 2 Fac tor3 Fa cto r 4 Fa cto r 5 Upper Group 63. 51 68. 92 68. 92 72. 97 59.
46 50
47.3 0 48.6 5 45.9 5 45.9 5 45. 9 42.6 2 49.5 9 50.4 0 42. 32 54.5 7 50.4 5 45. 71 44. 49 Lower Group 54. 05 48. 65 48. 65 44. 59 58. 11 37. 84 40.5 4 39.1 9 41.8 9 41.8 9 40. 16 37. 5 40.7 8 33.8 1 33.0 0 34. 49 41.2 5 41.2 2 39. 18 40. 41 Differ ence 9.4 6 20. 27 20. 27 28. 38 1.3 5 12.
16 6.76 9.46 4.06 4.06
3.0
8 8.4 1.94
15.7 8 17.4 0 7.8 3 13.3
2 9.23
6.5 3 4.0 8 Signifi cance Level 0.1 6 0.2 8 0.0 7 0.0 1** 0.0 6 0.0
1** 0.20 0.18 0.19 0.15
0.1 9
0.2
7 0.06
0.00 ** 0.00 2** 0.0 8 0.00 1** 0.04 * 0.2 1 0.0 7
ISSN: 2306-9007 Hsieh (2017) 302
I
www.irmbrjournal.com March 2017I
nternationalR
eview ofM
anagement andB
usinessR
esearchVol. 6 Issue.1
R
M
B
R
SNSs Implementation Matrix
The SNSs implementation matrix is divided into a total of four quadrants in accordance with user satisfaction and loyalty level (See Graph 1). In the graphic illustration, it can be observed that for consumers of different satisfaction and loyalty levels, the success rates of SNSs are significantly different and that the influence factors also differ.
Quadrant 1: High Satisfaction and Loyalty Levels
The users in this quadrant are of the opinion that establishing customer identification is the most important critical success factor. According to interviewee 19: ―I have already participated as a member of Vegeville for two years‖ and ―my satisfaction is high because it makes me feel like I am a member of the village (this Website uses villager to refer to its members). And I am unable to find another vegetarian website as good as this one‖.
Quadrant 2: Low Satisfaction and High Loyalty Levels
The users in this quadrant consider satisfaction of customer requirements the most important critical success factor. For instance, interviewee 15 pointed out that ―The reason why I continue to use ezfly’s services, today, is because other companies aren’t that good‖. ―It (indicating ezfly) will automatically send me accumulated bonuses, however, their isn’t really anyway to exchange them for anything‖ and ―to the contrary, it gives one the impression that it is just another way of selling something.‖ ―And if it is very easy to refund a ticket, the processing charges aren’t too expensive and if rooms can be reserved on the same day then my satisfaction will increase.‖
Quadrant 3: Low Satisfaction and Loyalty Levels
The users in this quadrant are of the opinion that establishment of customer recognition and. provision of customized services are the most important critical success factors. Clow and Cole (2004) show that Success in retailing is partly due to understanding the value of customers and how to leverage customer relationships to yield the maximum return. Interviewee 32 stated: ―After joining an economics teachers’ learning community for a short while‖, ―I didn’t feel like participating again. Apart from downloading certain handouts, I didn’t really have any motivation to visit it again‖ and ―I feel that E-communities ought to be like a family and allow for mutual concern and the sharing of messages‖. Luo and Seyedian (2004) show that customers’ perceived contextual marketing and customer-oriented strategies are associated with site satisfaction and loyalty. Rahman (2004) also shows that direct contact of the customer and the ser vice provider is required, as the recipient is an object that has to be in contact with the service provider, so that service can be performed on it. Interviewee 01 expressed that ―PChome provides an E-magazine service but after a while I would get rid of it without even reading it because I felt that these E-magazines aren’t really One-to-one but are many-to-many and that everyone is reading the same one‖. ―I think that its category selection can be a bit more detailed and in this way we would all receive E-reports that have greater variety.‖
Quadrant 4: High Satisfaction and Low Loyalty Levels
Users in this quadrant think that satisfaction of customer requirements and quality interface design are the most important critical success factors. Interviewee 20 pointed out: ―I go on a group tour once every year‖ and Lionart’s website is pretty good‖ and ―although it dispatches member reports, it is still unable to send me the travel information that I want in accordance with my needs‖. Interviewee 22 also stated: ―I feel that the trip search interface is most the most important factor in determining whether a website is good or bad‖, ―but I also hope that these websites are capable of two-way connections that offer greater convenience when we are searching for a trip‖.
Based on the SNSs implementation matrix, enterprises can undertake to increase user satisfaction and
ISSN: 2306-9007 Hsieh (2017) 303
I
www.irmbrjournal.com March 2017I
nternationalR
eview ofM
anagement andB
usinessR
esearchVol. 6 Issue.1
R
M
B
R
Low
High
Satisfaction
Low
High
Satisfaction of Customer Requirements
(Success Rate: 66.15%)
Provision of Customized Services
(Success Rate: 38%)
Establishment of Customer Recognition
Quality Interface Design
(Success Rate: 69.58%)
Identification of Customer Differentiation Establishment of Customer
Recognition
(Success Rate: 86.89%)
Loyalty
this study has previously proven that satisfaction of customer requirements, identification of customer differentiation, quality interface design, and establishment of customer recognition can increase user satisfaction. Satisfaction of customer requirements, identification of customer differentiation and provision of customized services can increase user loyalty levels. Accordingly, by providing the five CSF in coordination with the application of the SNSs implementation matrix, it is possible for enterprises to increase the success rate of developing SNSs.
Figure1 SNSs Implementation Matrix
Conclusions and Suggestions
Conclusions
Correlations of SNSs CSF and Satisfaction and Royalty
The primary contribution of this study is the incorporation of User Perspectives to determine the five factors for measuring the implementation of SNSs. This study discovers the measurement factors for SNSs for User Perspectives to consist of satisfaction of customer requirements, identification of customer differentiation, quality interface design, establishment of customer recognition, and provision of customized services The study demonstrates that four of the five measurement factors are significantly correlated with SNSs satisfaction, and three are correlated with royalty.
ISSN: 2306-9007 Hsieh (2017) 304
I
www.irmbrjournal.com March 2017I
nternationalR
eview ofM
anagement andB
usinessR
esearchVol. 6 Issue.1
R
M
B
R
Therefore, this study suggests that when websites are implementing SNSs, they can use these CSF as the entry point. They can increase the user satisfaction and royalty of the websites by taking into account the factors provided in this study. This in turn can assist the websites to adopt appropriate actions during implementation and effectively monitor and execute the introduction of SNSs.
SNSs Matrix
The major contribution of this study is to start with the views of users to investigate into the five CSF -- satisfaction of customer requirements, identification of customer differentiation, quality interface design, establishment of customer recognition, and provision of customized services -- of SNSs implementation. This study further proposes a SNSs implementation matrix which allows the websites to provide appropriate success factors in the future, aiming at the levels (high/low) of user satisfaction and royalty in order to enhance the success rate of SNSs.
Based on the high and low levels of satisfaction and royalty, this study classifies the samples into four categories. Users in quadrant one (high satisfaction, high royalty) consider the establishment of customer recognition the most important critical success factor; users in quadrant two (low satisfaction, high royalty) consider the satisfaction of customer requirements the most important CSF; users in quadrant three (low satisfaction, low royalty) consider the establishment of customer recognition, and provision of customized services to be the most important CSF; users in quadrant four (high satisfaction, low royalty) consider identification of customer differentiation and quality interface design to be the most important CSF.
Managerial Implications
Researchers in this study sent results to business professionals currently engaging in the execution of SNSs and inquired of them their opinions and the possible directions and implications for management. Finally, a total of ten business professionals met together for discussions concerning the following:
The success of SNSs is based on the following:
Identification of Customer Differentiation and Satisfaction of Requirements Are the Foundations of Success.
Significant is the ability to identify customer differentiation, and to provide different products and services for different customers, in order to satisfy their requirements. Similar to what business professional 3 mentioned: The development of SNSs begins with an understanding of customers. Necessary is the collection of information through interactions with customers, along with differentiation among customers’ requirements and recommending of appropriate products and services to consumers.
These areas are the fundamental elements for successful implementation of SNSs. At the same time, enterprises must continue to inspect and create service requirements and keep on developing those products and services to meet the requirements. For example, business professional 7 said: ―The Web environment is much more complex than the tangible environment. In this world, a lot of requirements are created; thus website management requires endless creative ideas. ―
Customer Recognition is an Important Measure
ISSN: 2306-9007 Hsieh (2017) 305
I
www.irmbrjournal.com March 2017I
nternationalR
eview ofM
anagement andB
usinessR
esearchVol. 6 Issue.1
R
M
B
R
measure the sense of recognition. In the present, the way we create user recognition is to try our best to give them the impression that we are a big family. Once they join us, we give them many small gifts. In addition to the customized web address or regular emailing of membership letters as general websites have, we also give them stickers and create an environment where our community’s unique common language is used.‖
Research Limitations
Although this study makes the best effort to increase the completeness and reliability of the research process, research limitations can still occur. Just as Stern (1979) suggested, a person’s memory is distorted until it matches with a perspective he/she is more comfortable with in the present. This suggests that when an interviewee is requested to convey information related to his/her involvement in SNSs, it is possible that the collected information be distorted because of some limitation, or perhaps some incidences have recently transpired or have been more important to the interviewee (Emory, 1980).
In this study, SNSs projects may be recognized as having high satisfaction or royalty due to the fact that users may have had a very good experience in the usage process. That is, in the process, it may be that because the interviewee has already had a good or bad experience, research results are over-or underrated. In light of this, this study, when conducting the test, incorporated ―average‖ into the lower-half group in an effort to reduce any potential error that may result.
In addition, another source of errors in this study concerns the accuracy of the interviewees’ answers. Assael and Keon (1992) revealed this type of error is a response error that involves issues of memory and reliability. This study employs many methods, such as adopting pre-testing and designing clear and easily answered page layout for the questionnaire, in order to ensure the accuracy of the study. Because not all sources of errors can be eliminated, this produces another limitation of this study.
Future Research Directions
This study focuses on users who have received the six SNSs services before for investigation. . Subsequent researchers can aim at other possible marketing service types to conduct research and engage in a comprehensive comparison and verification. This includes the comparison of possible CSF for each of the six SNSs services, and the influence of these CSF on satisfaction and royalty, in order to understand the differentiation of various SNSs service types. Subsequently, a scale can be developed to measure the success or failure of that one specific marketing method aiming at the degree of development in that SNSs service. That is, enterprises can measure the success rate of a SNSs service by using this scale in inspections.
In addition, this study discovers the existence of a complex relationship between the Critical Success Factors and the measurement of SNSs service satisfaction and royalty constructs; and this relationship awaits further exploration by subsequent research. This study also finds that customer recognition is an important measure for SNSs. Future research can develop a scale focusing on recognition and examine the concrete methods to increase recognition.
ISSN: 2306-9007 Hsieh (2017) 306
I
www.irmbrjournal.com March 2017I
nternationalR
eview ofM
anagement andB
usinessR
esearchVol. 6 Issue.1
R
M
B
R
Reference
Allen, C.; Kania, D.; and Yaeckel, B. (2001). One to One Web Marketing: Build a Relationship Marketing
Strategy One Customer at a Time. 2nd edition. John Wiley and Sons, New York.
Allison, N.K. (1978). Psychometric Development of a Test for Consumer Alienation form the Marketplace.
Journal of Marketing Research, 15 (November), 565-575.
Assael, H., and Keon, J. (1982). Nonsampling vs. Sampling Errors in Survey Research. Journal of
Marketing, 46 (Spring), 114-123.
Bejou, D., and Palmer, A. (1998). Service failure and loyalty: an exploratory empirical study of airline customers. Journal of Services Marketing, 12 (1), 7-22.
Bortree, D. S., and Seltzer, T. (2009). Dialogic strategies and outcomes: an analysis of environmental
advocacy groups' Facebook profiles. Public Relations Review, 35(3), 317-319.
Boyd, H.W. Jr.; Westfall, R.; and Stasch, S.F. (1989). Marketing Research: Text and Cases. 7th ed. Homewood, IL: Richard D. Irwin, Inc.
Bryman, A. (1992). Quantity and Quality in Social Research. London: Routledge.
Burgess, Robert G. (1993). Research Methods, Thomas Nelson and Sons Ltd.
Butcher, K., Sparks, B. and O’Callaghan, F. (2001). Evaluative and relational influences on service loyalty.
International Journal of Service Industry Management, 12 (4), 310-327.
Cho, Namjae and Park, Sanghyuk (2001). Development of electronic commerce user-consumer satisfaction
index (ECUSI) for internet shopping. Indusrial Management & Data Systems, 101 (8), 400-405.
Chun, J. W. and Lee, M. J. (2016). Increasing individuals' involvement and WOM intention on Social
Networking Sites: Content matters!. Computers in Human Behavior, 60, 223-232.
Churchill, Gilbert A. , Jr. (1995). Marketing research :/methodological foundations, 6nd, Forth Worth: Dryden Press.
Churchill, Gilbert A., Jr., Neil M. Ford and Orville C. Walker, Jr. (1974). Measuring the Job Satisfaction of
Industrial Salesmen. Journal of Marketing Research, 11 (August), 254-260.
Clow, Kenneth E. and Cole, Henry S. (2004). Small Retailers’ Road to Success: The Customer Value Concept. Services Marketing Quarterly, 26 (2), 69-81.
Davids, M. (1999). How to avoid the 10 biggest mistakes in CRM. Journal of Business Strategy, 20 (6 November-December), 20-30.
Dekimpe, M. G., Steenkamp, Jan-Benedict E-M., Mellens, M. and Abeele, P. V. (1997). Decline and variability in brand loyalty. International Journal of Research in Marketing, 14 (5), 402-420.
DeLone, William H. and McLean Ephraim R. (2003). The DeLone and McLean Model of Information
Systems Success: A Ten-Year Updat0e. Journal of Management Information Systems, 19 (4), 9-30.
Dick, A. S. and Basu, K. (1994). Customer loyalty: an integrated conceptual framework. Journal of Marketing Science, 22 (2), 99-113.
Dick, A.S., and Basu, K. (1994). Customer Loyalty: Toward an Integrated Conceptual Framework. Journal
of the Academy of Marketing Science, 22(2), 99-113.
Emory, C. William (1980). Business Research Methods, Revised Edition, Richard D. Irwin, Inc.
Fletcer, A., and Lee, M. (2012). Current social media uses and evaluations in American museums. Museum
Management and Curatorship, 27(5), 26, 505-521.
Flor, Nick V. and Maglio, Paul P. (2004). Modeling business representational activity online: A case study
of a customer-centered business. Knowledge-Based Systems, 17 (January), 39-56.
Frantz, Bryan and McDougall, Gordon (2004). Assessing the Potential of Customer Relationship
Management: Clarifying the Decision. Services Marketing Quarterly, 26 (1), 1-18.
Grewal, Dhruv, Iyer, Gopalkrishnan R., Krishnan, R. and Sharma, Arun (2003). The Internet and the price–
value–loyalty chain. Journal of Business Research, 56 (May), 391-398.
Gu, R., Oh, L.B. and Wang, K. (2016). Developing user loyalty for social networking sites: a relational
perspective. Journal of Electronic Commerce Research, 17 (1), 1–21.
Hagel, III. J. and Armstrong, A. G. (1997). Net Gain: Expanding Marketing through Virtual Communities,
ISSN: 2306-9007 Hsieh (2017) 307
I
www.irmbrjournal.com March 2017I
nternationalR
eview ofM
anagement andB
usinessR
esearchVol. 6 Issue.1
R
M
B
R
Hung, S.Y., Tsai, C. A., and Chou, S.T. (2016). Decomposing perceived playfulness: A contextual examination of two social networking sites. Information & Management, 53(6), 698-716.
Jarach, David (2002). The digitalisation of market relationships in the airline business: the impact and
prospects of e-business. Journal of Air Transport Management, 8 (2), 115-120.
Jelassi, Tawfik and Leenen, Stefanie (2003). An E-commerce sales model for manufacturing companies: a
conceptual framework and a European example. European Management Journal, 21 (1), 38-47.
Jun, Minjoon and Cai, Shaohan (2001). The key determinants of internet banking service quality: a content analysis. International Journal of Bank Marketing, 19 (7), 276-291.
Kalakota, R. and Robinson, M. (1999). e-Business: Roadmap for Success, Addison-Wesley Longman,
Mass.
Kang, Y.S., Hong, S., and Lee, H. (2009). Exploring Continued Online Service Usage Behavior: The Roles
of Self-Image Congruity and Regret. Computers in Human Behavior, 25, 111-122.
Khalifa, M., and Liu, V. (2003). Satisfaction with Internet-Based Services: The Role of Expectation and Desires. International Journal of Electronic Commerce, 7 (2), 31-49.
Lin, H., Fan, W, and Chau, P. Y. K. (2014). Determinants of users’ continuance of social networking sites: A self -regulation perspective. Information & management, 51(5), 595-603.
Liu, Chang and Arnett, Kirk P. (2000). Exploring the factors associated with Web site success in the
context of electronic commerce. Information and Management, 38 (October), 23-33.
Luo, X., and Seyedian, M. (2004). Contextual Marketing and Customer-Orientation Strategy for E-Commerce: An Empirical Analysis. International Journal of Electronic Commerce, 8 (Winter), 95-118.
Madu, C.N., Kuei, C.H. and Jacob, R.A. (1996). An empirical assessment of the influence of quality dimension on organizational performance. Internal Journal of Production Research, 34 (7), 1943-1962.
Men, L. R., and Tsai, W.-H. S. (2015). Infusing social media with humanity: corporate character, public
engagement, and relational outcomes. Public Relations Review, 41(3), 395-403.
Menon, Satya and Kahn, Barbara (2002). Cross-category effects of induced arousal and pleasure on the internet shopping experience. Journal of Retailing, 78 (Spring), 31-40.
Nisar, T. M., and Whitehead, C. (2016). Brand interactions and social media: Enhancing user loyalty
through social networking sites. Computers in Human Behavior, 62, 743-753.
Noerager, John P. (1979). An Assessment of CAD- A Personality Instrument Developed Specifically for
Marketing Research. Journal of Marketing Research, 16 (February), 53-59.
Nunnally, Jum C. (1967). Psychometric Theory, New York: McGraw-Hill Book Company.
Oliver, R. L. (1999). Whence consumer loyalty?. Journal of Marketing, 63, 33-44.
Owen, Robert S. (2004). Consumer Warranties and Satisfaction Guarantees: Some Definitions and Issues.
Services Marketing Quarterly, 26 (2), 49-67.
Pavlou, P.A. (2003). Consumer Acceptance of Electronic Commerce: Integrating Trust and Risk with the
Technology Acceptance Model. International Journal of Electronic Commerce, 7 (3 Spring, 101-134.
Peppers, D. and Rogers, M. (2000). The One to One Manager: Real-World Lessons in Customer Relationship Management, Doubleday, New York.
Peppers, D., Rogers, M. and Dorf, B. (1999). Is your company ready for one to one marketing?. Harvard
Business Review, 77 (1 January-February), 151-160.
Rahman, Zillur (2004). A Model for the Sales and Distribution of E-Services. Services Marketing
Quarterly, 26 (1), 71-87.
Rau, P. P., Gao, Q., and Ding, Y. (2008). Relationship between the level of intimacy and lurking in online
social network services. Computers in Human Behavior, 24 (6), 2757-2770.
Reaves, Celia C. (1992). Quantitative Research for the Behavioral Science, John Wiley & Sons, Inc. Shankar, Venkatesh, Smith, Amy K. and Rangaswamy, Arvind (2003). Customer satisfaction and loyalty in
online and offline environments. International Journal of Research in Marketing, 20 (2 June), 153-175.
ISSN: 2306-9007 Hsieh (2017) 308
I
www.irmbrjournal.com March 2017I
nternationalR
eview ofM
anagement andB
usinessR
esearchVol. 6 Issue.1
R
M
B
R
Statista, Number of Social Network Users Worldwide from 2010 to 2020 (in Billions), 2016, Retrieved
online http://www.statista.com/statistics/278414/number-of-worldwide-social-network-users/ on
November 30, 2016.
Stern, Paul C. (1979). Evaluating Social Science Research, Oxford: Oxford University Press.
Sung, K. H., and Lee, M. J. (2015). Do online comments influence the public's attitudes toward an organization? Effects of online comments based on individuals' prior attitudes. The Journal of Psychology: Interdisciplinary and Applied, 149(4), 325-338.
Sung, K., and Kim, S. (2014). I want to Be your friend: the effects of organizations' interpersonal
approaches on social networking sites. Journal of Public Relations Research, 26(3), 235-255.
Szymanski, David M. and Hise, Richard T. (2000). E-satisfaction: an initial examination. Journal of Retailing, 76 (3), 309-322.
Teo, Thompson S.H. and Yeong, Yon Ding (2003). Assessing the consumer decision process in the digital
marketplace. Omega, 31 (5 October), 349-363.
Tull, Donald S. and Del I. Hawkins (1990). Marketing Research: Measurement & Methods, 5th ed., New
York: Macmillan Publishing Company.
Wang, D., Xu, L., and Chan, H.C. (2015). Understanding the Continuance Use of Social Network Sites: A
Computer Self-Efficacy Perspective. Behaviour & Information Technology, 34(2), 204-216.
Weber, M. S., Fulk, J., and Monge, P. (2016). The Emergence and Evolution of Social Networking Sites as
an Organizational Form. Management Communication Quarterly, 30 (6), 1-28.
Wells, J. D., Fuerst, W. L. and Choobineh, J. (1999). Managing Information Technology (IT) for One-to-One Customer Interaction. Information & Management, 35, 53-62.
Wixom, B. H., and Watson, H. J. (2001). An Empirical Investigation of The Factors Affecting Data
Warehousing Success. MIS Quarterly, 25 (1), 17-41.