ISSN: 2306-9007 Saparso (2017) 438
I
www.irmbrjournal.com June 2017I
nternationalR
eview ofM
anagement andB
usinessR
esearchVol. 6 Issue.2
R
M
B
R
Antecedents Analysis of Trust, Satisfaction and Consequence
of Commitment in Customer Relationship Life Insurance in
Jakarta
SAPARSO
Faculty Economic, Krida Wacana Christian Univercity
Email: [email protected]
Abstract
This research is descriptive and explanatory survey which addresses the issue of commitment between the customer and insurance company. Comprehensively, the purpose of this study was to examine the influence of economic content, resource content, social content and the emotional content the trust and satisfaction and the consequency relationship commitment of life insurance customers. The sample 393 of the research are customer of the 10 best life insurance companies which are located in Jakarta. Data is obtained from the questionnaire, which the respondents were selected by random sampling method. The analysis technique used in this study a Structural Equation Model (SEM) using LISREL 8.8 program. The analysis result that together the economic content, resource content, social content and the emotional content influence the trus which the determinant of R2 = 0.70 or there is a significant influence between the economic content, resource content, social content and emotional content the trust by giving contribution of 70 %. The amount of trust influence is formed by two key indicators, the social content and the emotional content with each coefficient value of 0.43 and 0.44. Together the economic content, resource content, social content and the emotional content influence the satisfaction with the determinant of R2 = 0.91 or there is influence between economic content, resource content, social content and the emotional content to the satisfaction with the contribution of 91 % . An enormous influence on the satisfaction is also influenced by two indicators they are social content with the coefficient value of 0.26 and the emotional content of 0.67. Together trust and satisfaction influence the relationship commitment with the value of R2 = 0.69. It means that together the trust and satisfaction influence the commitment with the contribution of 69%. The amount of commitment relationship influence is formed by the two variables of trust and satisfaction, with each coefficient value of 0.41 and 0.47. This study found that the relationship commitment is the result of satisfaction of product quality, price, information, and service given as well as the trust that was built by the company through the employee reptation (agents) are honest and trusted. Customer satisfaction can be realized driven by emotional bonding because the customers believe that the insurance company is quite well-known and the insurance company can provide the product quality which is suitable with what an expected and gives believe to the customers on their choices.
Key Words: Economic Content, Resource Content, Social Content, Emotional Content, Trust, Satisfaction and Relationship Commitment.
Introduction
ISSN: 2306-9007 Saparso (2017) 439
I
www.irmbrjournal.com June 2017I
nternationalR
eview ofM
anagement andB
usinessR
esearchVol. 6 Issue.2
R
M
B
R
of 235,3 million, with a GDP per capita of $ 3,495. Life insurance penetration in Indonesia is still inferior to India which has a GDP per capita of $ 1,509 with a population of 1.241.491.960 people, capable of performing life insurance penetration of 3.4 %. Means the ability of the insurance company in India to attract potential customers better than insurance companies in Indonesia (Ernts & Young , 2012).
In terms of life insurance participation in Indonesia from the 2007-2011 average of 3.66 %, or an annual increase is only 0.38 %. Compared with the population growth rate of approximately 1.25 % per year is very small (Lap.AAJI , 2012). The low life insurance ownership is caused by several factors, the first level of income is not too high, people do not understand the benefits of life insurance that life insurance is not a priority. Third lack of effort by the life insurance industry to educate the market about the importance of life insurance (Ernst & Young, 2012). Furthermore, Ernst & Young survey gives some interesting information related to trust, satisfaction and economic content, resource content, social content and the emotional content in building commitment and intensity of the relationship between the customer (client) with a life insurance company (service provider).
The results of research on the level of confidence (trust) life insurance customers associated with economic content, 85 % Indonesian customers believe that products are purchased as needed, and 52 % of respondents would choose to buy the same product, if the convenience and value of benefits is maintained. Confidence (trust) that is established by the resource content is represented by the company's reputation for its performance in providing services to customers, 42 % say they do not believe. Disclosure of information, consistency of the various sources that make up the confidance benefits delivered to customers, should be simple, pro with consumers as well as easy to understand. 38 % rensponden will make direct contact with the insurance company (agent), 47 % through the official website of the company. For the level of confidence (trust) formed by social content, which is represented by the consistent delivery of information. Confidence (trust) which is formed by the emotional content is represented by convenience (enjoy), 43 % of respondents say quite comfortably, by reason of the company provides convenience in the purchase process. Likewise, the product purchased is believed to meet their needs. Another thing about the belief that the quality of the products offered by the insurance company have a good quality perception rensponden reflected in the results, 79 % said the product is trustworthy (Ernst & Young , 2012).
Similarly, the economic side of the content, life insurance companies in Indonesia only got a percentage of 26% while Malaysia is able to reach 37 %. China life insurance company that is able to dominate the economic content for the Asia Pacific region by 52 % ( Ernst & Young ; 2012).
Iinteraction and ease of access of the social content related to the disclosure of information that was built by a company is essential to build trust and satisfaction. A survey conducted by Ernst & Young (2012) revealed for the Asia Pacific region, 89 % of respondents said the interaction and openness is very important. However, 44 % of respondents were not sure of the interaction that is built to meet expectations, because customers feel the company is only focused on selling products to meet the needs of the customer.
ISSN: 2306-9007 Saparso (2017) 440
I
www.irmbrjournal.com June 2017I
nternationalR
eview ofM
anagement andB
usinessR
esearchVol. 6 Issue.2
R
M
B
R
Literature Review
Theoretical Considerations
Economic Content
According to Morgan (2000 : 485) is the economic content of economic benefits received by participants involved in the relationship. Economic content is the same meaning with financial ties presented by Zeithaml and Bitner (2003 : 175). Economic content can be measured by economic value (economic value) and service value (Lacey, 2003; 37). The economic value associated with the cost- benefit ratio that is felt each party involved in a reciprocal relationship of mutual benefit. Success in delivering economic value to customers can improve quality, reduce customer perceived sacrifice or by minimizing the cost to the customer. The value of the sacrifice by Burnham et al (2003 : 113) referred to as the switching cost that includes search costs, learning costs, relationship specific investments, and so on .
Resource Content
Resource content is an enterprise resource that can be used to build relationships with partners. According to Morgan (2000: 322), the resources have a strategic role in a reciprocal relationship. Meanwhile, Hennig - Thurau et al.(2000: 77) states that the competitive advantage derived from their ownership of different abilities that are relevant (relevant capability differentials). Resource Content can be measured by the reputation of the company (company reputation) and confidence benefits (Lacey, 2003; Boonajsevee, 2005; Morgan, 2000: 487). The company's reputation is one's perception of the state of the past and the future prospects of the company or product quality. The reputation of the company describes the person's knowledge about a product or service. Confidence benefits related to the company's ability to reduce fears and provide comfort for the customers to know what to expect from a service provider (Gwinner et al., 1998: 103).
Social Content
Social content is a social relationship that is formed from the interaction between the service provider to the customer (Morgan, 2000 : 489). Although social content may be irrelevant to some transaction -oriented company, but this category is considered to be the basis for the successful implementation of marketing kerelasian. Cross and Smith (in Gounaris, et al., 2003: 171) describes as a social content and encourage the process of developing a reciprocal relationship of mutual benefit between providers and buyers. Conceptual formulation of social content is a relationship that is formed from the interaction between employees and customers. Operationally social content, has two dimensions of communication and familial dimensions. Dimensions of communication (communication) measured by delivering information submitted routinely given to customers of the company and its customers easy access to information. Familial dimensions (familiarity) is measured on the basis of employee interactions with customers insurance conducted in ways personal, which is characterized by a very intense communication.
Emotional Content
ISSN: 2306-9007 Saparso (2017) 441
I
www.irmbrjournal.com June 2017I
nternationalR
eview ofM
anagement andB
usinessR
esearchVol. 6 Issue.2
R
M
B
R
content operationally there are four dimensions consisting of price perception (perceived price), perceived quality (perceived quality), comfort (joy), disillusionment (disappointment) when real customers making transactions on such services. Perception price (perceived price) is measured with the views or opinions of the customers on the premiums offered by insurance that customers will be more advantaged than the benefits to be received. Perceived quality (perceived quality) is measured with the opinion of the customers on quality (reflected in the company's name) that the client is not wrong to choose the products that are offered. Leisure (joy) is measured by the amount of customer confidence that this insurance can provide assurance as expected. Disillusionment was measured by feelings of guilt due to errors (already choose) in determining insurance as an option.
Trust
Morgan (2000: 223) describes the "confidence " within the meaning of this belief arose because of a that can bind themselves, such actions consistent, competent, honest, fair, responsible, helpful and humble (benevolent). Garbarino and Johnson (1999 : 79) rate for the trust put more emphasis on individual self-esteem with respect to consumer confidence on the quality and reliability of services rendered. Another benefit of the trust is tolerance. According to Barry et al., (2008 : 213), consumer expectations of service quality is divided into two levels: the level of interest (desired) and the level of adequacy (adequate). Desire describe what consumers think about the service "can" and "should be", describe the adequacy of the level of minimum services received by consumers.
Customer Satisfaction
Customer satisfaction is a ranking of conformity can be described as an appropriate selection of products utilization (Abdul - Muhmin; 2005: 623). He made the postulate that customer satisfaction is generally dikontruksikan as an evaluation performed after consumption depending on the quality or value received by the buyer, expectations, confirmation / disconfirmation on the difference between the real quality with expected quality (Johnson et al., 2009: 19). Conceptually, customer satisfaction is, the result of the overall customer service ratings provided by the company. Operationally has three dimensions of satisfaction with the quality of products, product pricing, and services received whether it meets the needs and desires of customers. Product quality is measured by feeling satisfied with the product's ability to meet customer’s needs. Prices of products is measured by feeling satisfied customers against the costs incurred to get the product as expected. Services received is measured by feeling satisfied customers to built mutual contact by employees with customers (customer ), as well as the perception of the product, price and service received.
Review of Previous Research
In this section we put forward some previous studies that have proximity in terms of scope and research with several variables of this research done.
Hennig - Thurau et al.
ISSN: 2306-9007 Saparso (2017) 442
I
www.irmbrjournal.com June 2017I
nternationalR
eview ofM
anagement andB
usinessR
esearchVol. 6 Issue.2
R
M
B
R
Lacey and Russell Wayne
The research objective Wayne Lacey and Russell (2003 ) was to determine the role of loyalty programs in attracting and developing customer loyalty. In addition, this study also aims to determine how and how much loyalty programs affect the customer's desire to always buy the products and services of the company and the customer wishes to be a strategic resource for the firm. The variable in this study is the economic content, resource content, social content, commitment, trust, economic outcomes, resources outcomes, and social outcomes. The results showed that the content of economic variables, resource content, and social content have a significant effect on commitment, trust and relational outcomes: economic outcomes, resource outcomes, and social outcomes.
Venetis and Ghauri
The variables studied were relational bonds (structural bonds, social bonds), trust, service quality, relationship commitment and relationship intention. The study aimed to assess the effect of relational bonds, trust and service quality on relationship commitment and intention . Researchers integrate literature business-to-business marketing literature to develop a model of service quality relationship linking the commitment and other factors. The results showed:
i. Affective commitment and calculative commitment positively and significantly associated with intention relationship.
ii. Structural bonds, social bonds, trust and service quality positively and significantly berhubngan with affective commitment.
iii. Stuck bonds is negatively related to affective commitment Investment bonds, switch bonds, social bonds, service quality positively and significantly associated with calculative commitment.
iv. Stuck trust bonds and negatively related to calculative commitment.
Morgan et al.
Research on trust and commitment is modeled as a linking variable between the independent variables of trust and commitment to the outcomes of trust and commitment. The independent variables consist of relationship termination costs, relationship benefits, shared values, communication and opportunistic behavior and outcome variables consisted of acquiescence, propensity to leave, cooperation, functional conflict, and uncertainty.
Garbarino and Johnson
The purpose of this study was to observe the effect of the attitude component covering satisfaction actor, actor familiarity, attitudes play, and theatrical attitudes towards satisfaction, trust and commitment, as well as see the effects of trust and commitment to the future intentions. The results showed that the attitude component covering satisfaction actor, actor familiarity, attitudes play, and theatrical attitudes positive and significant effect on trust, satisfaction, and commitment. But there is a significant difference between the theatrical attitudes to trust and commitment, actor familiarity with satisfaction, and satisfaction with the commitment actor.
Boonajsevee
ISSN: 2306-9007 Saparso (2017) 443
I
www.irmbrjournal.com June 2017I
nternationalR
eview ofM
anagement andB
usinessR
esearchVol. 6 Issue.2
R
M
B
R
The results showed that all three factors : benefits, communication, and service quality have a significant effect on relationship quality. The study also found that trust and satisfaction as a component of relationship quality affects customer commitment.
Sulistya Rini, Endang
The aim of the research is to determine the effect of economic content, resource content, and social content of the trust and satisfaction in the relationship further intention. Exogenous variables studied were the economic content, resource content, social content in the trust, satisfaction and commitment. While variable is the relationship endogen intention.
DeWitt, Nguyen and Marshall
The research model was tested using a scenario-based experiments in two settings hospitality industry (restaurants and hotels) settings were selected for two reasons. The first, a hospitality setting provides a context familiar to the customer. Secondly, previous studies have documented that the service failure and recovery often occurs in the hospitality industry. This study shows that loyalty is a function of the customer's trust.
Assessment model that describes the beliefs and emotions as a key mediator in the relationship between perceived justice and customer loyalty. The findings support the notion that emotions and beliefs have an important mediating role during the service recovery process. While this study focused primarily on negative emotions, the authors adopt a model of two-dimensional display of emotions (positive and negative emotions) and the results support the inclusion of both dimensions.
Originality Research
It should be understood that a state-of- the-art of this research comes from the theory of demand in particular the exchange of economic and social, due to the exchange of goods or services is not only an exchange of value for money but also aspects benefits and social didalamnnya. Based on the theory of economic exchange / social is, in the science of developing marketing concepts 4Ps (Product, Price, Place and Promotion), which became known as the marketing mix.
With the rapid development of the economy, was the conception of the marketing mix for the service industry is no longer sufficient to added 3P is physical evidence, people and process, characteristics associated with intangible services, among others. However, in reality the consumer 's decision to purchase was not only influenced or determined by any marketing (marketing effort). One of the consumer's decision to buy is influenced by aspects of social and cultural values also determine, the so-called black box of the consumer (buyer) that will affect the performance of marketing (marketing performance), eg the satisfaction (satisfaction) of the consumer.
ISSN: 2306-9007 Saparso (2017) 444
I
www.irmbrjournal.com June 2017I
nternationalR
eview ofM
anagement andB
usinessR
esearchVol. 6 Issue.2
R
M
B
R
Figure 1: Flowchart A State-of -The-Art Framework
Conseptual Framework
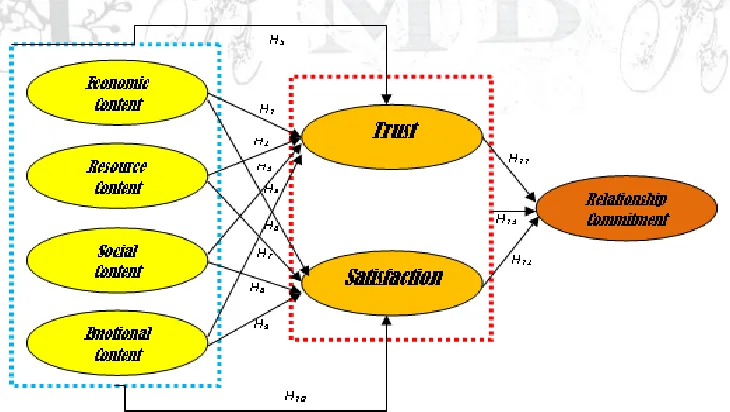
Economic content, resource content, social content , and emotional content either partially or jointly affect the trust and satisfaction. then the trust and satisfaction either individually or jointly affect the relationship commitment. Based on the description above, the framework can be described in the model diagram (Figure 2). The concept framework developed from several models including; Thurau Henning et al, 2002: 21; Morgan, 2000: 483; DeWitt et al, 2008: 276; Johnson et al, 2009: 30; Sulistyarini, 2007: 119, that there are four important factors necessary for the development of relationship marketing.
Figure 2 : Concept of Economic Framework Content, Content Resource, Social Content, and Emotional Content Against Trust, Satisfaction and Relationship Commitment
ISSN: 2306-9007 Saparso (2017) 445
I
www.irmbrjournal.com June 2017I
nternationalR
eview ofM
anagement andB
usinessR
esearchVol. 6 Issue.2
R
M
B
R
Hypothesis
Based on the conceptual framework of the research hypothesis formulated in this study as follows:
1. There is the economic content effect to the customers trust (confidence) life insurance in Jakarta. 2. There is the resource content influence to the customers trust (confidence) life insurance in Jakarta. 3. There is the social content influence to the customers trust (confidence) life insurance in Jakarta. 4. There is the emotional content influence to the customers trust (confidence) life insurance in Jakarta. 5. There jointly influence economic content, resource content, social content, and the emotional content
to the customers trust life insurance in Jakarta.
6. There is the economic content influence to the customers satisfaction life insurance in Jakarta. 7. There is the resource content influence to the customers satisfaction life insurance in Jakarta. 8. There is the social content influence to the customers satisfaction life insurance in Jakarta. 9. There is the emotional content influence to the customers satisfaction life insurance in Jakarta.
10. There jointly influence economic content, resource content, social content, and the emotional content of customer satisfaction life insurance in Jakarta.
11. There is the trust influence to the relationship commitment life insurance in Jakarta. 12. There is the satisfaction influence to the relationship commitment life insurance in Jakarta.
13. There jointly influence the trust and satisfaction of the customer relationship commitment Insurance in Jakarta.
Research Methodology
The method used in this research is descriptive and explanatory survey, because of the type of investigation in this study is that causality suggested a causal relationship between the independent variables covering economic content, resource content, social content, the emotional content of the confidence (trust) and satisfaction and relationship commitment life insurance customers in Jakarta. The unit of analysis of this study is the life insurance customers in Jakarta. Period of this study is the time horizon that is a cross section of part of the population that is information (samples) were collected directly empirically with the aim to know the opinion of the majority population of the object research (Malhotra, 2002; 81). The time of this dissertation research is in August to November 2012.
Method of Data / Information
To get a fairly representative sample, there are several ways and steps to be undertaken in this study. First, an inventory of the amount of Life Insurance in Indonesia Life Insurance companies then make an inventory that included ten (Top Ten) in Indonesia that had offices in the province of Central Jakarta. Second, determine the sample size of the population size in the form of the number of customers (subscribers) Insurance.
In connection with the use of a Structural Equation Modeling (SEM), Imam Widodo and Fuad (2008: 64) states that the sample size has an important role in the interpretation of the results of the SEM. In this study 393 samples used customers with the greater purpose of sample size, the smaller the standard error of estimate (Thomson, 2000; Santoso, 2007, 66 and Hartono, 2012, 104). Determination of a sample of 393 respondents can be obtained by using Slovin formula (Supranto, 1998) as follows:
ISSN: 2306-9007 Saparso (2017) 446
I
www.irmbrjournal.com June 2017I
nternationalR
eview ofM
anagement andB
usinessR
esearchVol. 6 Issue.2
R
M
B
R
Remarks :
N = Number of population n = number of samples e = error tolerance
The target sample calculation using fault tolerance limit of 5%, which means it has an accuracy rate of 95%, calculated as follows :
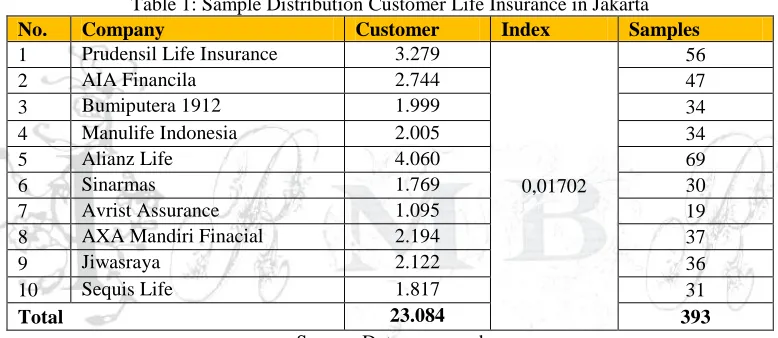
For a sampling technique using rondam sampling technique. While the sampling index value derived from a target sample divided by the population, namely: 393: 23 084 = 0.01702, suppose the target samples for PT Prudential Life Insurance is the 56 respondents obtained by the following calculation; 3279 x 0.01702 = 55.8096 ≈ 56. This index value of the objective is to facilitate calculating the target sample (table 1).
Table 1: Sample Distribution Customer Life Insurance in Jakarta
No. Company Customer Index Samples
1 Prudensil Life Insurance 3.279
0,01702
56
2 AIA Financila 2.744 47
3 Bumiputera 1912 1.999 34
4 Manulife Indonesia 2.005 34
5 Alianz Life 4.060 69
6 Sinarmas 1.769 30
7 Avrist Assurance 1.095 19
8 AXA Mandiri Finacial 2.194 37
9 Jiwasraya 2.122 36
10 Sequis Life 1.817 31
Total 23.084 393
Source: Data processed
Validity
Validity test is done to see the grains of which are decent questions to be used to represent the independent variables in the study. The test is performed using confirmatory factor analysis for each latent variable. If the value of the indicator loading factor greater than 0.5; the indicator can be used to measure the variables (Chin, in Ghozali and Fouad, 2005). While Hair (Hartono, 2009) suggests that the value of loading 0.30 can be considered meet the minimum level, 0.40 was considered better, and for loading values > 0.50 are considered practically significant. However, the higher the value the more important role loading factor, which is used for convergent validity is the outer loading > 0.7.
Reliability
ISSN: 2306-9007 Saparso (2017) 447
I
www.irmbrjournal.com June 2017I
nternationalR
eview ofM
anagement andB
usinessR
esearchVol. 6 Issue.2
R
M
B
R
than 0.7, although the value of 0.6 is acceptable, because it is a valid construct reliable, the opposite is not necessarily a reliable construct valid (Cooper and Schindler, 2006).
Analysis
This study aims to demonstrate and analyze the effect of exogenous variables on endogenous variables. The effect is very complex, where there are independent variables, the variables and the dependent variable. These variables are latent variables formed by several indicators (observed variables). Therefore, to analyze the data in this study used technical analysis of Structural Equation Modeling (SEM) using LISREL 8.8 program package. The use of SEM allows researchers to test the validity and reliability of research instrument, confirm the accuracy of the model and test the effect of one variable against another.
Analysis Results
Characteristics of Respondents
At this stage, an analysis of the characteristics of the respondents in this study is a customer or a life insurance policy holders in Jakarta. Every customer has different characteristics, it is caused by many factors that helped influence it. In this study the characteristics of the customers will be described in some of the characters based on gender, age, monthly family income, marital status, education level and occupation.
The number of samples in this study were 393 clients consisting of 52.02% male and 47.98% female; with age <29 as much as 14.02%; 30-39 years old 34.23%; 40-49 years of 34.77%; 16.17%; 50-59 years and> 60 years of 0.81%. Based on the income level of the respondents, 1.35% income less than Rp. 2.000.000, -, the income of Rp. 2,000,000 - Rp. 3,500,000, - amounting to 15.63%; Rp. 3,500,000 - Rp. 5.000.000, - sebeasar 29.39%; Rp. 5,000,000 - Rp. 6.500.000, - by 23.99% and the incomes of more than Rp. 6.500.000, - by 29.65%. This suggests that the Life Insurance customers young and productive with a pretty good level of income.
Based on the education level of respondents, only 2.16% of primary and junior education; 18.33% high school education; 21.02% educated D3; 49.33% and 9.16% educated educated S1 S2 / S3. Based on the work of civil servants respondent / Armed Forces of 43.67%; private employees 35.58%; and the other 20.75%. 50.40% based on the marital status of respondents had shared a house with more than one child; bachelors and 17.25% of the respondents were married with no children and a 32.35% lambing. Therefore, this research shows that customers are highly educated respondents, and is dominated by civil servants / military.
Description of Research Variables
ISSN: 2306-9007 Saparso (2017) 448
I
www.irmbrjournal.com June 2017I
nternationalR
eview ofM
anagement andB
usinessR
esearchVol. 6 Issue.2
R
M
B
R
Test Validity and Reliability
Validity test to see grains of decent questions (representative) is used to represent the free variables in this study. The test is performed using confirmatory factor analysis on each of the latent variables, namely economic content, resource content, social content, emotional content, trust, commitment and relationship satisfaction using LISREL8.8 program. What if the value of loding factor greater than 0.60, the indicator can be used to measure the variables (Chin, in Ghozali, 2005).
Validity is a measure that indicates that the measured variables actually to be studied (Cooper and Schindler in Zulganef, 2006). In determining whether or not a statement item that will be used, usually performed correlation coefficient significance test at the significance level of 0.60, meaning that an item is considered valid if the correlated significantly to the total score.
Other measuring instrument is reliability testing, reliability is an index that shows that measuring instruments used in research have reliability or trustworthy. As a measuring instrument should have the consistency of measurement results over time if the phenomenon being measured has not changed (in Zulganef Harrison, 2006). According to Sekaran (in Zulganef, 2006) states that an instrument had a reliability study indicated adequate if Cronbach alpha coefficient greater than or equal to 0.70. According Maholtra (in Solimun, 2002), reliability is a measure of the internal consistency of the indicators of a construct that indicates the degree to which each indicator variable identifies a formation or a common latent factor. Furthermore Maholtra explained that the research instrument has sufficient reliability when the value of the construct reliability (CR) of at least 0.60. While Hair et al., (Wijanto, 2008; 66) states that a construct has good reliability if the value cronstruct reliability (CR) values ≥ 0.70 and variance extracted (VE) ≥ 0.50.
Analysis of Structural Equation Model (SEM)
Having tested the validity and reliability of all latent variables are the results valid and reliable, the analysis can proceed with the conformity test model and test of significance causality.
Model Conformance Test (Goodness-of-fit test)
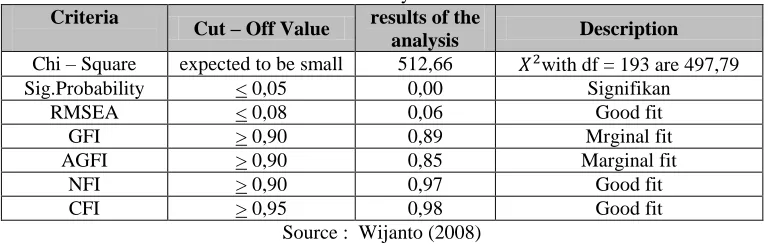
Testing the model on SEM aims to look at the suitability of the model. The results of testing the suitability of the model in this study is as in Table 2.
Table 2: Suitability Index SEM Criteria
Cut – Off Value results of the
analysis Description
Chi – Square expected to be small 512,66 with df = 193 are 497,79
Sig.Probability < 0,05 0,00 Signifikan
RMSEA < 0,08 0,06 Good fit
GFI > 0,90 0,89 Mrginal fit
AGFI > 0,90 0,85 Marginal fit
NFI > 0,90 0,97 Good fit
CFI > 0,95 0,98 Good fit
Source : Wijanto (2008)
ISSN: 2306-9007 Saparso (2017) 449
I
www.irmbrjournal.com June 2017I
nternationalR
eview ofM
anagement andB
usinessR
esearchVol. 6 Issue.2
R
M
B
R
statistical test that can explain the "power" model predictions. Test matches as well as the limits of the value that indicates the level of a good fit for each GOF that has been done in this study, as shown in Table 2.
Causality Test
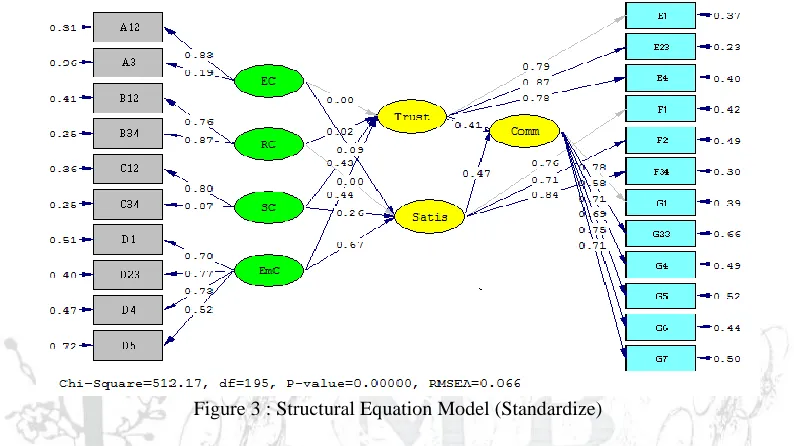
After testing the suitability of the research model, the next step is to test causal hypotheses developed in the research model. Full structural equation model of this study is shown in Figure 3 and Figure 4.
Figure 3 : Structural Equation Model (Standardize)
Figure 3 is a full model of the analysis of research which shows that the direction of the relationship between variables is jointly significant positive and p = 0.00, and the influence of exogenous and endogenous variables is quite large (Table 3 and Table 4), the model is quite fit (Table 2).
ISSN: 2306-9007 Saparso (2017) 450
I
www.irmbrjournal.com June 2017I
nternationalR
eview ofM
anagement andB
usinessR
esearchVol. 6 Issue.2
R
M
B
R
Discription:
EC = Economic Content
RC = Resource Content
SC = Social Content
EmC = Emotional Content
Trust = Trust
Satis = Satisfaction
Comm = Relationship Commitment
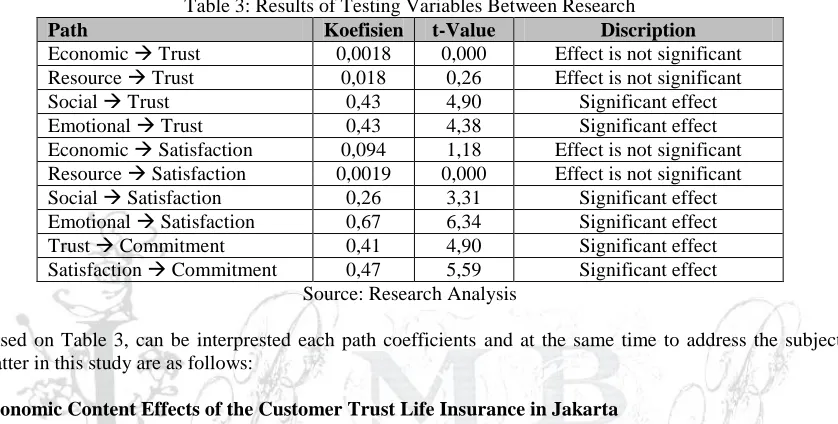
Table 3: Results of Testing Variables Between Research
Path Koefisien t-Value Discription
Economic Trust 0,0018 0,000 Effect is not significant
Resource Trust 0,018 0,26 Effect is not significant
Social Trust 0,43 4,90 Significant effect
Emotional Trust 0,43 4,38 Significant effect
Economic Satisfaction 0,094 1,18 Effect is not significant
Resource Satisfaction 0,0019 0,000 Effect is not significant
Social Satisfaction 0,26 3,31 Significant effect
Emotional Satisfaction 0,67 6,34 Significant effect
Trust Commitment 0,41 4,90 Significant effect
Satisfaction Commitment 0,47 5,59 Significant effect
Source: Research Analysis
Based on Table 3, can be interprested each path coefficients and at the same time to address the subject matter in this study are as follows:
Economic Content Effects of the Customer Trust Life Insurance in Jakarta
The results of the analysis using LISREL 8.8 program is presented in Table 3 shows that the effect is very weak economic content despite the positive direction but not significant to customer confidence. This is evident from the marked positive path coefficient of 0.0018 with a t-Value of 0.000, which means that the t-Values less than the value of the t-Table 1.96. Thus the research hypothesis which states that the economic effect on customer confidence in the content of life insurance in Jakarta is not proven. The small influences and lack of significance of variables economi content to trust, could be due to the homogeneity of the sample used (Hartono, 2012: 67 and Wijanto, 2008; 126).
In line with the above studies, a survey conducted by Ernst & Young (2012) found 67% of respondents (customer life insurance) in the Asia-Pacific also argues that the price is not the most important criteria for the choice of insurance products. As long as the insurance company may offer a strong brand image, consistent pelagang services in ways that are comfortable, even if the insurance company can do it all, the consumer is ready to pay a premium for its products.
Resource Content Effect of the Customer Trust Life Insurance in Jakarta
ISSN: 2306-9007 Saparso (2017) 451
I
www.irmbrjournal.com June 2017I
nternationalR
eview ofM
anagement andB
usinessR
esearchVol. 6 Issue.2
R
M
B
R
This means that if the customer assessment of the resource content aimed at them the better (higher), the higher the customer confidence in the insurance company. Ownership of resources that are important to customers will lead to customer trust to remain a customer of the insurance company. For example reputation of a company. According to Aaker and Keller (Lacey, 2003: 41) the reputation of the company (company reputation) is the customer's perception of quality associated with the name of the company. So the insurance company should be able to create a deep fascination in the minds of customers.
Social Content Influence of the Customers Trust Life Insurance in Jakarta
Table 3 shows that social content is positive and significant effect on customer confidence. This is evident from the marked positive path coefficient of 0.43 with Value of 4.90, which means the value of the t-Value is greater than the value of the t-Table 1.96. Thus social content significantly affect customer confidence. These results provide support for the third hypothesis in this study stated that the content of social influence on customer confidence in life insurance in Jakarta, proven.
Social content is a social relationship that is formed from the interaction between the service provider to the customer (Morgan, 2000; 489). Social content is expected to lead to conformity among the parties involved in a relationship. Therefore, companies need to continually improve the agency's ability to socialize, including the ability to communicate and how to treat customers. This ability is the ability to be possessed employees service providers to customers and prospective customers understand and obtain information about the benefits and use of the product.
Emotional Content Effects of the Customer Trust Life Insurance in Jakarta
Table 3 shows that the emotional content and a significant positive effect on customer confidence. This is evident from the marked positive path coefficient of 0.43 with t-Value of 4.38. These results provide support for the fourth hypothesis in this study stated that the emotional content effect on customer confidence in life insurance in Jakarta, proven. That is, if the emotional content is increased in the levels of specific units, hence resulting in increased customer confidence in the company significantly.
Emotional content is a relationship that formed the perception of customers (clients) with the company's products (Johnson et al., 2009: 31). Emotional content is expected to lead to conformity among the parties involved in a relationship. Conformity assessment lies in the words and actions of partners or potential partners during the interaction.
Economic Content Effects of the Customer Satisfaction Life Insurance in Jakarta
Table 3 shows that the economic content and no significant positive effect on satisfaction customers. This is evident from the marked positive path coefficient of 0.094 with a t-value of 1.18. Value smaller than the value of the t-Table 1.96. These results prove the upper fifth hypothesis in this study stated that the economic content affect the life insurance customer satisfaction in Jakarta, not proven.
ISSN: 2306-9007 Saparso (2017) 452
I
www.irmbrjournal.com June 2017I
nternationalR
eview ofM
anagement andB
usinessR
esearchVol. 6 Issue.2
R
M
B
R
Resource Content Influence of the Customer Satisfaction Life Insurance in Jakarta
Table 3 shows that the resource content and no significant positive effect on customer satisfaction. This is evident from the marked positive path coefficient of 0.0019 with a t-Value of 0.000 which is smaller than the value of the t-Table 1.96. These results prove the upper sixth hypothesis in this study stated that the resource content effect on customer satisfaction for life insurance in Jakarta, not proven.
These results are relevant to research conducted by Marketing Magazine (2010), about the level of customer satisfaction, which is represented by the resource content accessibility, its value is lower than the value of the industry average. While the research conducted by Ernst & Young (2012) found that the company's reputation (image and achievement) only contributes to the confidence of 26%. Low customer satisfaction established by the resource content, according to (Hart, 2007) due to insurance customers have high expectations of the brand, corporate image and service quality.
Social Content Influence of the Customer Satisfaction Life Insurance in Jakarta
Table 3 shows that social content is positive and significant effect on customer satisfaction. This is evident from the marked positive path coefficient of 0.26 with t-Value of 3.31. Thus social content significantly influence customer satisfaction. Because the value of the t-Value is greater than the value of the t-Table 1.96. These results provide support for the hypothesis seventh in this study which states that social content has positive influence on life insurance customer satisfaction in Jakarta, proven.
Duncan and Moriarti (Jasfar, 2001: 39) found that communication is the result of increased customer who survive and their value increases. Social content can be expected to have a positive influence on satisfaction. Due to the interaction between the customer and the agent / insurance company is at the core of the customer's perception of the quality of the company, and customers also want their social relationships in addition to functional benefits then there is a positive effect of social content to the client's satisfaction.
Emotional Content Effects of the Customer Satisfaction Life Insurance in Jakarta
Table 3 shows that the emotional content and a significant positive effect on customer satisfaction. This is evident from the marked positive path coefficient of 0.67 with t-Value of 6.34, which means the greater of the value of the t-Table 1.96. These results provide support for the hypothesis eighth in this study menyatakanbahwa emotional content that significantly influence the life insurance customer satisfaction in Jakarta proven true.
Satisfaction is formed because of the guarantee premium is definitely more profitable, better products and customers felt comfortable feeling. What employees say, how they say it, how their behavior, technological and physical resources, and how to inform employees something to the customer, it is believed because of the emotional attachment that has been attached to the customer's mind.
Customer Trust Effect of the Customer Commitment Life Insurance in Jakarta
Table 3 shows that customer confidence positive and significant effect on customer commitments. This is evident from the marked positive path coefficient of 0.41 with a t-Value of 4.90 which means that value is greater than t-Table value of 1.96. Thus a significant effect on customer confidence customer commitment. These results provide support for the hypothesis that the eleventh in this study stated that customer trust significantly influence commitment to life insurance customers in Jakarta, proven true.
ISSN: 2306-9007 Saparso (2017) 453
I
www.irmbrjournal.com June 2017I
nternationalR
eview ofM
anagement andB
usinessR
esearchVol. 6 Issue.2
R
M
B
R
form a very high value of trust for the parties involved. But the results of this study do not support the results of research conducted by Hennig-Thurau et al. (2002: 137) who found that customer trust has no effect on commitment. The results of the analysis of their data showed that the influence of trust on commitment occurs through indirect influence, trust affecting satisfaction and ultimately affect the commitment. Satisfaction helps explain the lack of significant relationships of trust.
The results of the study Garbarino and Johnson (1999: 79) found that kepecayaan significantly affect the commitment and positive. Due to commitments potentially volatile and requires sacrifice, it will cause people might not be committed unless trust has been built. They found that the customers who have a high orientation on relationships, trust is positively related to commitment to the organization.
Customer Satisfaction Influence Customer Commitment Life Insurance in Jakarta
Table 3 shows that satisfaction is positive and significant effect on customer commitments. This is evident from the marked positive path coefficient of 0.47 with a t-Value of 5.59 which means that Value is greater than the value of the t-Table 1,96. Thus satisfaction significantly influence the commitment of insurance clients in Jakarta. These results provide support for the hypothesis in this study are the twelve states that satisfaction significantly influence customer commitment proved to be life insurance. The results of this study empirically supports some of the results of research conducted by several researchers who examine the influence of satisfaction with the commitment that Boonajsevee (2005: 166), and Hennig-Thurau et al. (2002). The results of other studies that conflict with Boonajsevee and Hennig Thurau is Garbarino and Johnson (1999: 81) study conducted found that satisfaction does not affect the commitment. The results of research show that many customers are satisfied with the product or service still switch to another company that offers better and vice versa, many dissatisfied customers continue to buy products or services from the company.
Test Effect of Exogenous and Endogenous Variables Between
After testing the influence between variables, then the next step is to examine the effect of exogenous and endogenous between variables used in the research model. From the analysis using LISREL 8.8 program, koefien value of each path, the results are summarized in Table 4.
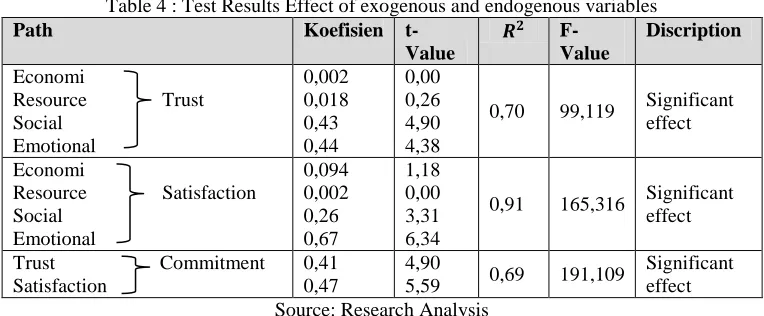
Table 4 : Test Results Effect of exogenous and endogenous variables
Path Koefisien
t-Value
F-Value
Discription
Economi
Resource Trust Social Emotional 0,002 0,018 0,43 0,44 0,00 0,26 4,90 4,38
0,70 99,119 Significant
effect
Economi
Resource Satisfaction Social Emotional 0,094 0,002 0,26 0,67 1,18 0,00 3,31 6,34
0,91 165,316 Significant
effect
Trust Commitment Satisfaction
0,41 0,47
4,90
5,59 0,69 191,109
Significant effect Source: Research Analysis
ISSN: 2306-9007 Saparso (2017) 454
I
www.irmbrjournal.com June 2017I
nternationalR
eview ofM
anagement andB
usinessR
esearchVol. 6 Issue.2
R
M
B
R
Economic content, resource content, social content and the emotional content together influence of the customer trust Life Insurance in Jakarta.
Based on Table 4 it can be explained that the economic content, resource content, social content and the emotional content, together with the effect on the trust value of determinant coefficient of R2 = 0.70, and F-Value 99.119 or a significant difference between the economic content , resource content, social content and the emotional content of a trust with a contribution of 70%. These results provide support for the fifth hypothesis in this study stated that the economic content, resource content, social content, emotional content affects the Life Insurance Customer trust in Jakarta, proven.
Lecey and Russell Wayne (2003: 48) in his research found that the economic content, resource content, and social content significant effect on trust. The economic value associated with the cost-benefit ratio that is felt every party involved in the relationship. Success in delivering economic value to customers can improve quality, reduce sacrifice. The company's reputation is the customer's perceived state of the past and the future prospects of the company and the quality of the product. Then Morgan (2000: 490) in his research found that trust is formed due to the interaction between the service provider to the customer.
Economic content, resource content, social content and the emotional content together effect of the Customer Satisfaction Life Insurance in Jakarta
Table 4 menunjukkank that jointly influence economic content, resource content, social content and the emotional content of the determinants of satisfaction with the value of R2 = 0.91 and F-Value 165.316 or a significant difference between the economic content, resource content, social content and the emotional content of the satisfaction accounted for 91%. These results provide support for the hypothesis that the tenth in this study stated that the economic content, resource content, social content, emotional content affects the Life Insurance Customer satisfaction in Jakarta, proven.
Zeithaml (2000: 71) says that the customer's satisfaction and dissatisfaction is the difference between expectations and perceived performance. Customer satisfaction can mean performance of the goods or services received by consumers at least equal to that expected. There are three basic approaches that could make the organization responsible for the quality of service that will lead to customer satisfaction, among others: (1) Provide a wide range of alternative options to the customer / service users of the products or services offered. (2) Combining service strategy with consequences that must be faced. This means that any strategy taken will affect the consequences to be borne by the company. (3) Ensuring quality of customer service by setting standards of service and creating a reward (reward) for workers or employees who are well able to serve with the applicable standards and punishment to those who serve the customer does not meet the standards.
The influence of trust and satisfaction of the Customer Relationship commitment Life Insurance in Jakarta
Table 4 shows that trust and satisfaction jointly affect the relationship commitment of R2 = 0.69 and F-Value 191.109 or there are significant jointly between the trust and the satisfaction of relationship commitment accounted for 69%. These results provide support for the hypothesis that the thirteenth in this study stated that trust and satisfaction are jointly significant effect on Life Insurance Customer commitment in Jakarta, proven.
ISSN: 2306-9007 Saparso (2017) 455
I
www.irmbrjournal.com June 2017I
nternationalR
eview ofM
anagement andB
usinessR
esearchVol. 6 Issue.2
R
M
B
R
Conclusions, Implications and Recommendations
Conclutions
Based on this analysis, it can be concluded successively hypothesis test results as follows:
1. Economic content proved an effect on customers trust, but the effect is not significant, so that the
economic rise of content does not give rise to the belief that significant (Table 3 and Figure 3; 4). 2. Resource content proved an effect on customers trust, but the effect is not significant, so the
increase in resource content does not give rise to the belief that significant (Table 3 and Figure 3; 4).
3. Social content proved a significant effect on customers trust, so that the increase in social content
will increase customer confidence in the life insurance in Jakarta (Table 3 and Figure 3; 4).
4. Emotional content proved a significant effect on customers trust, so that the increase in emotional
content will increase customer confidence in the life insurance in Jakarta (Table 3 and Figure 3; 4).
5. Economic content, resource content, social content and the emotional content proved jointly significant effect on customers trust, with the increase in economic content, resource content, social content and emotional content together can increase customer confidence Life Insurance in Jakarta (Table 4).
6. Economic content, proved an effect on customers satisfaction, but the effect is not significant, so
that the economic rise of content does not give rise to the belief that significant (Table 3 and Figure 3; 4).
7. Resource content proved an effect on customers satisfaction, but the effect is not significant, so the increase in resource content does not give rise to the belief that significant (Table 3 and Figure 3; 4).
8. Social content proved to have a significant effect on customers satisfaction, so that the increase in
social content can boost customer satisfaction (Table 3 and Figure 3; 4).
9. Emotional content proved to have a significant effect on customers satisfaction. So, with the increase in content emotiosional can increase customer satisfaction (Table 3 and Figurer 3; 4). 10. Economic content, resource content, social content and the emotional content proved jointly
significant effect on customers satisfaction, with the increase in economic content, resource content, social content and the emotional content together can improve customer satisfaction Life Insurance in Jakarta (Table 4).
11. Trust proved to have a significant effect on customer relationship commitment, so the increase in
confidence can increase customer commitment Insurance in Jakarta (Tables 3 and 3; 4).
12. Satisfaction proved to have a significant effect on customer relationship commitment, so the increase in satisfaction can increase customer commitment Insurance in Jakarta (Table 3 and Figure 3; 4).
13. Trust and satisfaction proved to be jointly significant effect on customer relationship commitment,
so the increase in confidence and satisfaction together can increase customer commitment Insurance in Jakarta (Table 4).
Managerial Implications
1. Based on the results of the analysis found that together economic content, resource content, social
ISSN: 2306-9007 Saparso (2017) 456
I
www.irmbrjournal.com June 2017I
nternationalR
eview ofM
anagement andB
usinessR
esearchVol. 6 Issue.2
R
M
B
R
on behalf of companies that are well known to be able to be realized with a quality product as expected. This will add to the belief that the customers' choice of insurance products to be correct. 2. Effect of economic content, resource content, social content and the emotional content together
positive and significant effect on satisfaction Life Insurance customers in Jakarta. However, the partial economic content and resource content influence is very small and not statistically proven. While social content and the emotional content and a significant positive effect. Therefore, to improve customer satisfaction, employee of the company (agent) must interact to communicate with customers in person so that the relationship of employees (agents) is getting closer to the customer. Customer satisfaction should also be directed to a sense of security, peace due to higher product quality continuously performed as expected by the customer.
3. Trust and satisfaction jointly influence on relationship commitment. The amount of influence this
relationship commitment, it is partially determined by satisfaction, where satisfaction is the most influential variable mainly through the indicator quality of care received, products, prices and information given. In this case the service is a major key to improving customer commitment, therefore, in addition to improving the quality of the products the company needs to continuously improve service quality. From the side it can be said that the business trust is a business trust services. This study found that a strong indicator of the formation of the trust lies in the credibility of the employees, which include the ability of employees in service and employees who have good morals and sincere in helping customers.
4. The study found that the relationship is due to the commitment of satisfaction with the quality of
products, prices, information, and services provided as well as the trust that was built by a reputable company through employee (agent) who is honest and trustworthy. Customer satisfaction can be realized driven by emotional ties because of the confidence of customers is quite well-known when the insurance company can provide the product quality as expected and raises customer confidence on product choice.
Recommendations
Based on the discussion of the results of research conducted, the obtained findings that inform what should be done by the company.
1. The economic benefits perceived by customers formed by two indicators of economic value and
switching cost, its value is quite high. The high value is not affecting trust and customer satisfaction. However, the value of benefits and costs to move to another insurance company is sufficient to protect customers another enterprising move.
2. Unique resources owned by a company formed by two indicators, namely the company's reputation
and its value is high enough confidance benefits. The high proficiency level does not affect the value of trust and customer satisfaction. But the good name, reputation or achievements of the company, disclosure of information and customer perceived sense of security must be maintained.
3. The relationship that forms the interaction between employees and customers formed by two
indicators, namely communication and familiarity value is quite high. Indicator-indicator gives a substantial contribution for the formation of trust and customer satisfaction. This means that the delivery of both formal and informal information, ease of access, the relationship and interaction between employees (agents) and the customer needs to be maintained and improved.
ISSN: 2306-9007 Saparso (2017) 457
I
www.irmbrjournal.com June 2017I
nternationalR
eview ofM
anagement andB
usinessR
esearchVol. 6 Issue.2
R
M
B
R
5. The perception of customers that the company has the integrity to reliable indicator that is formed by
three trustworthy employee, the employee's image and integrity of employees, have a high enough value. Indicator-indicator has a considerable contribution towards customer relationship commitment. Therefore, the performance and integrity of the employees need to be improved.
6. Customer satisfaction on an assessment of the quality of products, prices of products and services that
have received a high enough value. Indicator-indicator has a considerable contribution towards customer relationship commitment. Therefore it is necessary to improve the quality of products, more favorable premium
7. customers, and enhance better service.
8. Relationship commitment is shaped by emotional bound, a sense of belonging, are willing to provide
feedback and fear of losing the relationship, providing considerable value. Hence the need to build better relationships with customers so that customers feel emotionally close and create a sense of belonging and proud of his involvement. It will encourage customers willing to provide feedback and is willing to forgive when expectations are not met perfectly.
References
Abdul-Muhmin, Alhassan G.,(2005), Instrumental and Interpersonal Determinants of Relationship Satistiction and Commitment in Industrial Markets, “Journal of Business Research 58, pp.619-628. Adamson, Ivana, Kok-Mun Chan, and Donna Handford, (2003). “Relationship Marketing: Customer
Commitment and Trust as A Strategy for The Smaller Hongkong Corporate Banking Sector,”
International Journal of Bank Marketing, 21/6/7, pp. 347-358.
Akbar, Mohammad Muzahid., (2007), “Relationship Commitment of Prepaid and Post-Paid Subcribers of a Private Telecommunication Company in Bangladesh”, ABC Journal Vol. 27, No.3 (September-Desember), pp.29-39.
Anton, Carmen, Carmen Camarero, and Mirtha Carero, (2007). “Analysing Firm’s Failure as Determinants of Consumer Switching Intention,” EuropeanJournal of Marketing, Vol.41, No. 1/2, pp. 135-158. Andreassen, T.W., Olsen, L.L., (2008). The impact of customers’ perception of varying degrees of
customer service on commitment and perceived relative attractiveness. Managing Service Quality 18 (4), 309-328.
Azwar, S, (2003), Reliabilitas dan Validitas, Cetakan IV, Yogykarta, Pustaka Pelajar.
Bachrudin, Achmad., Harapan L. Tobing, (2003); Analisis Data Untuk Penelitian Survei Dengan Menggunakan Lisrel 8 Dilengkapi Contoh Kasus; Jurusan Statistika, MIFA-UNPAD, Bandung. Barnes, James G., (2003). Secrets of Customer Relationship Management, diterjemahkan oleh Andreas
Winardi, Yogyakarta : Penerbit Andi.
Brown, Stanley A., (2000). Customer Relationship Marketing: A Strategic Imperative in the World of e.Business, Canada: John Wiley & Sons Ltd.
Barry, J.M., Dion, P., Johnson, W., (2008). A cross-cultural examination of relationship strength in B2B services. Journal of Services Marketing 22 (2), 114-135.
Bendapudi, Neeli and Leonard L. Berry, (1997). “Customer’s Motivation for Maintaining Relationship with Service Providers”, Journal of Retailing, Vol. 73, pp.15-37.
Boonajsevee, Bhoomipan, (2005). “Relationship Marketing: Loyalty Intentions in New Era of Thai Bank Marketing”, Dissertation, The Wayne Huizenga Graduate School of Business and Entrepreneurship, Nova Southeastern University.
Burnham T.A., J.K. Frels, and V. Mahajan. (2003), “Consumer Switching Costs : A Typology, Antecedents, and Concequences. “Journal of The Academy of Marketing Science’, 31 (2), pp. 109-121.
Chan, Syafruddin, (2003). Relationship Marketing, Jakarta: PT Gramedia Pustaka Utama.
Central Intelligence Agency, Daftar Negara Asia Menurut PDB Nominal Per Kapita, 2 Oktober 2008. Donaldson, Bill dan Tom O’Toole, (2002). Strategic Market Relationship : From strategy to
ISSN: 2306-9007 Saparso (2017) 458
I
www.irmbrjournal.com June 2017I
nternationalR
eview ofM
anagement andB
usinessR
esearchVol. 6 Issue.2
R
M
B
R
Dagger, T.S., Sweeney, J.C. & Johnson, L.W., (2007)., A Hierarchical Model of Health Service Quality: Scale Development and Investigation of an Integrated Model. Journal of Service Research, 10(2), 123-142.
Dalziel, Nurdilek; Fion Harris, (2011); “A Multidimensional Typology of Customer Relationships From Faltering to Affective”, International Journal of Bank Marketing, Vol. 29 No. 5, pp. 398-432.
Dan Fuad, (2008). Structural Equation Modeling. Teori, Konsep dan Aplikasi, dengan Program Lisrel 8.8. Edisi II Semarang: Badan Penerbit Universitas Diponegoro.
Dan Fuad, (2005). Structural Equation Modeling. Teori, Konsep dan Aplikasi, Edisi I Semarang: Badan Penerbit Universitas Diponegoro.
DeWitt, T., Nguyen, D., Marshall, R., (2008), Exploring Customer Loyalty Following Service Recovery : The Mediating Effect of Trust and Emotions; Journal of Servive Research, 10(3), pp.269-281.
Donney, Patricia M. and Joseph P. Cannon, (1997). “An Examination of The Nature of Trust in Buyer-Seller Relationships,” Journal of Marketing, Vol. 61, No. 2, pp. 35-51
Economic Review, World Bank. No. 210, Januari 2007.
Engel, James F., David T. Kollat, and Roger D. Blackwell, (2001). Consumer Behavior, 8th Edition, New York: The Dryden Press.
Fatmah, (2005). “Pengaruh Persepsi Religiulitas, Kualitas Layanan dan Inovasi Produk terhadap kepercayaan dan Komitmen serta Loyalitas Nasabah Bank Umum Syariah di Jawa Timur, Disertasi, Surabaya: Program Pascasarjana Universitas Airlangga.
Fitzsimmons, J.A. & Fitzsimmons, M.J. (2006). Service Management. McGrow-Hill : New York.
Fullerton, Gordon, (2004). “The Srvice Quality-Loyalty Relationship in Retail Service: does Commitment Matter?”. Journal of Retaining and Consumer Service, 12, pp. 99-111.
Garbarino, Ellen and Mark S. Johnson, (1999). “The Different Roles of Satisfaction, Trust, and Commitment in Customer Relationships,” Journal of Marketing, Vol. 63, pp. 70-87.
Ghozali, Imam, (2008). Model Persamaan Struktural: Konsep dan Aplikasi, Semarang : Badan Penerbit Universitas Diponegoro.
Gilaninia, Shahram., Mousa Rezyani., Seyyed Javad Mousayian., (2011)., “The Effect of Relationship Marketing Dimensions by Customer Satisfaction to Customer Loyalty”., Australian Journal of Basic and Applied Sciences, 5(9): 1547-1553.
Gounaris, Spiros P., Vlassis Stathakopoulos, and Andreas D. Athanassopoulos, (2003). “Antecedents to Perceive Service Quality: an Exploratory Study in The Bank Industry, International Journal of Banking Industry, 21, 4?5, 168-190.
Gary S. Fields., (2005). “A welfare economic analysis of labor market policies in the Harris–Todaro model”, Journal of Development Economics 76, p. 127– 146
Global Consumer Insurance Survey; 2012; ERNST & YOUNG
Gwinner, Kevin P., Dwayne D. Gremier and Mary Jo Bitner, (1998). “Relational Benefits in Service Industries : The Cutomer’s Perspective”, Journal of The Academy of Marketing Service, Vol. 26 (Spring), pp. 101-114.
Gummesson, Evert, (2001). Total Relationship Marketing. London : Butterworth-Heinemann.
Gronroos, Christian, (1996). “Relationship Marketing Strategic and Tactical Implications,” Management Decision, 34 (3), pp. 36-44.
Haksever, Barry Render., Roberta S. Russel., Robert G. Murdick, (2000)., Service Management and Operations. New Jersey : Prentice Hall International Inc.
Hennig–Thurau, T., Kevin P. Gwinner and Dwayne D. Gremier, (2002). “Understanding Relationship Outcomes: An Integration of Relational
Hennig-Thurau, T. and U. Hansen, (2000). “Relationship Marketing: Some Reflections on the State-of-the-art of the Relational Concept.” In T.Henning-Thurau and U. Hansen (Eds). Relationship Marketing: Gaining Competitive Advantage through Customer Satisfaction and Customer Retention, Berlin: Springer-Verlag.
Hartono, Jogiyanto; (2012); Metodologi Penelitian Bisnis; Salah Kaprah dan Pengalaman-Pengalaman, edisi 5, BPFE Yograkarta.