http://www.sciencepublishinggroup.com/j/ajtas doi: 10.11648/j.ajtas.20190802.14
ISSN: 2326-8999 (Print); ISSN: 2326-9006 (Online)
Consistency Inference Property of QIC in Selecting the
True Working Correlation Structure for Generalized
Estimating Equations
Robert Nyamao Nyabwanga
*, Fredrick Onyango, Edgar Ouko Otumba
Department of Statistics and Actuarial Science, School of Mathematics, Statistics and Actuarial Science, Maseno University, Kisumu, Kenya
Email address:
*
Corresponding author
To cite this article:
Robert Nyamao Nyabwanga, Fredrick Onyango, Edgar Ouko Otumba. Consistency Inference Property of QIC in Selecting the True Working Correlation Structure for Generalized Estimating Equations. American Journal of Theoretical and Applied Statistics.
Vol. 8, No. 2, 2019, pp. 77-84. doi: 10.11648/j.ajtas.20190802.14
Received: May 30, 2019; Accepted: June 19, 2019; Published: June 29, 2019
Abstract:
The generalized estimating equations (GEE) is one of the statistical approaches for the analysis of longitudinal data with correlated response. A working correlation structure for the repeated measures of the outcome variable of a subject needs to be specified by this method and the GEE estimator for the regression parameter will be the most efficient if the working correlation matrix is correctly specified. Hence it is desirable to choose a working correlation matrix that is the closest to the underlying structure among a set of working correlation structures. The quasi-likelihood Information criteria (QIC) was proposed for the selection of the working correlation structure and the best subset of explanatory variables in GEE. However, its success rate in selecting the true correlation structure has been established to be about 29.4%. Likewise, past studies have shown that its bias increases with the number of parameters. By considering longitudinal data with binary response, we establish numerically through simulations the consistency property of QIC in selecting the true working correlation structure and the conditions for its consistency. Further, we propose a modified QIC that penalizes for the number of parameter estimates in the original QIC and numerically establish that the penalization enhances the consistency of QIC in selecting the true working correlation structure. The results indicate that QIC selects the true correlation structure with probability approaching one if only parsimonious structures are considered otherwise the selection rates are less than 50% regardless of the increase in the sample size, measurements per subject and level of correlation. Further, we established that the probability of selecting the true correlation structure R0 almost surely converges to one when we penalize for the number of correlation parametersestimated.
Keywords:
Generalized Estimating Equations, Quasi-Likelihood Information Criterion, Working Correlation Structure, Consistency, Model Selection1. Introduction
Liang and Zeger [4] proposed the Generalized Estimating Equations (GEE) to model both univariate longitudinal continuous and discrete outcomes by extending the quasi-likelihood method of Wedderburn [9] to correlated data. The quasi-likelihood is a methodology for regression that requires the specification of relationships between mean response and covariates and between mean response and variance.
In the GEE framework, model selection focuses more on
(m) for each subject is large, sandwich variance estimator is not appropriate [6]. Likewise, the asymptotic relative efficiency of the parameter estimates of the GEE method is likely to be low when the working correlation structure is misspecified hence lower relative efficiency [7, 8].
Pan [1] proposed a modification of AIC, called 'quasi-log-likelihood under the independence model information criterion' (QIC). The QIC was constructed by replacing the likelihood in the Kullback-Leibler information with the quasi-likelihood under the working independence assumption. The quasi-likelihood approach is natural in this setting because the quasi-likelihood estimating equations have the same form as the maximum likelihood estimating equations in the GLM-type models when the canonical link is used. While comparing QIC to AIC, [1] established the performance of QIC in selecting the working correlation structure in a marginal logistic regression under the true exchangeable correlation structure in which only independence exchangeable and AR-1 structures were considered were 67.8% and 72.1% for sample sizes of 50 and 100. Pan didn’t however establish any inference properties of QIC.
Barnett et al. [2] in their study on using information criteria to select the correct variance-covariance structure for longitudinal data in ecology compared the performance of AIC, DIC and QIC for multivariate Gaussian responses. They considered a relatively small sample size (n=30) and a relatively large cluster size (m=8). In their simulation, they included the unstructured correlation structure in the candidate models along with IN, AR-1 and EX, which was not considered [1]. Their simulation results showed that QIC did particularly poorly when the true covariance structure was independence or had a weak exchangeable (α = 0.2) or AR-1 (α = 0.3) structure with success rates of 0 to 14%. They asserted that QIC performance improved when the correlation was increased to moderate level. However, in their study [2] only considered a fixed number of subjects and measurements per subject hence could not numerically demonstrate the consistency property of QIC which the study sought to establish.
Shinpei [3], observed that Pan’s QIC was derived by ignoring the calculation of the correlation parameter and establish a formal derivation of the QIC (called formal QIC or fQIC) as an asymptotic unbiased estimate of the prediction risk based on the quasi-likelihood. Notably, when deriving the formal QIC, he explicitly took into account the effect of estimating the correlation matrix used in the GEE procedure and considered the adequacy of the risk function used in the derivation of the QIC. He observed that the original QIC is exactly and asymptotically equivalent to the formal QIC when the working correlation matrix is independence and includes the true correlation structure, respectively. In his comparison of the original QIC and formal QIC [3] established that the bias of the original QIC got larger when the number of the estimated parameters increased.
From the literature reviewed, most studies have primarily focused on establishing the success rates of QIC in selecting
the correct working correlation structure compared to other selection criteria such as Rotnitzky and Jewel Criteria (RJC), Correlation Information Criteria (CIC) etc. Establishing theoretically or numerically the consistency property or conditions for consistency of QIC in GEE has received little attention despite the importance of GEE in modeling longitudinal data. Hence the study sought to:
i. Establish numerically, the consistency inference property and the conditions for consistency of QIC in selecting the true working correlation structure
ii.Propose a modification to QIC to penalize for the number of parameter estimates in GEE and establish whether the proposed penalization improves the consistency of QIC
2. Methods
2.1. Quasi-Likelihood Estimation in Generalized Estimating Equations
Consider independent observations from n subjects and for each subject i ( = 1, 2 … ), m observations are made. Let
yi= [ 1, … , ] denote tth response (t=1…m) of the subject such that = , = and
μi = [ 1… . 2] where [. ] denotes the transpose. Further let denote the measurement for the ℎ covariate,
= 1 … corresponding to the ℎsubject at time t. In this case
0 1 1
( it) it it .... p pit
g µ =η =β +β x + +β x (1)
Wederburn [9] introduced the quasi-likelihood for the estimator !
"
denoted by Q(yi, ) and given as:(y , )
( )
i
i
i i
i i i
i y
y
Q d
V
µ τ
µ
µ
µ
µ
−=
∫
(2)Or equivalently
(
)
( )
, i i i
i
i y i
i y
d
d v
y
dQ
µ
µµ µ
τµ
µ
− =
∫
i
i
(3)
Where, μ#is a function of the unknown parameters β and the link function g(.) defines the relationship between ηiand
μi.
Definition 1.1: Suppose that we have independent observation Yi (i=1,2,...,n) with E Y( )i =µi and
( )
(Y )i i
Var =φ µv , where v is some known function. Also, suppose for each observation, µi =E Y( )i is some known function of a set of parameters β1...βp such that
( i) i
( )
n(
( )
)
1(
)
ii 1
u β Dτ vi µ − Yi µi 0
=
=
∑
− = (4)Where & ='( )
'*+,, = 1,2, … and - is the working
variance of y which is a diagonal matrix v / … v 0 Definition 1.2: Suppose that we have independent observation Yi = 1,2, . . . , for n subjects and for each subject i, m observations are made such that Yit is the ℎ response ( = 1, … , ) and Xit =
{
Xit1,...Xitp}
τ denote a× 1 vector of covariates associated with Yit then to apply quasi-likelihood to the analysis of such correlated data, we specify the mean of Yit, the variance function [var(Yit)] and
some working assumption about the response’s correlation matrix. If we let Ri α be the m × m working correlation matrix for yi which is assumed to be fully characterized by
the unknown parameter α [10].
Following the quasi-likelihood approach, we can define the working correlation matrix for as:
( )
0.5 0.5
i i i i
V =A R α A (5)
Where, 5is an m× diagonal matrix with 6 as the tth diagonal element i.e. 5 = & 6
7 (
1)
…8
and9 : is the working correlation matrix structure which describes the within-subject correlation which is of size
× and depends on a vector of association parameter denoted by : [10].
According to [7], some of the working correlation matrices that can be used include the Independence in which
;< ( =, >) = 0, ∀ ≠ B e.g. if m=3, 9CD =
E1 0 00 1 0
0 0 1F ; Exchangeable in which ;< ( =, >) = :, ∀ ≠ B H. 6. if m=3, 9IJ= E1 : :: 1 :
: : 1F ; Toeplitz
structure in which;< ( =, ,=K>) = :>, ∀ = 1,2. . − B,
e.g. if m=3, 9MNOP= E
1 :/ :Q
:/ 1 :/
:Q :Q 1
F ; Unstructured
correlation matrix in which ;< ( =, >) = :=>, ∀ > B
e.g. if m=3, 9SD = E
1 :/ :Q
:/ 1 :T
:Q :T 1
F and the First-order
auto-regressive working correlation structure in which
;< ( =, >) = :=U>, ∀ > B e.g. if m=3, 9VW=
E1 : :
Q
: 1 : :Q : 1F
The combination of equations 4 and 5 are called generalized estimating equations defined by:
( )
n 1(
)
i i i
i 1
U β D Vτi − Y ? µ 0
=
=
∑
− = (6)Where & =XYX*Z and = [ /… []
Equation 6 reduces to the quasi-likelihood equation 4 when = 1 for all i. According to Liang and Zeger [4], !\ are robust to the choice of working correlation matrix but choosing the working correlation structure close to the true one increases the efficiency of !\.
Pan [1] proposed a modification of AIC, called 'quasi-log-likelihood under the independence model information criterion' (QIC) for model selection in GEE. QIC was constructed by replacing the likelihood in the Kullback-Leibler information with the quasi-likelihood under the working independence assumption which is given as:
( )
( )
( )
IQIC R = −2Q(β R ; I;ˆ ℘})+2trace Ωˆ Vˆr (7)
Where Ω^= Σ`U/a ^is the model-based variance estimator under the independence working correlation structure for β` that can be estimated by
n 1
I i i
i 1
Ωˆ D V Dτi −
=
=
∑
(8)Vcd=Σce f is the sandwich variance estimator under the
working correlation structure R which can be estimated by;
{
}
(
( )
)
{
}
n 1 1
1 1
r i i i i
i 1 ˆ
V D V Dτi − − cov U β D V Dτi − −
=
=
∑
(9)Where ! values in D and V are all evaluated at !\ 9 . Remark 1: QIC (R) can be decomposed into two parts: i. −2Q(β R ; ?I;ˆ
( )
℘}) (R); I; }) which denotes the sum ofquasi-log-likelihood for the ∑0h/ observations in the data set and relates to the quasi-log-likelihood for independent observations, and hence does not contain information about the hypothesized within-subject correlation structure i
ii. 2trace Ω ˆ
( )
ˆIVr which contains information on the hypothesized correlation structure via ˆVr.2.2. Consistency Property of QIC in Selecting the True Correlation Structure
To formally state this property, we let W be the set of working correlation structures (R). We assume that W involves one true correlation structure (R0). Let R* be the
working correlation structure selected by QIC. We divide W into two: the over-parameterized set W+ and under-specified set W- such that:
iK= j9 ∈ i|∃: ∈ n, o. 9 : = 9 pq
iU= i\WK.
∀9 ∈ iK , we assume there exists : ∈ np such
that9 : = 9p, where np is in the interior of B. Theorem 3.1:
Suppose that the mean structure is correctly specified and that;
C1: ∀9 ∈ i, √ (!\ − !) = uP C2: ℎ v is continuously differentiable
C3: ∀9 ∈ iK , √ :" − : = uP and R(.) is a differentiable function at :, where : satisfies 9 : = 9p.
Then;
lim0→yz j9∗= 9pq = 1 (10)
Proof:
The probability of true correlation structure can be divided into two parts as:
| j9∗= 9pq = 1 − z j9∗≠ 9pq (11)
{
}
{ }0
* \
1
R W R
Pr R R
∈
= −
∑
= (12){
}
{ }0
{
}
* *
\
1
R W R R W
Pr R R Pr R R
+ −
∈ ∈
= −
∑
= −∑
=(13)
If lim0→yPr 9∗= 9 = 0, ∀ 9 ∈ iK\j9pq and
lim0→yPr 9∗= 9 = 0, ∀ 9 ∈ iU, then
* 0
lim Pr( )=1
n→∞ R =R (14)
This implies that the probability of selecting the true correlation structure9p almost surely converges to one. In this regard the selection criteria will be regarded as strongly consistent.
Corrolary 1
If
{
}
{ }0
* \
lim 0
n
R W R
Pr R R
→∞ ∈
∑
= → , then;* 0
lim Pr( ) 1
n→∞ R =R → (15)
This implies that the probability of selecting the true correlation structure 9pconverges in probability to one but does not necessarily reach one. In this regard the selection criteria will be regarded to be weakly consistent.
Corollary 2
If
{
}
{ }0
* \
lim 1
n
R W R
Pr R R
→∞ ∈
= →
∑
, then;* 0
lim Pr( ) 0
n→∞ R =R → (16)
This implies that the probability of selecting the true correlation structure9pconverges to zero hence the selection criteria will be regarded not to be consistent.
3. Simulation Study of the Consistency
Inference Property of QIC
3.1. Simulation Design
i. The response vector = /… was assumed to be a Bernoulli response. = 1, … , where n is the total number of subjects. In the simulation study, =
20, 30, 50, 100, 200 , = 1,2, . . . where m is the number of measurements per subject (3, 6).
ii.For each subject i, its covariates are / and
Q . / ∽ ‚ 0, 1 and Q ∽ Bernoulli (0.5) and a
within subject correlation structure dictated by 9 : . iii.The True correlation structures 9p : considered in the
simulation were Exchangeable (: = 0.2, 0.5) and AR-1 (: = 0.2, 0,5)
iv.The binary response Yit has the conditional expectation = ƒ |„/ , „Q . is connected with the
covariates through:
( )
it 0 1 1it 2 2itlogit µ =β +β x +β x +ε (17)
where i=1..n and t=1…m and !p= −!/= −!Q= 0.25. We adopted values assumed in [1] to facilitate comparison of results
v. We considered the working correlation structures
9 : independence(IN), exchangeable(EX), unstructured(UN) and first order autoregressive(AR1). All the correlation matrices were assumed to be positive definitive. We consider two sets of working correlation structures: …/= j†‚, , 591, ‡‚q, a set that includes both parsimonious and over=parameterized structures and …Q= j†‚, , 591q a set of only parsimonious structures
vi.The Simulation design is factorial with 1000 simulation replications. We evaluated the performance of QIC in the selection of the correct correlation structure using the number of times the correct correlation structure is selected in the 1000 simulation runs
vii. All simulations are performed using R version 3.5.1. Data analysis was done based on the gee, geepack and MASS R packages. Correlated binary data were generated using the bindata R package [11].
3.2. Simulation Results on the Consistency of QIC in Selecting Working Correlation Structure When R0 =
AR-1
Table 1. Frequency of Selection of true correlation structure: R0=AR-1.
n ˆ‰= jŠ‹, Œ•, Ž•, •‹q ˆ‘ jŠ‹, Œ•, Ž•q
3 6 3 6
AR(0.2)
20 207 266 417 534
30 244 272 464 537
50 294 318 467 613
100 306 324 577 707
200 333 347 650 750
AR(0.5)
20 219 263 523 654
30 253 273 607 740
50 309 320 660 800
100 321 355 707 813
200 339 377 723 820
The simulation results indicate that when R0 is AR-1,
α=0.2 and m=3 and the set of correlation structures considered is ω/ jIN, EX, AR, UNq, the success rates of QIC
were 20.7%, 24.4%, 29.4%, 30.6% and 33.3% for the respective samples of 20,30,50,100 and 200. On the other hand when the set of correlation structure considered is ωQ jIN, EX, ARq, the success rates of QIC are 41.7%,
46.4%, 46.7% 57.7% and 65%. When the number of measurements per subject are increased to 6, the success rates of QIC are for ω/ are 26.6%, 27.2%, 31.8%, 32.4% and
34.7% for the respective samples of 20,30,50,100 and 200. On the other hand the success rates of QIC for ωQ were
53.4%, 53.7%, 61.3%, 70.7% and 75% respectively.
When α=0.5 and m=3 and the set of correlation structures considered is ω/ jIN, EX, AR, UNq, the success rates of QIC
were 21.9%, 25.3%, 30.9%, 32.1% and 33.9% for the respective samples of 20,30,50,100 and 200. On the other hand when the set of correlation structure considered is ωQ jIN, EX, ARq, the success rates of QIC are 52.3%,
60.7%, 66.0% 70.7% and 72.3%. When the number of measurements per subject are increased to 6, the success rates of QIC for ω/ are 26.3%, 27.3%, 32.0%, 35.5% and 37.7%
for the respective samples of 20,30,50,100 and 200. On the other hand the success rates of QIC for ωQ were 65.4%,
74.0%, 80.0%, 81.3% and 82% respectively.
The results indicate that increasing the number of measurements per subject and the level of within subject correlation increases the success rate of QIC marginally when the over-parameterized unstructured structure is included. However, the exclusion of over-parameterized unstructured correlation structure (ω/) greatly improves the
chances of QIC to select the true structure. For each simulation setting, the success rates of QIC in selecting the true AR-1 structure for ωQ is approximately twice the success
rate of QIC in selecting the true AR-1 structure for ω/. The
results obtained for ωQ, were similar to results obtained by
Gosho [13] who established success rates of between 32.1% and 72% indicating that the probability of QIC selecting the true AR-1 correlation approached one as x ∞ if only parsimonious structures are considered. The study results are illustrated in Figure 1.
Figure 1. Success rates of QIC in Selecting the true AR1 structure.
From the figure 1 above, it is noticeable that when the level of correlation is increased to 0.5, the selection rates of QIC approach 40% as n approaches 200 for ω/, but
approaches 80% when only parsimonious structures ωQ are
considered. This implies that consistency will be achieved if only parsimonious structures are considered.
3.3. Simulation Results on the Consistency of QIC in Selecting Working Correlation Structure When R0 =
EX
In this section, we compare the performance of QIC in selecting the true exchangeable working correlation structure. The number of times QIC selects the true exchangeable correlation structure out of the 1000simulation runs are presented in table 2.
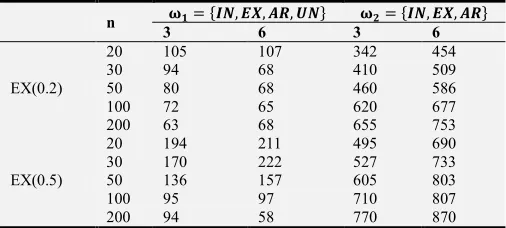
Table 2. Frequency of Selection of true correlation structure: R0=EX.
n ˆ‰ jŠ‹, Œ•, Ž•, •‹q ˆ‘ jŠ‹, Œ•, Ž•q
3 6 3 6
EX(0.2)
20 105 107 342 454
30 94 68 410 509
50 80 68 460 586
100 72 65 620 677
200 63 68 655 753
EX(0.5)
20 194 211 495 690
30 170 222 527 733
50 136 157 605 803
100 95 97 710 807
200 94 58 770 870
When R0 is EX (0.2) and m=3 and the set of correlation
structures considered is ω/ jIN, EX, AR, UNq, the success
rates of QIC were 10.5%, 9.4%, 8.0%, 7.2% and 6.3% for the respective samples of 20,30,50,100 and 200. On the other hand when the set of correlation structure considered is ωQ jIN, EX, ARq, the success rates of QIC are 34.2%,
41.0%, 46.0% 62.0% and 65.5%. When m= 6, the success rates of QIC are for Wc1 are 10.7%, 6.8%, 6.8%, 6.5% and 6.8% for the respective samples of 20,30,50,100 and 200. On the other hand the success rates of QIC for Wc2 were 45.4%, 50.9%, 58.6% 67.7% and 75.3% respectively.
structures considered is ω/= jIN, EX, AR, UNq, the success rates of QIC were 19.4%, 17.0%, 13.6%, 9.5% and 9.4% for the respective samples of 20,30,50,100 and 200. when the set of correlation structure considered is ωQ jIN, EX, ARq, the success rates of QIC are 49.5%, 52.7%, 60.5% 71.0% and 77.0%. When m=6, the success rates of QIC for ω/ are 21.1%, 22.2%, 15.7%, 9.8% and 5.8% for the respective samples of 20,30,50,100 and 200. On the other hand the success rates of QIC for ωQ were 69.0%, 73.3%, 80.3%, 80.7% and 87% respectively. QIC selection rates established for the set ω/ in the study are similar to those of Jang [13] who established QIC's performance to be in the range of 0%to 20% and tended to decrease as n increased, those [2] who established correct identification rates of 25-30% for moderately correlated exchangeable structure and the results [14] who established success rates of less than 50% for all combinations of m and :. The study[13] asserted that the performance was due to the estimation of the over-parameterized structure which becomes more precise as n increases hence increasing the likelihood of the unstructured matrix to be chosen. QIC selection rates established for ωQ are similar to results [1, 13] who both established success rates of up to 72% for : 0.5 and m=3 and 4 respectively. However the increase in performance of QIC with increase in in m and : established in the study is dissimilar to results [13] whose indicated that simultaneously increasing m to 8 and : to 0.5 resulted to a slight decrease in the selection rates. The results are further presented in figure 2.
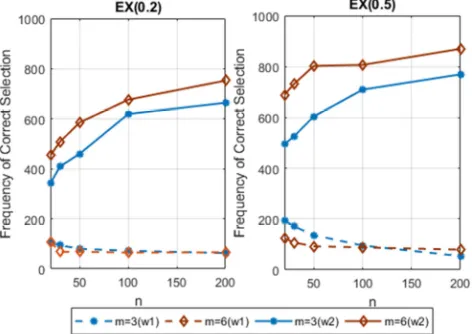
Figure 2. Success rates of QIC in Selecting the true EX structure.
From the figure 1 above, it is established the inclusion of the over-parameterized structure reduces the chances of QIC selecting the exchangeable structure while its exclusion significantly improves the performance of QIC in selecting the true exchangeable structure. In this case, the consistency of QIC will be guaranteed if only parsimonious structures are considered.
Proposition 1
Let ω/ jIN, EX, AR, UNq and ωQ jIN, EX, ARq be sets
of working correlation structures considered for selection by QIC. Further, Let R0 be the true correlation structure such
that Rpž ω/ < ωQ and 9{ be the correlation structure finally
selected by QIC.
a. If ω/ is the set of possible correlation structures
considered such that 9pž ω/, then z 9{ Rp Ÿ
1 as x ∞. In this case we say that QIC is not Consistent in selecting the true working correlation structure.
b. If ωQ is the set of possible correlation structures
considered such that 9pž ωQ, then z 9{ 9p x
1 as x ∞ hence QIC is consistent in selecting the true correlation structure.
c. Inclusion of over-parameterized structures such as the unstructured in the set of correlation structure considered for selection significantly reduces the z 9{ R
p . On the other hand, considering only the
parsimonious structures significantly improves z 9{ Rp i.e. if q is the number of correlation
parameters estimated and 9pk j†‚, , 591q, then as x 0.5 L 1 , z 9{ 9p ¡
∑W k ¢\jW£qz j9{ 9q
4. Proposed Modification of QIC to
Penalize for the Number of
Parameters Estimated
From Proposition 1, having Wc1 jIN, EX, AR, UNq as the set of possible correlation matrices impedes the performance of QIC in selecting the 9p; 9p jIN, EX, ARq. We propose a
modification to QIC method so as to allow for the penalization for the over-parameterized structures since the penalty term of QIC does not penalize for over-parameterization. The proposed modified QIC is built on the current QIC as it still uses the calculated quasi-likelihood measure but only incorporates the number of parameters in the model denoted by θ which consists of the correlation parameters (q) and the number of regression parameters (p). The goal of the modification is to find a parsimonious structure that effectively penalizes the working correlation structure with many parameters when the sample size is small or the responses are measured on many occasions and should also be able to penalize the working correlation structure which is parsimonious, but has a worse-fit. Therefore, the number of repeated measurements (m), the number of regression parameters (p) and the number of correlation parameters (q) are considered. As m increases, the value of q for over-parameterized structures such as Toeplitz and unstructured correlation structures increases.
Since the dimension of the covariance matrices is a function of p (the number of regression parameters), we propose a penalization of the second term of QIC for the number of regression parameters by multiplying it by 2p as proposed by Deroche (2015) in her proposed modification of QIC. This yields a modified penalty term:
( )
ˆ ˆ 2 4( )
Ω ˆˆ9=has the corresponding [¤¥= „7 =¦ = 1 … 8. We
establish a penalization factor by dividing q for each candidate model by [¤¥ and then multiply the resultant factor to trace(ΩcC`§) to get the second penalty term:
( )
(
2)
( )
Ωˆ ˆ Ωˆ ˆ
1
I r R r
max
q q
trace V trace V
q =m m− (19)
since q«¬-= 0.5m m − 1
The proposed modified QIC which we denote by QICm is
therefore the sum of the goodness-of-fit term and the two proposed penalty terms and is given as:
( )
(
)
( )
(2 )(
)
2 ˆ ; , 4 Ω ˆ
1
ˆ ˆ Ω ˆ
R
m I r r
q
QIC Q R I ptrace V trace V
m m β
= ℘ + +
− (20)
Where 1
1 Ωˆ
n
R i i i
i
D Vτ −D =
=
∑
and 11 Ωˆ
n
I i i i
i
D A Dτ − =
=
∑
4.1. Simulation Study to Compare Performance of QICm
and QIC
We conduct a simple simulation study to examine the performance of the proposed ®†;[compared to the original QIC in selecting the true working correlation structure. Specifically, we adopt the same model considered in Pan [1] to allow for the comparison of results.
1 2 2 3
log (it
µ
ij)=β β
+ xij +β
(t−1) (21)where = (ƒ ), = 1 … . , = 1 … 3 ' 2~nH <°±± 0.5
In the simulation we considered the candidate correlation structures: Independence, Exchangeable, AR and the Toeplitz structures. Both the Exchangeable and AR matrices were parameterized with : = 0.5 when they are the true correlation structures while the toeplitz structure wasparameterized with the parameters (0.5, 0.35). We considered the sample sizes of 20, 30, 50, 100 and 200 while the number of measurements per subject were fixed at 3. The R-packages MASS, GEE, geepack, MESS. Binary data were generated using the bindata package proposed [11].
4.2. Simulation Results
The simulation results are shown in table 3
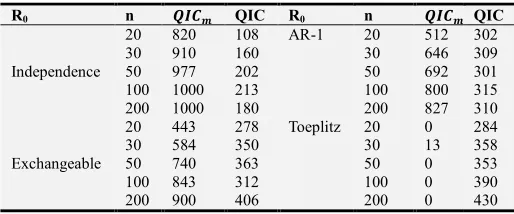
Table 3. Simulation results for the Comparison of QICm and QIC.
R0 n ²Š³´ QIC R0 n ²Š³´ QIC
Independence
20 820 108 AR-1 20 512 302
30 910 160 30 646 309
50 977 202 50 692 301
100 1000 213 100 800 315
200 1000 180 200 827 310
Exchangeable
20 443 278 Toeplitz 20 0 284
30 584 350 30 13 358
50 740 363 50 0 353
100 843 312 100 0 390
200 900 406 200 0 430
The simulation results as shown in table 3 indicate that
when 9p∈ †‚, , 591 , ®†;[ almost surely selects the true structure with a probability approaching one as indicated by proportions of 100% for independence, 83% for AR-1 and 90% for exchangeable when n=200. On the other hand, the original QIC selects the correct structure less than 22% of the time for independence, 40% for exchangeable and 32% for AR1. ®†;[ does not select the toeplitz structure completely whereas QIC selects the structure with higher rates compared to the other structures. The results imply that when9p∈
j†‚, , 59 − 1q, z 9∗ = 9p → 1 as ‚ → ∞ for QICm
while z 9∗ = 9p ↛ 1 as ‚ → ∞ for QIC and hence QICm
is consistent whereas QIC is not. When 9p= jµ<H q,
z 9∗ = 9p → 0 as ‚ → ∞ for QIC
m while z 9∗ = 9p → 1 as ‚ → ∞ for QIC
Proposition 2
Let ω/= jIN, EX, AR, UNq be set of working correlation
structures considered for selection by ®†;[. Further, Let Rp
be the true correlation structure such that Rp⊂ ω/and 9∗ be
the correlation structure finally selected by ®†;[. Then
based on the numerical results
lim
0→yz (9∗= Rp) → 1, ∀ Rp∈ jIN, EX, ARq
and
lim
0→yz (9 ∗ = 9
p) = 0, ∀ Rp∈ jToepq
5. Conclusions
In the study we investigated the consistency property of QIC in selecting the true correlation structure. Through simulation studies we established that QIC is not consistent in selecting the true correlation structure when over-parameterized structures such as the unstructured and toeplitz structures are included in the set of possible choices. In this case QIC selects the over-parameterized structures more often than it selects the true structure. We established that the consistency of QIC in selecting the true correlation structure can only be guaranteed if only parsimonious structures are considered. Inability of QIC to select the parsimonious correlation structures in favour of the over-parameterized correlation structures can be attributed to its inability to penalize for the number of correlation parameters estimated. We proposed QICm as a
modification of QIC to allow for the penalization of the number of GEE parameter estimates and through simulation we showed that ®†;[ was strongly consistent in selecting the
true working correlation structure and effectively penalized the working correlation structure with many parameters and also penalized the working correlation structure which was parsimonious, but has a worse fit. Based on the study results, we conclude that QIC can only be consistent in selecting the true correlation structure if we consider a set of parsimonious correlation structures only or by penalizing for the number of parameters estimated.
Acknowledgements
support the study. We also thank Prof. Kepher Makambi of Georgetown University, USA for providing useful insights on model selection in generalized estimating equations which were very helpful in the development of the research results.
References
[1] Pan, W. (2001). Akaike Information Criteria in generalized estimating equations. Biometrics, 57, 120-125.
[2] Barnett, G., Koper, N. Annette J. D., Schmiegelow, V. and Manseau, M. (2010). Using information criteria to select the correct variance -covariance structure for longitudinal data in ecology. Methods in Ecology and Evolution 2010, 1, 15-24.
[3] Shinpei, I. (2007). On properties of QIC in generalized estimating equations. Graduate school of Engineering Science, Osaka University, Japan.
[4] Liang, K., Y. and Zeger, S., L. (1986). Longitudinal data analysis using generalized linear models. Biometrika 73: 13-22.
[5] Shibata, R. (1981). Approximate efficiency of a selection procedure for the number of regression variables. Biometrika. 71, 43-49.
[6] Fitzmaurice GM, Laird NM and Ware JH (2004). Applied longitudinal analysis. NJ: John Wiley and Sons.
[7] Wang YG and Carey VJ (2003). Working correlation structure
misspecification, estimation and covariate design: Implications for generalized estimating equations performance. Biometrika 90, 29-41.
[8] Sutradhar BC and Das K.(2000). On the accuracy of efficiency of estimating equations approach. Biometrics 56 (2), 622-625.
[9] Wedderburn, R., W., M. (1974). Quasi-Likelihood Functions, Generalized Linear Models and the Gauss-Newton method.
Biometrika, 61, 439-447.
[10] Carey, V., J. and Wang, Y., G. (2011). Working Covariance model selection for GEE. Journal of Statistics and Medicine, Vol. 70, No. 26, 3117-3124.
[11] LeischandWeingessel A. (2005). Bindata: Generation of artificial binary data, 2005. R package version 0.9-12. [12] Jang, M., J. (2011). Working correlation selection in
generalized estimating equations. PhD (Doctor of Philosophy) thesis, University of Iowa. Retieved from https://doi.org/10.17077/etd.kj4igo6k
[13] Gosho, M., Hamada, C. and Yoshimura, I. (2011). Modifications of QIC and CIC for Selecting a Working Correlation Structure in Generalized Estimating Equations Method. Japanese Journal of Biometrics, Vol. 32, NO.1, 1-12.