4627 *Corresponding author email: [email protected]
USING MOLECULAR ELECTROSTATIC POTENTIALS AND FRONTIER ORBITALS FOR THE
SURFACE-ENHANCED RAMAN INTERPRETATION OF FLUOXETINE
GUILLERMO DIAZ FLEMING
a*, URSULA MARTÍNEZ ORTIZ
a, FREDDY ZAPATA LEON
aAND RAINER KOCH
baMolecular and Atomic Spectroscopy Laboratory (CESPAM), Department of Chemistry, Faculty of Sciences, University of Playa Ancha,
Casilla 34-V, Valparaiso, Chile.
bInstitute of Chemistry and Center of Interface Science, University of Oldenburg, P.O. Box 2503, D-26111 Oldenburg, Germany.
ABSTRACT
Raman and surface-enhanced Raman (SERS) spectra of (N-methyl-3-phenyl-3-[4-(trifluoromethyl)phenoxy)propane-1-amine hydrochloride, fluoxetine, have been recorded. Density functional theory with the B3LYP functional was used for optimization of the ground state geometry, calculation of the Raman normal modes of this molecule and the modelling of the SERS effect. Calculated geometrical parameters of fluoxetine fit well with the experimental ones. Based on the recorded data, the DFT results and a normal coordinate analysis based on a scaled quantum mechanical (SQM) force field approach, a complete vibrational assignment of fluoxetine as well as its adsorption behavior on a silver surface (using SERS selection rules) is derived.
Keywords: Fluoxetine, Raman, SERS, DFT calculations, Normal coordinate analysis, SQM force field.
INTRODUCTION
Since the finding of fluoxetine (N-methyl-3-phenyl-3-[4-(trifluoromethyl)phenoxy]propane-1-amine) in 1973, this serotonin-reuptake inhibitor drug introduced a novel stage for a reliable medication of depression, therefore, it has been extensively studied from a physiological and clinical point of view.1,2 Further, analytical procedures have been recently reviewed by Persona et al.3.
Beside these techniques, infrared and Raman spectroscopy have become very important in the identification and characterization of pharmaceutical products because these methods greatly avoid changes in the compounds.4 In this sense, Yellamula et al.5 recorded the IR spectrum of fluoxetine and presented a partial assignment of normal modes, while Garrido et al. performed a Raman study for this drug, including an approximate description of the distinct normal modes for protonated fluoxetine and N-deuterated protonated fluoxetine.6 An additional Raman study was reported by Menaa et al. 7.
The intrinsic weakness which hampers the Raman analysis at low concentration can be upgraded through the surface-enhanced Raman scattering (SERS) effect.8 Prior to the SERS analysis, vibrational studies are usually complemented with theoretical methods to obtain the spatial configuration of the molecule, such as Density Functional Theory (DFT) which, by inclusion of dynamic electron correlation,9 supplies a suitable and cost-effective approach to compute vibrational spectra of large molecules. There are numerous examples in the literature in which the target molecule is attached to a cluster of metal atoms and the changes in the computed Raman spectra are discussed.10-16 The size of these clusters varies between a single atom and 20 atoms,17-19 with an alternative approach (periodic boundary conditions) getting some attention.20 Common to many studies is the use of B3LYP as a standard functional and relatively small double-zeta basis sets.21,22
However, there are systematic overestimations of the quantum mechanically calculated harmonic wave numbers, arising from factors such as neglecting anharmonicity characters of the normal modes, basis set super position error and truncation effect as well as the deficiencies of the calculation method used itself. These deficiencies can be largely corrected by using the scaled quantum mechanical force field (SQM FF) method for the prediction of the vibrational spectra.23 This protocol has proven its reliability on several occasions.24-26
It is the aim of the present work to record a SERS spectrum of fluoxetine and to interpret it on the basis of changes of the Raman spectrum as well as by studying the information of the molecular electrostatic potential (MEP) maps and
the frontier orbitals (HOMO and LUMO) on the mechanisms proposed to explain the main contributions to the overall SERS.27
EXPERIMENTAL AND COMPUTATIONAL METHODS
Sample and instrumentation
Fluoxetine, FLX·HCl, of analytical grade was purchased from a commercial source (Laboratory Bago (Chile)) as a white crystalline solid and used as received to record the Raman spectra, because of the slight solubility of this molecule in water.4 In fact, a solution Raman spectrum could not be recorded as most bands are undersized and highly concealed by the typical fluorescence of aromatic or partially aromatic compounds in solutions.
Raman and SERS spectra were recorded with the Advantage 200A spectrophotometer on an aluminum foil using Right Angle Input Optics accessory at room temperature. When acquiring data, the system emits up to 3 mW at 633 nm of radiation through its optics. Raman and SERS spectra reported represent single scans and are provided without spectral smoothing.
In order to obtain the SERS spectrum, colloidal silver nanoparticles were prepared from silver nitrate by using hydroxylamine hydrochloride (NH2OH·HCl) as a reducing agent.28 The colloid reliability for SERS enhancement was tested by UV-vis absorption spectroscopy, where the wave number is related to the reduction method chosen for the synthesis of the nanoparticles.29 The UV absorption data (Figure 1) was collected using a Jasco Model V-530 double beam spectrophotometer.
The scanning region is from 190 to 1100 nm, and the spectral bandwidth is 0.3 nm. The maximum absorption band is in agreement with that reported in the literature,28 displaying a broad peak as well as an additional band at lower energy, which is characteristic of larger metal colloidal dispersions due to the excitation of plasma resonances or higher multipole plasmon excitation.30 .
4628 Figure 1. Absorption spectrum of the silver colloid (a) and the
fluoxetine-silver colloid mixture (b), together with the maximum peak wavelengths. The spectra reveal a red shift of the absorption maximum upon fluoxetine addition.
Computational details
Geometry optimizations, molecular electrostatic potential (MEP), molecular orbitals and vibrational spectra calculations for fluoxetine were performed with the program package Gaussian 09.32 Density functional theory (DFT) with the B3LYP functional,33,34 together with Pople's 6-311++G(d,p) basis set,35-38 was employed for the optimization of the ground state geometry and simulation of the vibrational spectra. For the simulation of the SERS effect, fluoxetine is placed on an eighteen atom neutral silver cluster as a closed-shell singlet based on the experimental bulk geometry,39 data with 12 atoms on the surface plane and 6 atoms on a parallel lower layer, representing the Ag [1,1,0] surface. The atoms of the silver cluster are described by the SDD basis set together with the according pseudo potentials40 and the cluster is constrained during the geometry optimization.
The dominant character of each normal mode was determined regarding the potential energy distribution matrix (PED) obtained from the multiple scale factors applied to different internal coordinate force constants, according the treatment proposed by Pulay et al.23 Transformation of Gaussian Cartesian force constants into the corresponding internal ones, conversion from Cartesian to internal coordinates, automatic generation of the redundant internal coordinates, SQM scaling, least-squares refinement of scale factors, and decomposition of the potential energy distribution (PED) were carried out using the program FCART01, a major modification of previous software,41 written to accomplish all the necessary transformation and calculations using the Gaussian output.
RESULTS AND DISCUSSION
Optimized structure of fluoxetine
Fluoxetine possesses a chiral center hence it exists as a racemic mixture.42 The B3LYP/6-311++G(d,p)-optimized geometry given in Figure 2 shows the R isomer of fluoxetine. For the optimized structure, no imaginary frequency modes were obtained, proving that a local minimum of the potential energy surface was found. Geometrical parameters of the distinct groups of fluoxetine obtained at our level of theory are in agreement to those reported out by Garrido et al. for the S isomer.6 The planes defined by the two aromatic rings are sufficiently twisted to avoid mutual interaction, in line with the geometrical parameters obtained by X-ray diffraction study.43 In the following it will be necessary to distinguish between the two phenyl rings: the CF3-substituted ring is labelled A, while the other one is ring B.
Figure 2. B3LYP/6-311+G(d,p)-optimized structure of R-fluoxetine which
shows no interaction of the two aromatic moieties.
Raman and SERS spectra
Raman and SERS spectra of fluoxetine are shown in Figure 3. These spectra are quite similar to the ones recorded at high resolution in reference 6 for the fluoxetine R/S racemic mixture and the Raman spectrum in reference 7. The vibrational assignment for molecules containing polycyclic heteroatomic molecules is not an easy task due to the extensive coupling that occurs in the overall force field and the sheer numerical and spectral complexity of the problem as the size of the molecule increases.44
On this ground and taking into account the different origins of these vibrations in the fluoxetine molecule, the assignment of the distinct normal modes needs to be supported by theoretical considerations. As a checkup to limiting allocations of the distinct normal modes, current vibrational surveys well-documented in the literature are considered for C-H and N-H groups,45,46 substituted phenyl groups,47 secondary amines 48 and the CF3 group.49
Normal modes of the distinct groups conforming fluoxetine, can fully or partially overlap each other, thus producing broadening, shoulders or shifts of the distinct characteristic bands. Therefore computational procedures are essential in order to discriminate the allocation of the distinct normal modes. It is noted that our results based in the PED calculations are in partial agreement with the approximate description of the distinct normal modes 6 and appear to be a suitable base for the analysis and interpretation of the SERS spectrum. The SQM-derived wavenumbers agree in general quite well with the experimental data. It can be observed in Figure 3 that bands amplified by the effect of the surface appear in the range 1600-300 cm-1, so that the vibrational analysis will be performed in that frequency region. Comparative Raman and SERS bands positions together with the SQM-computed frequencies as well as the assignment of the distinct normal modes are presented in Table 1.
Although fluoxetine has no symmetry, it is still possible to approximate the local symmetry of the aromatic groups that make up this molecule. Therefore, Wilson’s notation and the nomenclature proposed by Varsanyi47 is used herein. In fact, normal modes of this kind of complex molecule cannot be assigned in an absolute and definitive form.
Figure 3. Raman spectrum of solid fluoxetine (A) and Surface-Enhanced
4629
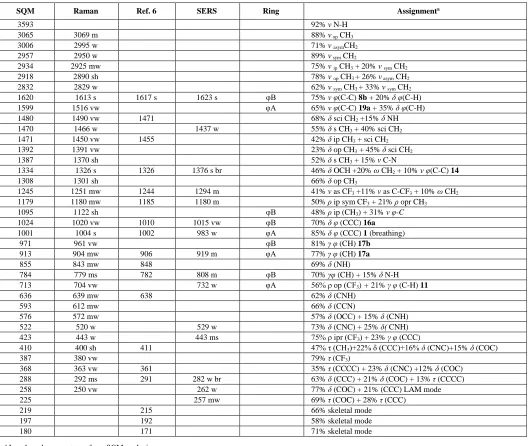
Table 1. Computed and experimental Raman and Surface-Enhanced Raman vibrations and Raman vibrational assignment of fluoxetine. Scaled quantum mechanical (SQM)-computed data are compared with measured Raman and SERS results as well as literature data. Wavenumbers are in cm-1.
SQM Raman Ref. 6 SERS Ring Assignmenta
3593 92% ν N-H
3065 3069 m 88% ν op CH3
3006 2995 w 71% ν asymCH2
2957 2950 w 89% ν sym CH2
2934 2925 mw 75% ν ip CH3 + 20% ν sym CH2
2918 2890 sh 78% ν op CH3 + 26% ν asym CH2
2832 2829 w 62% ν sym CH3 + 33% ν sym CH2
1620 1613 s 1617 s 1623 s φB 75% ν φ(C-C) 8b + 20% δ φ(C-H)
1599 1516 vw φA 65% ν φ(C-C) 19a + 35% δ φ(C-H)
1480 1490 vw 1471 68% δ sci CH2 +15% δ NH
1470 1466 w 1437 w 55% δ s CH3 + 40% sci CH2
1471 1450 vw 1455 42% δ ip CH3 + sci CH2
1392 1391 vw 23% δ op CH3 + 45% δ sci CH2
1387 1370 sh 52% δ s CH3 + 15% ν C-N
1334 1326 s 1326 1376 s br 46% δ OCH +20% ω CH2 + 10% ν φ(C-C) 14
1308 1301 sh 66% δ op CH3
1245 1251 mw 1244 1294 m 41% ν as CF3 +11% ν as C-CF3 + 10% ω CH2
1179 1180 mw 1185 1180 m 50% ρ ip sym CF3 + 21% ρ opr CH3
1095 1122 sh φB 48% ρ ip (CH3) + 31% ν φ-C
1024 1020 vw 1010 1015 vw φB 70% δ φ (CCC) 16a
1001 1004 s 1002 983 w φA 85% δ φ (CCC) 1 (breathing)
971 961 vw φB 81% γ φ (CH) 17b
913 904 mw 906 919 m φA 77% γ φ (CH) 17a
855 843 mw 848 69% δ (NH)
784 779 ms 782 808 m φB 70% γφ (CH) + 15% δ N-H
713 704 vw 732 w φA 56% ρ op (CF3) + 21% γ φ (C-H) 11
636 639 mw 638 62% δ (CNH)
593 612 mw 66% δ (CCN)
576 572 mw 57% δ (OCC) + 15% δ (CNH)
522 520 w 529 w 73% δ (CNC) + 25% δ( CNH)
423 443 w 443 ms 75% ρ ipr (CF3) + 23% γ φ (CCC)
410 400 sh 411 47% τ (CH3)+22% δ (CCC)+16% δ (CNC)+15% δ (COC)
387 380 vw 79% τ (CF3)
368 363 vw 361 35% τ (CCCC) + 23% δ (CNC) +12% δ (COC)
288 292 ms 291 282 w br 63% δ (CCC) + 21% δ (COC) + 13% τ (CCCC)
258 250 vw 262 w 77% δ (COC) + 21% (CCC) LAM mode
225 257 mw 69% τ (COC) + 28% τ (CCC)
219 215 66% skeletal mode
197 192 58% skeletal mode
180 171 71% skeletal mode
a Local mode percentages from SQM analysis
Abbreviations and normal modes definitions:
sh: shoulder; v: very; s: strong; m: medium; br: broad; w: weak
ip: in-plane; op: out-of-plane; vib: vibration; φ: ring; ν: stretching; δ: bending; γ: out-of-plane bending; ρ: rocking; τ: torsion; ω: wagging; sci: scissoring; tang: tangential; sym: symmetric; as: asymmetric; LAM: longitudinal acoustic mode
Wilson’s notation of aromatic modes: 8b: φ (C=C) tang vib; 19a: φ(C=C) tang vib; 14: φ(C=C) tang vib; 16a: δ (CCC)op vib; 1: δ (CCC) breathing; 17b: γ φ (CH) op vib; 17a: γ φ (CH) op vib; 11: γ φ (CH) op vib.
SERS spectrum analysis
There are two main mechanisms of enhancement described in the literature: an electromagnetic and a chemical enhancement,50 both related to an increase in the molecular polarization of the absorbed species and the local electric field (E local) near the metallic surface.51 In this sense, two possibilities of molecule/substrate interaction can be considered: physisorption and chemisorption. When the molecules are physisorbed on the metal surface, the SERS spectra are very similar to those of the free molecule, being the electromagnetic (EM) mechanism the most important mechanism of the Raman enhancement.52 In the case of chemisorption a new metal-molecule SERS complex is formed and changes in position and intensities of the SERS bands relative to the normal Raman are observed. In this case, the charge-transfer (CT) effect is the dominant mechanism of the Raman enhancement 53 with the
Franck-Condon contribution enhancing only totally symmetric modes, while the Herzberg-Teller effect in principle influences all modes. The relative intensities of the bands from SERS spectra are expected to differ significantly from those of normal Raman spectra owing to the specific selection rules.54 Surface selection rule suggests that for a molecule adsorbed flat on the metal surface, its out-of-plane vibrational modes will be more enhanced when compared with its in-out-of-plane vibrational modes, and vice versa when it is adsorbed perpendicular to the surface.53 It is further seen that bands involving vibrating atoms that are close to the metal surface will be mostly enhanced and shifted.55
4630 From the absence of bands in the surroundings of 3000 cm-1 in the SERS
spectrum and regarding the selection rules,54 it is firstly inferred that no aromatic or aliphatic C-H stretching vibrations are involved in the SERS effect, which in turn means that the two phenyl rings A and B should be flat or nearly flat to the metal surface and that the aliphatic group containing the secondary amine and CH3 group should be far from the metallic surface. This early glimpse about the orientation of the molecule on the substrate can be theoretically backed up by means of the MEP plot calculated at the B3LYP/6-311++G(d,p)-optimized geometry presented in Figure 4. This map allows visualizing variably charged regions of a molecule, which is a useful property to study reactivity given that an approaching electrophile will be attracted to negatively charged areas. In most MEPs are the negatively charged regions - preferred site for an electrophilic attack - indicated in red color, while the positive regions are shown in blue.56 Figure 4 shows a widespread negative charge wrapping all over the CF3 group (together with the amine moiety which also possesses a significant negative charge), indicating a stronger affinity to the metal surface. Due to observed band enhancements of bands belonging to ring vibrations, it can be concluded that the CF3 group and its connected ring A should be nearly parallel to the metal surface, while ring B would be in a slightly tilted position over the metal Ag NP surface. Also it can be inferred that during the adsorption process the rings tend to go closer to the silver surface, due to a favorable interaction of their π ring systems with the colloid’s surface.57 On this basis and taking into account the selection rules, major enhanced vibration should be those corresponding to CH op bendings of the ring A as well as C-C stretchings and CH ip bendings belonging to the tilted ring and also to some special CF3 bending modes. Furthermore, ring torsions and in general those vibrations in the closeness of the metal surface should be enhanced in varying degrees.
Figure 4. Molecular electrostatic potential (MEP) map of fluoxetine. This mapping of the electrostatic potential allows the identification of positively (blue) and negatively charged (red) regions. In combination with the observed band enhancements, it is expected that the latter CF3-moiety and the adjacent ring (on the right side) are oriented parallel to the silver nanoparticle surface.
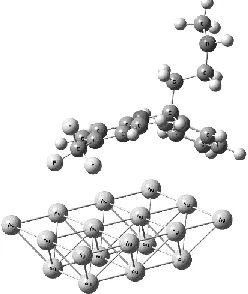
These empirical and MEP considerations about the orientation of fluoxetine on the Ag surface are supported by the DFT geometry optimization of the fluoxetine-Ag18 cluster. The most stable orientation of fluoxetine on the silver surface model is given in Figure 5. This figure also shows the proximity of the CF3 group to the Ag cluster and the remoteness of the C-N moiety.
Figure 5. B3LYP/6-311+G(d,p)-optimized structure of the fluoxetine-Ag18 cluster. This most stable conformation confirms the orientation of the CF3-group towards the metal surface.
At first glance, the SERS spectrum profile shows blue and red band shifting in relation to the corresponding ones in the normal Raman, as well as the appearance of new peaks with different levels of intensity. Both, changes in intensity and displacement of the bands ought to be analyzed taking into account the different mechanisms that explain the SERS effect.
The intensity of the aromatic CC stretching observed at 1623 cm-1 in the SERS spectrum is similar to the corresponding one at 1613 cm-1 in the Raman spectrum. This can be explained that this vibration belongs to the aromatic fragment not plane parallel and close to the surface, suggesting a restrained influence of the CT mechanism. In general, the nonsymmetrical 16a δ (CCC) out-of-plane vibration modes are selectively enhanced by the CT mechanism through the Herzberg−Teller contribution, being the EM and CT relative contributors to the SERS enhancements.58
On the other hand, the δ O-C-H at 1326 cm-1 mixed with ω CH2 appears markedly shifted and widened in the SERS spectrum at 1376 cm-1 evidencing a main role of the CT mechanism, as well as the homogeneity of the intermolecular distances and vibrational coupling between individual oscillators, as it has been well established by Persson and Ryberg.59 Furthermore, the Raman band at 1251 cm-1 partially assigned to asymmetric C-F stretching modes, is strongly enhanced by the effect of the metal substrate and shifted to 1294 cm-1, while the symmetric C-F stretching mode is not affected. The distinct degree of displacement of these fundamentals suggests different levels of participation of the CT mechanism depending on the symmetry of the normal mode. The intense bands in the normal Raman spectrum at 1004 cm-1 ascribed to an almost breathing-like vibration related to the ring A, appears less intense at 983 cm-1 in the SERS spectrum. Additionally, a medium weak Raman band at 908 cm-1 (γ CH) is shifted to 919 cm-1 in SERS, whereas a band at 851 cm-1 (δ N-H) cm-1 vanishes in the SERS, and a Raman band at 779 cm-1 (γ CH) is shifted to 804 cm-1. Moreover, a fundamental at 704 cm-1 (CF3 op rocking) is shifted to 736 cm-1, while bands at 636 (δ (CNH)) and 572 cm-1 (δ (OCC)) do not appear in the SERS spectrum; and a Raman band at 443 cm-1 (CF3 ip rocking) that displays no discernible shifting, is notably enhanced by the SERS effect. Finally, a normal mode active in Raman at 292 cm-1 seems, in a first instance, not to be influenced by the presence of the metal surface.
The above-described displacement of bands implies some incidence of the CT mechanism in the SERS effect, which is currently explained by the energy of the frontier orbitals of the molecule in relation to the Fermi level. As a matter of fact, the chemical enhancement is a kind of resonance Raman scattering in which resonant intermediate states arise from metal–molecules charge transfer excitation: if the difference in energy between the Fermi level (which give us information of the electrons that take part in ordinary electrical conductivity) and the frontier orbital of the absorbed species is close to the energy of incident light, an enhancement mechanism occurs.60 In such a course, the Fermi level of the metal acts as an initial or final state in the resonance Raman process.27,61,62 The charge transfer excitation from the metal to the molecule and vice versa can occur at a lower energy than the intrinsic intramolecular excitations of the adsorbate. In general, the CT process enhances the symmetrical modes, and preferentially those ones involving coordinates, which are relaxed by the electronic excited state.63
For the Ag atom the experimental value of Fermi level has been reported to be 5.5 eV.64 On the other hand, HOMO and LUMO levels of fluoxetine are calculated at 6.44 and 0.93 eV respectively. These values change slightly upon chemisorption on the silver NP to 6.30 eV (HOMO) and 0.95 eV (LUMO). This means that the Fermi level lies above the HOMO and well below the LUMO. Considering the large LUMO–Fermi level energy difference (4.57 eV) the laser excitation wavelength (1.96 eV) does not have enough energy to further transfer electrons from the metal into the LUMO of fluoxetine. Hence, in principle, it can be concluded that molecule to metal charge transfer interaction is more preferred here. These findings are supported by an NBO65,66 analysis that shows no metal-substrate charge transfer but a slight net transfer of NPA charges from fluoxetine to the Ag18 cluster (about 0.2 electrons).
4631
However, different magnitude shifts – either red or blue - and the asymmetry of the HOMO-LUMO gap with respect to the Fermi level, suggest a high degree of combined CT and EM mechanisms. A comprehensive study of the red and blue shifts produced in the SERS spectrum is in process in our laboratory on the basis of the Franck−Condon and Herzberg−Teller contributions to the SERS effect.67
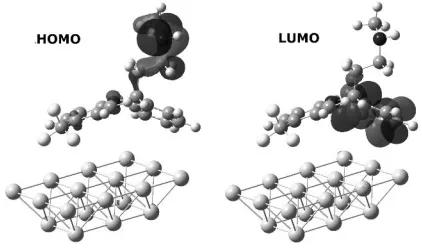
Figure 6. B3LYP/6-311+G(d,p)-computed frontier orbitals of fluoxetine in
the silver nanoparticle complex. The HOMO (highest occupied molecular orbital) is shown on the left and is located mainly at the amine moiety of fluoxetine, while the LUMO (lowest unoccupied molecular orbital, right side) is distributed on one of the aromatic rings.
CONCLUSIONS
The present study shows that a complete analysis of the Raman and SERS spectra for fluoxetine along with scaled DFT/B3LYP calculations are significant forthcoming for comprehending the vibrational spectra of medium-sized organic compounds. Further, molecular geometry optimization and molecular electrostatic potential (MEP) are useful to gain insight on the orientation of fluoxetine on the Ag nanoparticles. On the other hand, a frontier orbital analysis gives signs on molecular conjugation, electron donor and acceptor abilities of this molecule, although the real nature of the SERS enhancement mechanism is not unambiguously elucidated.
ACKNOWLEDGMENTS
The authors gratefully thank DGI Universidad de Playa Ancha (Project DGI01-14-15). Generous allocation of computer time at the CSC Oldenburg is gratefully acknowledged. GDF and RK also thank the international collaboration program CONICYT-DFG 070 2008. The authors further acknowledge Project FONDEQUIP EQM-130170.
REFERENCES
1. Wong, D.T.; Bymaster, F.P.; Engleman, E.A. The First Selective Serotonin Uptake Inhibitor and an Antidepressant Drug: Twenty Years since Its First Publication. Life Science 1995, 57(5), 411-441.
2. Indhumathi, D.; Grace, R. Design and optimization of orodissolving tablet of antidepressant drug by superdisintegrants addition method. Int. J. Pharm. Sci. Rev. Res. 2010, 2(2), 1-9.
3. Persona, K.; Madej, K.; Knihnicki, P.; Piekoszewski, W. Analytical Methodologies for the Determination of Benzodiazepines in Biological Samples. J. Pharm. Biomed. Anal. 2015, 113, 239-264.
4. Risley, D.S.; Bopp, R.J. in Analytical Profiles of Drugs Substances, Florey, K. Ed.; Academic Press: San Diego 1990; Vol. 19, pp. 193-219.
5. Yellamula, N.R.; Appapurapu, A.K.; Reddy, T.P.K.; Banji, D.; Appapurapu, A.K.; Deepthi, P.N. Effect of natural, synthetic and co-processed excipients on drug release of fluoxetine hydrochloride immediate release drug delivery system. Pharma Innovation, 2014, 3(8), 1-9.
6. Garrido, E.M.; Garrido, J.; Calheiros, R.; Marques, M.P.M.; Borges, F. Fluoxetine and Norfluoxetine Revisited: New Insights into the Electrochemical and Spectroscopic Properties. J. Phys. Chem. A, 1994, 113(36), 9934–9944.
7. Menaa, F.; Menaa B.; Sharts, O. Development of carbon-fluorine spectroscopy for pharmaceutical and biomedical applications. Faraday Discuss, 2011, 149, 269–278.
8. King, F.W.; Van Duyne, R.P.; Schatz, G.C. Theory of Raman Scattering by molecules adsorbed on electrodes surface. J. Chem. Phys. 1978, 69(10), 4472–4481.
9. Pinzaru, S.C.; Pavel, I.; Leopold, N.; Kiefer, W. Identification and characterization of pharmaceuticals using Raman and surface‐enhanced Raman scattering. J. Raman Spectrosc. 2004, 35, 338-346.
10. Takenaka, M.; Hashimoto, Y.; Iwasa, T.; Taketsugu, T.; Seniutinas, G.; Balcytis, A.; Juodkazis, S.; Nishijima, Y. First Principles Calculations Toward Understanding SERS of 2,2‘-Bipyridyl Adsorbed on Au, Ag, and Au–Ag Nanoalloy. J. Comput. Chem. 2019, 40, 925–932.
11. Luo, Z.; Loo, B. H.; Cao, X.; Peng, A.; Yao, J. Probing the Conformational Transition of 2,2’-Bipyridyl under External Field by Surface-Enhanced Raman Spectroscopy. J. Phys. Chem C 2012, 116, 2884-2890.
12. Diaz F., G.; Finnerty, J. J.; Campos-Vallette, M.; Célis, F.; Aliaga, A. E.; Fredes, C.; Koch, R. Experimental and theoretical Raman and surface-enhanced Raman scattering study of cysteine.J. Raman Spec. 2009, 40, 632 – 638.
13. Diaz F., G.; Golsio, I.; Aracena, A.; Celis, F.; Vera, L.; Koch, R.; Campos-Vallette, M. M. Theoretical Surface-Enhanced Raman Spectra study of substituted benzenes I. Density Functional Theoretical SERS modelling of benzene and benzonitrile. Spectrochimica Acta Part A 2008, 71, 1049 – 1055.
14. Diaz F., G.; Golsio, I.; Aracena, A.; Celis, F.; Vera, L.; Koch, R.; Campos-Vallette, M. M. Theoretical Surface-Enhanced Raman Spectra study of substituted benzenes II. Density Functional Theoretical SERS modelling of o-, m-, and p-methoxybenzonitrile. Spectrochimica Acta Part A, 2008, 71, 1074 – 1079.
15. Diaz F., G.; Célis, F.; Fredes, C.; Campos-Vallette, M.; Aliaga, A. E.; Koch, R. Surface-enhanced Raman scattering and density functional theory studies of bis(4-aminophenyl)sulfone. J. Raman Spec. 2010, 41, 160 – 166. 16. Ejorh, Y. E.; Ilsley, W. H.; Ooi, B. G.. Elucidating the Chemisorption
Phenomena in SERS Studies via Computational Modeling. Opt. Phot. J. 2018, 8, 212-234.
17. Birke, R. L.; Lombardi, J. R. Simulation of SERS by a DFT study: a comparison of static and near-resonance Raman for 4-mercaptopyridine on small Ag clusters. J. Opt. 2015, 17, 114004.
18. Zhao, L. L.; Jensen, L.; Schatz, G. C. Pyridine-Ag20 cluster: a model system for studying surface-enhanced Raman scattering. J. Am. Chem. Soc. 2006, 128, 2911–2919.
19. Carrasco Flores, E. A.; Campos Vallette, M. M.; Clavijo C., R. E.; Leyton, P.; Díaz F., G.; Koch, R. SERS spectrum and DFT calculations of 6-nitrochrysene on silver islands. Vibrat. Spec. 2005, 37, 153 – 160. 20. Hu, W.; Duan, S.; Luo, Y. Theoretical modeling of surface and tip-enhanced
Raman spectroscopies. WIREs Comput Mol Sci 2017, 7:e1293.
21. Muniz-Miranda, M.; Gellini, C.; Pagliai, M.; Innocenti, M.; Salvi, P. R.; Schettino, V. SERS and Computational Studies on MicroRNA Chains Adsorbed on Silver Surfaces. J. Phys. Chem. C 2010, 114, 13730-13735. 22. Riccia, M.; Becuccia, M.; Castelluccia, E. M. Chemical enhancement in the
SERS spectra of indigo: DFT calculation of the Raman spectra of indigo-Ag14 complexes. Vibrat. Spec. 2019, 100, 159-166.
23. Pulay P.; Fogarasi G.; Pongor G.; Boggs J.E.; Vargha A. Combination of theoretical ab initio and experimental information to obtain reliable harmonic force constants. Scaled quantum mechanical (QM) force fields for glyoxal, acrolein, butadiene, formaldehyde, and ethylene. J. Am. Chem. Soc. 1983, 105(24), 7037-7047.
24. Diaz Fleming, G.; Celis, F.; Aracena, A.; Campos-Vallette, M.; Aliaga, A. E.; Koch, R. Vibrational and scaled quantum chemical study of O,O-dimethyl S-methylcarbamoylmethyl phosphorodithioate, dimethoate. Spectrochimica Acta Part A 2012, 89, 222-230.
25. Diaz Fleming, G.; Villagrán, J.; Koch, R. IR, Raman and SERS Spectral Analysis and DFT Calculations on the Herbicide O,S-Dimethyl phosphoramidothioate, Metamidophos. Spectrochimica Acta Part A 2013, 114, 120-128.
26. Diaz Fleming, G.; Koch, R.; Muñoz Perez, J.; Llanos Cabrera, J. Raman and SERS Study of N-Acetyl-5-methoxytryptamine, melatonin - The influence of the different molecular fragments on the SERS effect. Vibrat. Spect. 2015, 80, 70-78.
27. Campion, A., Kambhampati, P., Surface-enhanced Raman scattering. Chem. Soc. Rev. 1998, 27(4), 241-250.
28. Leopold, N.; Lendl, B. A New Method for Fast Preparation of Highly Surface-Enhanced Raman Scattering (SERS) Active Silver Colloids at Room Temperature by Reduction of Silver Nitrate with Hydroxylamine Hydrochloride.J. Phys. Chem. 2003, 107(24), 5723 – 5727.
29. Cyrankiewicz, M.; Wybranowski, T.; Kruszewski, S. Study of SERS efficiency of metallic colloidal systems. J. Phys. Conf. Ser. 2007, 79, 012013.
4632 31. Abbaszadegan, A.; Ghahramani, Y.; Gholami, A.; Hemmateenejad, B.;
Dorostkar, S.; Nabavizadeh, M.; Sharghi, H. The Effect of Charge at the Surface of Silver Nanoparticles on Antimicrobial Activity against Gram-Positive and Gram-Negative Bacteria: A Preliminary Study. J. Nanomat. 2015, 2015, Article ID 720654.
32. Frisch, M.J.; Trucks, G.W.; Schlegel, H.B.; Scuseria, G.E.; Robb, M.A.; Cheeseman, J.R.; Scalmani, G.; Barone, V.; Mennucci, B.; Petersson, G.A.; Nakatsuji, H.; Caricato, M.; Li, X.; Hratchian, H.P.; Izmaylov, A.F.; Bloino, J.; Zheng, G.; Sonnenberg, J.L.; Hada, M.; Ehara, M.; Toyota, K.; Fukuda, R.; Hasegawa, J.; Ishida, M.; Nakajima, T.; Honda, Y.; Kitao, O.; Nakai, H.; Vreven, T.; Montgomery Jr., J.A.; Peralta, J.E.; Ogliaro, F.; Bearpark, M.; Heyd, J.J.; Brothers, E.; Kudin, K.N.; Staroverov, V.N.; Kobayashi, R.; Normand, J.; Raghavachari, K.; Rendell, A.; Burant, J.C.; Iyengar, S.S.; Tomasi, J.; Cossi, M.; Rega, N.; Millam, J.M.; Klene, M.; Knox, J.E.; Cross, J.B.; Bakken, V.; Adamo, C.; Jaramillo, J.; Gomperts, R.; Stratmann, R.E.; Yazyev, O.; Austin, A.J.; Cammi, R.; Pomelli, C.; Ochterski, J.W.; Martin, R L.; Morokuma, K.; Zakrzewski, V.G.; Voth, G.A.; Salvador, P.; Dannenberg, J.J.; Dapprich, S.; Daniels, A.D.; Farkas, Ö.; Foresman, J.B.; Ortiz, J.V.; Cioslowski, J.; Fox, D.J. Gaussian 09, Rev. D01: Gaussian, Inc., Wallingford CT, 2009.
33. Becke, A.D. Density functional thermochemistry. III. The role of exact exchange. J. Chem. Phys. 1993, 98(7), 5648-5652.
34. Lee, C.; Yang, W.; Parr, R.G. Development of the Colle-Salvetti correlation-energy formula into a functional of the electron density. Phys. Rev. B: Condens. Matter 1988, 37, 785-789.
35. Raghavachari, K.; Binkley, R.S.; Seeger, R.; Pople, J.A. Self-Consistent Molecular Orbital Methods. 20. Basis set for correlated wave-functions. J. Chem. Phys. 1980, 72, 650-654.
36. McLean, A.D.; Chandler, G.S. Contracted Gaussian-basis sets for molecular calculations. 1. 2nd row atoms, Z=11-18. J. Chem. Phys. 1980, 72, 5639-5648.
37. Clark, T.; Chandrasekhar, J.; Spitznagel, G.W.; Schleyer, P.v.R. Efficient diffuse function-augmented basis-sets for anion calculations. 3. The 3-21+G basis set for 1st-row elements, Li-F. J. Comput. Chem. 1983, 4, 294-301. 38. Frisch, M.J.; Pople, J.A.; Binkley, J.S. Self‐consistent molecular orbital
methods 25. Supplementary functions for Gaussian basis sets. J. Chem. Phys. 1984, 80 (7) 3265-3269.
39. Suh, I.K.; Ohta, H.; Waseda, Y. High-temperature thermal expansion of six metallic elements measured by dilatation method and X-ray diffraction. J. Mater. Sci. 1998, 23(2), 757-760.
40. Andrae, D.; Häussermann, U.; Dolg, M.; Stoll, H.; Preuss, H. Energy-adjusted ab initio pseudopotentials for the second and third row transition elements. Theor. Chim. Acta 1990, 77(2), 123-141.
41. Collier, W.C. QCPE Bull. 1996, 13, 16502-16513.
42. Arky, R. Physicians’ Desk Reference, Medical Economics Data Production Company: Montvale, NJ, USA, 1994.
43. Robertson, D.W.; Jones, N.D.; Swartzendruber, J.K.; Yang, K.S.; Wong, D.T. Molecular structure of fluoxetine hydrochloride, a highly selective serotonin-uptake inhibitor. J. Med. Chem. 1988, 31(1), 185-189.
44. Zerbi, G. in Vibrational Spectroscopy-Modem Trends, Barnes, A.J.; Orville-Thomas, W.J., Eds.; Elsevier: New York, 1997.
45. Socrates, G. Infrared and Raman Characteristic Group Frequencies: Tables and Charts, 3rd Ed., John Wiley & Sons: New York/Brisbane/Weinheim/Singapore/Toronto, 2004.
46. Vien, D.L.; Colthup, N.B.; Fateley, W.G.; Grasselli, J.G. The Handbook of Infrared and Raman Characteristic Frequencies of Organic Molecules, Academic Press: Boston, 1991.
47. Varsanyi, G. Vibrational Spectra of Benzene Derivatives; Academic Press: New York, 1969.
48. Stewart, J.E. Vibrational spectra of primary and secondary aliphatic amines. J. Chem. Phys. 1959, 30(5), 1259–1265.
49. Shahidha, R.; Muthu, S.; Elamurugu Porchelvi, E.; Govindarajan, M. Normal Coordinate Analysis and Vibrational Spectroscopy (IR and FT-Raman) Studies of 5-Methyl-N-[4-(Trifluoromethyl) Phenyl]-Isoxazole-4-Carboxamide Using Density Functional Method. Spectrochim. Acta A 2014, 132, 142–151.
50. Kambhampati, P.; Child, C.M.; Foster, M.C.; Campion, A. On the chemical mechanism of surface enhanced Raman scattering: Experiment and theory. J. Chem. Phys. 1998, 108(12), 5013-5026.
51. Lombardi, J.R.; Birke, R.L.; Lu, T.; Xu, J. Charge‐transfer theory of surface enhanced Raman spectroscopy: Herzberg–Teller contributions. J. Chem. Phys. 1986, 84(8), 4174-4180.
52. Moskovits, M. Surface-enhanced spectroscopy. Rev. Mod. Phys. 1985, 57(3), 783-826.
53. Creighton, J.A. Surface Raman electromagnetic enhancement factors for molecules at the surface of small isolated metal spheres: The determination of adsorbate orientation from SERS relative intensities. Surf. Sci. 1983, 124(1), 209-219.
54. Gao, X.; Davies, J.P.; Weaver, M.J. Test of surface selection rules for surface-enhanced Raman scattering: the orientation of adsorbed benzene and monosubstituted benzenes on gold. J. Phys. Chem. 1990, 94(17), 6858-6864. 55. Otto, A. Theory of First Layer and Single Molecule Surface Enhanced Raman Scattering (SERS) Phys. Status Solidi A 2001, 188(4), 1455-1470. 56. Politzer, P.; Truhlar, D.G., Eds.; Chemical Application of Atomic and
Molecular Electrostatic Potentials; Plenum: New York, 1981.
57. Wang, Y.; Ji, W.; Sui, H.; Kitahama, Y.; Ruan, W.; Ozaki, Y.; Zhao, B. Exploring the Effect of Intermolecular H-Bonding: A Study on Charge-Transfer Contribution to Surface-Enhanced Raman Scattering of p-Mercaptobenzoic Acid. J. Phys. Chem. C 2014, 118(19), 10191−10197. 58. Zhang, X.; Yu, Z.; Ji, W.; Sui, H.; Cong, Q.; Wang, X.; Zhao, B.
Charge-Transfer Effect on Surface-Enhanced Raman Scattering (SERS) in an Ordered Ag NPs/4-Mercaptobenzoic Acid/TiO2 System. J. Phys. Chem. C 2015, 119(39), 22439−22444.
59. Persson, B.N.J.; Ryberg, R. Vibrational interaction between molecules adsorbed on a metal surface: The dipole-dipole interaction. Phys. Rev. B 1981, 24(12), 6954–6970.
60. Clark, R.J.H.; Dines, T.J. Resonance Raman Spectroscopy, and Its Application to Inorganic Chemistry. New Analytical Methods. Angew. Chem. Int. Ed. Engl. 1986, 25(2), 131-158.
61. Persson, B.N.J. On the theory of surface-enhanced Raman scattering. Chem. Phys. Lett. 1981, 82(3), 561-565.
62. Bjerneld, E.J.; Johansson, P.; Kaell, M. Single Molecule Vibrational Fine‐
structure of Tyrosine Adsorbed on Ag Nano‐Crystals. Single Mol. 2000, 1, 239-248.
63. Grabhorn, H.; Otto, A. What determines the selection rules of surface enhanced Raman spectroscopy? Vacuum 1990, 41, 473-475.
64. Kittel, C. lntroduction to Solid State Physics. 5th Ed., John Wiley & Sons: New York, 1976.
65. Glendening, E. D.; Reed, A. E.; Carpenter, J. E.; Weinhold, F. NBO Version 3.1.
66. Reed, A. E. ; Curtiss, L. A.; Weinhold, F. Intermolecular interactions from a natural bond orbital, donor-acceptor viewpoint. Chem. Rev. 1988, 88, 899-926.