VOLUME 41, ARTICLE 46, PAGES 1289
-
1314
PUBLISHED 26 NOVEMBER 2019
https://www.demographic-research.org/Volumes/Vol41/46/ DOI: 10.4054/DemRes.2019.41.46
Research Article
Forty years of fertility changes in the Sahel
Thomas Spoorenberg
© 2019 Thomas Spoorenberg.
This open-access work is published under the terms of the Creative Commons Attribution 3.0 Germany (CC BY 3.0 DE), which permits use, reproduction, and distribution in any medium, provided the original author(s) and source are given credit.
1 Introduction 1290
2 Data and methods 1291
3 Results 1293
3.1 Levels and trends in the transition to successive births 1293
3.2 Birth intervals 1295
3.3 A summary view of the changes 1298
4 Discussion and conclusion 1299
References 1303
Forty years of fertility changes in the Sahel
Thomas Spoorenberg1
Abstract
BACKGROUND
Despite much discussion on the fertility changes in sub-Saharan Africa, the countries of the Sahel have received only limited attention. Their comparatively high and stable fertility levels contributed them being labeled as an exception in sub-Saharan Africa.
OBJECTIVE
This study investigates whether countries of the Sahel are an exception in the cross-continental trend of increasing birth intervals since the 1970s in sub-Saharan Africa.
METHODS
Using birth history data, the levels and trends in parity progression ratios and birth intervals are reconstructed for four decades in four countries of the Sahel (Burkina Faso, Chad, Mali, and Niger).
RESULTS
In all four countries, parity progression ratios have changed little, but births have been occurring later and the age at which an average woman is bearing her seventh child has increased.
CONCLUSIONS
While the lengthening of birth intervals has been associated with lower fertility in many analyses, this study shows that a similar process is found in countries with high and stable total fertility rates.
CONTRIBUTION
This study contributes to revise some commonly accepted views on the fertility dynamics in the Sahel.
1
1. Introduction
Fertility change in sub-Saharan Africa has received a considerable amount of attention. While rapid fertility declines have been observed in Asia, Latin America, and northern Africa, the fertility transition in sub-Saharan Africa started later and has been considerably slower (Bongaarts 2017; Bongaarts and Casterline 2012; Shapiro and Hinde 2017). For sub-Saharan Africa, most of the studies have focused on countries that have achieved significant fertility decline or where fertility transition is well underway.
Although the fertility transition is underway in the majority of sub-Saharan African countries, a handful of countries still experience high levels of fertility. Many of those are located in the central and western part of the Sahel ‒ a region bordering the southern edge of the Sahara. Three Sahelian countries (Niger, Chad, and Mali) rank in the top five countries with the highest total fertility rate in the world (UNPD 2019). In the countries of the Sahel, fertility has remained either high and rather stable or, in the cases where the onset of fertility decline has begun, fertility has either declined slowly or eventually stalled.
Given the limited change in fertility in the Sahel, most of the demographic studies have focused on the consequences of the impeding population development and have identified the social, cultural, and political obstacles to the fertility decline (Issaka and Guengant 2017; Garenne 2016; May 2017; May and Guengant 2014; May, Guengant and Barras 2017; Potts et al. 2011). The focus has been mostly on the level of fertility using the total fertility rate and its proximate determinants, such as the early age at marriage, the low prevalence of contraception, and the general low status of women in terms of education, employment, and other markers (Hertrich 2017; Tabutin and Schoumaker 2004). Surprisingly, few studies have investigated if changes were indeed at work under the seemingly stable image given by the aggregate measure of fertility (Spoorenberg and Issaka 2018). This is even more puzzling given the widely acknowledged importance of fertility in the determination of the future size of the population.
four countries present a fertility level of at least 5.5 children per woman in 2010‒2015 (UNPD 2019).
Because a lengthening of the birth intervals has usually been associated with lower fertility levels, lower fertility desires, and higher percentages of women expressing attitudes consistent with family-size limitation (Bongaarts and Casterline 2012; Moultrie, Sayi, and Timæus 2012), Sahelian countries have received only marginal treatment. In the Sahel, fertility still reaches high and rather stable levels, and women express strong desires for large family size and their attitudes are oftentimes not consistent with family-size limitation. The status quo in the Sahelian fertility dynamics is usually briefly mentioned in the existing literature. Sahelian countries are generally referred to as an exception in the cross-continental trend of increasing birth intervals since the 1970s (Moultrie, Sayi, and Timæus 2012: 248; Towriss and Timæus 2018: 2029).
This study covers four decades of change in the levels and trends in parity progression ratios and birth intervals in four high-fertility countries, documenting the changes both before the onset of the fertility transition and during the opening of the fertility decline ‒ periods for which limited evidence is available still. The study adds new knowledge on the fertility transitions around the world and allows the documentation of fertility changes in the Sahel ‒ a region poorly studied compared to other subregions in sub-Saharan Africa. In doing so, it is shown that some commonly accepted views on the fertility dynamics in the Sahel do not hold after a careful examination of the available data.
2. Data and methods
Table 1: Number of DHS per country, year of DHS surveys, and period covered in the analysis
Country Number of DHS included in the
analysis Year of DHS surveys
Period covered by the analysis
Burkina Faso 4 1993, 1998‒1999, 2003, 2010 1978‒2009
Chad 3 1996‒1997, 2004, 2014‒2015 1981‒2013 Mali 5 1987, 1995‒1996, 2001, 2006, 2012‒2013 1972‒2011
Niger 4 1992, 1998, 2006, 2012 1977‒2011
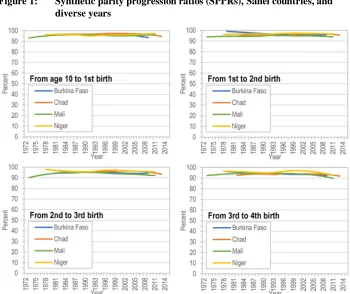
Using the birth history information available in the individual-level survey data files, synthetic parity progression ratios (SPPRs) were computed for each survey (Hinde 1998; Pullum 2004). SPPRs can be interpreted as the probability that a woman of parity
i will move to parityi+1 if she maintains the fertility level observed during the given year throughout her reproductive life. In computing SPPRs, women with inconsistent birth histories (i.e., more than 25 years between age 10 and a first birth or birth intervals of less than eight months or more than ten years) were systematically excluded. These exclusions vary from one survey to another and from one parity to the next, but they do not amount to any significant proportion of the samples and do not affect the narrative told by the data. To compute SPPRs, women giving birth in a given year are followed ‘backwards’ in time to the date of their previous child. To compute these ratios, a number of years must be considered in order to go back in time as far as is necessary to capture the vast majority of women who will go on to have another child. As birth intervals of more than ten years are rare in most populations, a good rule of thumb is to go back ten years in the computation of the SPPRs (Hinde 1998: 114). For the progression to the first birth, because childbearing at very young ages occurs in the Sahel, the year a woman reached her tenth birthday was selected as the preceding event and a period of 25 years back in time was selected in the computation of the SPPRs in order to include in the numerator all the women who will eventually go on to have a first child. Computing parity progression ratios (PPRs) this way “renders the PPRs as up to date as possible” (ibid.). SPPRs were computed for a 15-year period before each survey, excluding the survey years. To avoid erratic variation related to the ever-reducing subsample of women reaching a higher parity, SPPRs were computed until the progression to an eighth birth.
stability given by the level of fertility or the parity progression ratios. Women can bear the same number of children but extend the duration between each birth. In such case, one would conclude that no changes are occurring based on the study of the parity progression ratios, missing so profound a transformation occurring in reproductive behaviors. In this study, birth intervals were computed up to the seventh birth; beyond that birth order, the mean birth intervals were deemed as varying too erratically due to the sample attrition.
SPPRs and mean birth intervals were computed for each DHS separately without merging the surveys, offering an opportunity to determine the quality of the birth history data (Arnold 1990; Pullum 2006; Schoumaker 2014; Spoorenberg 2010). The series of SPPRs and mean birth intervals were then smoothed using a local regressor (loess regression) to facilitate the intercountry comparison. The national series of SPPRs and mean birth intervals estimated for each survey, as well as the resulting smoothed trend, are available by country in Figures A-1‒A-8 in the Appendix.
Finally, to facilitate an overall comparison between countries, a summary view of the changes is offered by adding up the successive mean birth intervals from age 10. For each country, the first three years at the beginning of the period of analysis and the last three years at the end of the period of analysis were used.
3. Results
The results are presented in three subsections, corresponding to the main steps of this research. Similarities between countries are first considered, before turning to intercountry differences. A more interpretative discussion is made in the final section.
3.1 Levels and trends in the transition to successive births
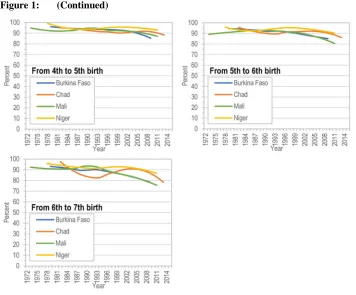
and Mali have declined by at least 10 percentage points between the late 1980s and the mid-2000s. Some differences can also be noted in the percentage of women reaching a given parity. For example, the progression to a seventh birth in Chad shows large variation. Most of these differences are influenced by the number of the surveys available (and their quality) (see Figures A-2 in Appendix). This is especially the case for the most recent years. Despite these variations, the parity progression ratios indicate that the female reproductive experience has remained similar across the Sahel.
Figure 1: (Continued)
Note: computed from DHS datasets.
Based on the sole analysis of the parity progression ratios, reproductive behaviors have remained rather homogeneous in all the countries of the Sahel. Yet, looking at the ‘quantum’ of fertility, as done when considering the parity progression ratios, hides possible important changes at work in the ‘tempo’ of fertility.
3.2 Birth intervals
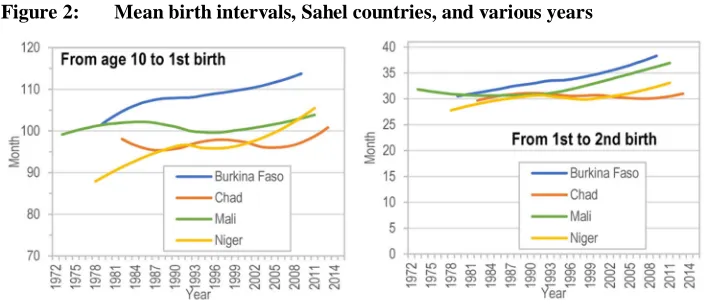
The homogeneity of the reproductive behaviors observed in the parity progression ratios offer a much more nuanced picture once the birth intervals are considered. Figure 2 tells a distinct story of the changes in fertility behaviors in the Sahel.
births have not declined anywhere. At the exception of this point, diversity has been prevailing in the region.
Between age 10 and the first birth, the mean birth intervals show that the onset of childbearing in the Sahel has remained distinct across countries. In the mid- and late 1970s, the first birth interval was higher in Burkina Faso and Mali (around 102 months, or 8.5 years) and lower by about 1 year in Niger. The estimates for Chad in the mid-and late 1980s suggest intervals closer to Niger. Interestingly, the length of the first birth interval has continued to increase in Burkina Faso, whereas it has stagnated in Mali. In the mid-2000s, women in Burkina Faso had their first birth 1.5 years later on average compared to the late 1970s, compared to less than half a year in Mali. Like in Mali, the first birth interval in Chad did not increase (the fluctuations in the series in Figure 2 are to be interpreted keeping in mind the lower number of surveys available (for details, see Figure A-6 in Appendix)). Finally, the age at first birth in Niger was the lowest in the late 1970s but has experienced a continuing increase and was about one year higher in the mid-2000s.
After the first birth interval, the differences between the four Sahelian countries are rather limited in the early years for which information is available (late 1970s to early 1980s). In all countries, the mean birth intervals reached a rather homogenous length of about 30 months. It is during the 1980s and early 1990s that the length of the mean birth intervals started to diverge. Birth intervals were extended the most in Burkina Faso, whereas fewer changes were recorded in Chad, Mali, and Niger. In the late 1990s, birth intervals started to progressively lengthen in Mali, however. A similar process is found in Niger in the early years of the new century. In Chad, the process is yet to start; birth intervals have remained stable.
Figure 2: (Continued)
3.3 A summary view of the changes
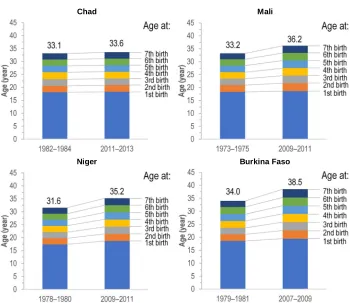
To synthetize the changes in each country, the mean birth intervals can be summed up starting from age 10. Figure 3 shows these synthetic profiles by country for the first three years at the beginning of the period of analysis and the last three years of observation. Countries are ordered by the increase in their mean age at the seventh birth, starting with Chad, where hardly any change was recorded, and ending with Burkina Faso, where the changes have been the largest.
Figure 3: Synthetic ‘profiles’ of the changes in the age at successive birth, Sahel countries, and various years
Chad Mali
Niger Burkina Faso
Chad is characterized by stability. For over 30 years, between the early 1980s and the early 2010s, the average age at the seventh child rose by only half a year. This minor rise was mostly due to the lengthening of the first birth intervals, as well as the sixth and seventh birth intervals.
In Mali, however, all birth intervals have contributed almost equally to the rise of the average age at the seventh birth. The age at the first birth remained fairly stable since the mid-1970s. Compared to the mid-1970s, women in Mali had their seventh child three years later at the end of the first decade of the 21st century.
In Niger, the average age at first birth increased by more than one year between the late 1970s and the end of the first decade of the 21st century. The length of the other birth intervals has increased by half a year at most, contributing all to push up almost equally the average age at the seventh birth to 35 years – that is, more than three years later compared to the late 1970s.
In the case of Burkina Faso, the average age at the seventh birth was more than four years higher at the end of the first decade of the 21st century, compared to the late 1970s and early 1980s. This rise resulted both from an increase in the age at first birth and a lengthening of all other birth intervals, but more particularly between the sixth and seventh births.
4. Discussion and conclusion
Countries of the Sahel are still experiencing among the highest levels of fertility in the world, resulting in extremely high population growth rates that present many challenges for development. Surprisingly, though, studies on fertility change in the Sahel have remained scarce. Most of the existing research has focused on the barriers to the decline of fertility, examining its proximate determinants. To the best of the author’s knowledge, almost no effort was made to investigate fertility change by parity in the countries of the region. Investigating comparative fertility change through the lens of parity progression ratios and birth intervals brings new findings.
The main findings from the study of the levels and trends in parity progression ratios and birth intervals in the Sahel can be summarized in a few words: Despite high and sometimes stable fertility levels, changes were indeed at work over the last 40 years in Sahelian countries. The analysis of the ‘quantum’ of fertility through the parity progression ratios reveals limited change in the transition to first, second, third, and fourth births. Women in the Sahel have continued to bear as many children as possible, without limiting their childbearing.
have been occurring later, and the age at which an average woman is bearing her seventh child has increased. The lengthening of the birth intervals has varied by parity and country, but generally the age at first birth contributed the most. The age at first birth is indeed closely related to the change in the age at marriage. Female marriage in the Sahel occurs at earlier ages (compared to other subregions in sub-Saharan Africa) and has increased only slowly (Hertrich 2017; UNPD 2017). Women in Niger, Mali, and Chad still marry at the earliest ages in regard to sub-Saharan Africa averages.2 It is therefore not surprising that the differences in the age at first birth have changed the least in these three countries.
The patterns of fertility change identified in this study are indeed much in line with government programs in place in the countries of the Sahel, where prevention of early marriage and adolescent fertility remains the main target, with only limited efforts going toward the transformation of social and cultural norms. The transformation of norms was largely left out of the Social and Behavior Change Communication programs and the Information, Education, and Communication programs in the region (Jean-Pierre Guengant,3 personal email communication, August 29, 2018).
Despite the findings of this study, one could argue that the choice of using estimates for all the years computed from a given survey, without excluding specific years (i.e., the most recent three or five years) due to quality issues, is returning a distorted picture of the changes at work and that the exclusion of these years would indeed bring alternative findings. Previous studies have shown problems in the quality of the information collected in birth history (Arnold 1990; Bhat 1995; Potter 1977; Schoumaker 2014). These problems are related to (1) the misreporting of dates of birth or of age of children and (2) the concentration of births in a period about 5 to 15 years before the survey due to the displacement of early births of older women closer to the date of the survey and the shifting of the most recent births backwards in time. These issues affect the parity progression ratios and mean birth intervals. The displacement of children’s birth dates would result in an artificial decline in the progression to a given birth in the years preceding a survey and an artificial increase of the birth interval.
These issues are partially found in the birth history data of the four Sahelian countries when series from two surveys overlap (see Figures A-1‒A-8 in Appendix). The progression to parity above 4 in Chad gives an illustration of the problem (Figure A-2), or the mean birth intervals in Mali, especially after the second birth, show a
2 The singulate mean age at marriage was 17.2 years in Niger in 2012; 18.5 years in Mali in 2013; and 18.8
years in Chad in 2014; whereas it reached already 19.5 in Burkina Faso in 2010 (UNPD 2017).
3 Jean-Pierre Guengant is emeritus director of research at the Institut de Recherche pour le Développement
systematic increase in the last two data points before the year of a survey (Figure A-7). These patterns are smoothed out once the series are blended in the local regression (see the smoothed black lines in Figures A-1‒A-8). The smoothed estimates of the parity progression ratios and mean birth intervals seem however to be influenced by the last data points. The exclusion of these last estimates would change the main findings, but only numerically, yet not affect the main narrative of the study and therefore the main conclusions.4
One could also object that the analysis rests on a somewhat distorted representation of the reproductive behaviors, blending the reproductive experiences of women reaching distinct parities ‒ none of whom would be subjected to the parity progression ratios, nor the birth intervals presented in the study. It is true that the parity progression ratios, the mean birth intervals, and the ages at successive births are blending the reproductive experiences of women reaching distinct parities and that women with a distinct number of children would have different lengths of birth intervals. For example, women with only four children may have had longer birth intervals than women who have gone on to bear seven children. Such distinction could indeed be useful to identify and understand better the changes at work in the countries of the region and should be investigated in future studies.
Compared to countries in other subregions of sub-Saharan Africa, Sahelian countries present distinct reproductive regimes consisting of early marriage, low desires to stop childbearing, and low contraceptive prevalence (Casterline and Agyei-Mensah 2017; Hertrich 2017; Tabutin and Schoumaker 2004). Despite these patterns, this study shows that countries of the Sahel are not an exception anymore in regard to the increasing lengths of birth intervals (Moultrie, Sayi, and Timæus 2012; Towriss and Timæus 2018). As shown above, the lengthening of birth intervals is also found in countries with high and stable total fertility rates. The cases of Niger and Mali over the recent years, as well as Burkina Faso during the 1970s and 1980s, illustrate that a lengthening of the birth intervals can indeed be associated with higher fertility levels, higher fertility desires, and low percentages of women expressing attitudes consistent with family-size limitation (Bongaarts and Casterline 2012; Moultrie, Sayi, and Timæus 2012).
This study shows that birth intervals have been lengthened in the Sahel, despite high and sometimes stable fertility levels. Over the last 40 years, women in the Sahel have either borne their first child at an increasingly later age (as in the case of Burkina Faso and Niger) or, when they have not done so, have had their successive children at
4
older ages (as in Mali and to a lesser extent in Chad). Some of these changes have not necessarily translated into a concomitant decline in the parity progression ratios and in the total number of births per woman. Indeed, the changes in the calendar of fertility (i.e., the delay in the onset of childbearing and lengthening of birth intervals) may contribute to a decline in total fertility rates, but this is offset to some extent by an increase in the age at which women have their last child (i.e., the effective stopping age). This increase is partly due to better health care, reduced incidence of birth complications at lower parities, and so reduced secondary sterility or subfecundity or miscarriage among conceptions at older ages.5 These factors may contribute to the increase in parity progression ratios at higher parities that is observed in some years (e.g., in Chad, Mali, and Niger in Figure A-2–A-4). For some time, total fertility rates can continue to remain stable and not embark on a decline. But a physiological limit would be ultimately reached once the interplay between the increased age at first birth and the lengthening of the successive birth intervals would result in pregnancies that would not be possible to have (because women would have reached the end of their reproductive lives). Whether such limit is reached sooner or later, and whether it is reached with or without revolutions in marriage, fertility preferences, and/or contraception prevalence, would affect the size and structure of the future population of the Sahel.
References
Arnold, F. (1990). Assessment of the quality of birth history data in the demographic and health surveys. In: Institute for Resource Development. An Assessment of
DHS-I Data Quality. Maryland: Institute for Resource Development/Macro
Systems, Inc. (Methodological Reports 1): 83–111.
Bhat, P.N.M. (1995). On the quality of the birth history data collected in National Family Health Survey, 1992‒93.Demography India 24(2): 245–258.
Bongaarts, J. (2017). Africa’s unique fertility transition. Population and Development
Review 43(Supplement: Fertility transition in sub-Saharan Africa): 39–58.
doi:10.1111/j.1728-4457.2016.00164.x.
Bongaarts, J. and Casterline, J. (2012). Fertility transition: Is sub-Saharan Africa different? Population and Development Review 38(Supplement: Population and Public Policy: Essays in Honor of Paul Demeny): 153–168. doi:10.1111/j.1728-4457.2013.00557.x.
Casterline, J.B. and Agyei-Mensah, S. (2017). Fertility desires and the course of fertility decline in sub-Saharan Africa. Population and Development Review
43(Supplement: Fertility transition in sub-Saharan Africa): 84–111.
doi:10.1111/padr.12030.
Garenne, M. (2016). La pression de la population dans les pays Sahéliens Francophones: Analyse des estimations et projections de population 1950‒2100. (Ferdi document de travail P168, October 2016).
Hertrich, V. (2017). Trends in age at marriage and the onset of fertility transition in sub-Saharan Africa. Population and Development Review 43(Fertility transition in sub-Saharan Africa): 112–137.doi:10.1111/padr.12043.
Hinde, A. (1998).Demographic methods. London: Arnold.
Issaka, H.M. and Guengant, J.-P. (2017). Countries with very slow or incipient fertility transitions. In: Groth, H. and May, J.F. (eds.). Africa’s population: In search of a
demographic dividend. Cham: Springer: 147–164.
doi:10.1007/978-3-319-46889-1_10.
May, J.F. and Guengant, J.-P. (2014). Les défis démographiques des pays Sahéliens.
Etudes. Revue de culture contemporaine 4206: 19–30.
May, J.F., Guengant, J.-P., and Barras, V. (2017). Demographic challenges of the Sahel countries. In: Groth, H. and May, J.F. (eds.). Africa’s population: In search of a
demographic dividend. Cham: Springer: 165–177.
doi:10.1007/978-3-319-46889-1_11.
Moultrie, T.A., Sayi, T.S., and Timæus, I.M. (2012). Birth intervals, postponement, and fertility decline in Africa: A new type of transition?Population Studies 66(3): 241–258.doi:10.1080/00324728.2012.701660.
Potter, J.E. (1977). Problems in using birth-history analysis to estimate trends in fertility.Population Studies 32(2): 335–364.doi:10.2307/2173921.
Potts, M., Gidi, V., Campbell, M., and Zureick, S. (2011). Niger: Too little, too late.
International Perspectives on Sexual and Reproductive Health 37(2): 95–101.
doi:10.1363/3709511.
Pullum, T.W. (2004). Natality: Measures based on censuses and surveys. In: Siegel, J.S. and Swanson, D.A. (eds.). The materials and methods of demography. Amsterdam: Elsevier Academic Press: 407–428. doi:10.1016/B978-012641955-9/50050-3.
Pullum, T.W. (2006). An assessment of age and date reporting in the Demographic and
Health Surveys, 1985–2003. Calverton: Demographic and Health Surveys
Project, ORC Macro.
Schoumaker, B. (2014). Quality and consistency of DHS fertility estimates, 1990 to 2012. Rockville: ICF International. (DHS Methodological Reports 12).
Shapiro, D. and Hinde, A. (2017). On the pace of fertility decline in sub-Saharan
Africa. Demographic Research 37(40): 1327–1338.
doi:10.4054/DemRes.2017.37.40.
Spoorenberg, T. (2010). Fertility transition in India between 1977 and 2004. Analysis using parity progression ratios. Population-E 65(2): 315–332.
doi:10.3917/pope.1002.0313.
Tabutin, D. and Schoumaker, B. (2004). The demography of sub-Saharan Africa from the 1950s to the 2000s. A survey of changes and a statistical assessment.
Population-E 59(3‒4): 455–555.doi:10.3917/pope.403.0455.
Towriss, C.A. and Timæus, I.M. (2018). Contraceptive use and lengthening of birth intervals in rural and urban Eastern Africa. Demographic Research 38(64): 2027–2052.doi:10.4054/DemRes.2018.38.64.
UNPD (United Nations Population Division) (2019).World population prospects: The
2019 revision. New York: United Nations, Department of Economic and Social
Affairs, Population Division.