VOLUME 41, ARTICLE 5, PAGES 103
-
124
PUBLISHED 10 JULY 2019
https://www.demographic-research.org/Volumes/Vol41/5/ DOI: 10.4054/DemRes.2019.41.5
Descriptive Finding
Does the association between children and
happiness vary by level of religiosity?
The evidence from Israel
J. Jona Schellekens
© 2019 J. Jona Schellekens.
This open-access work is published under the terms of the Creative Commons Attribution 3.0 Germany (CC BY 3.0 DE), which permits use, reproduction, and distribution in any medium, provided the original author(s) and source are given credit.
1 Introduction 104
2 Happiness and children 104
3 Data and methods 106
4 Results 112
5 Conclusion 118
6 Acknowledgements 118
Does the association between children and happiness vary by level of
religiosity? The evidence from Israel
J. Jona Schellekens1
Abstract
BACKGROUND
There is a widespread belief that parenthood makes people happier. However, research has shown mixed results on the association between happiness and fertility, finding evidence for both positive and negative consequences of having children. The relationship appears to be highly context-specific. This article investigates whether the relationship varies by level of religiosity. Mounting evidence suggests that there is a positive relationship between religiosity and fertility, suggesting that the religious will have a stronger positive relationship between number of children and happiness than those who are not religious.
OBJECTIVE
This study investigates whether the relationship between number of children and overall life satisfaction varies with the level of religiosity.
METHODS
Using a pooled file of the Israel Social Survey for 2002–2016, which includes more than 100,000 respondents, I estimated a linear regression model of overall life satisfaction as a function of the number of children and level of religiosity.
RESULTS
My results show that, contrary to expectations, religious Jews do not have a stronger positive relationship between number of children and overall life satisfaction. Among older respondents, Ultra-Orthodox Jews actually have a weaker relationship between number of children and overall life satisfaction than Jews who are not religious.
CONTRIBUTION
1. Introduction
There is a widespread belief that parenthood makes people happier (Hansen 2012; Kohler and Mencarini 2016). However, research has shown mixed results on the association between happiness and fertility, finding evidence for both positive and negative consequences of having children (e.g., Margolis and Myrskylä 2011). The association appears to vary with factors such as pre-parenthood lifestyle, the perceived importance of marriage and parenthood in society, the level of work–family conflict, the availability of formal childcare services, and welfare support systems (Aassve, Mencarini, and Sironi 2015; Glass, Simon, and Andersson 2016; Matysiak, Mencarini, and Vignoli 2016; Roeters, Mandemakers, and Voorpostel 2016; Vanassche, Swicegood, and Matthijs 2013). This study investigates whether the association between number of children and happiness varies by level of religiosity.
Mounting evidence suggests that there is a positive relationship between religiosity and fertility (e.g., Adsera 2006; Baudin 2015; Hayford and Morgan 2008; Neuman and Ziderman 1986; Okun 2017). It has been posited that when a religion supports pronatalist norms, the religious have a stronger positive relationship between number of children and happiness than those who are not religious (Cranney 2017). This article tests this hypothesis in Israel. Using a pooled and integrated file of the Israel Social Survey for 2002–2016, it shows that religious Jews do not have a stronger positive relationship between number of children and happiness than Jews who are not religious. Among older respondents, Ultra-Orthodox Jews actually have a weaker relationship between number of children and happiness than Jews who are not religious.
The next section reviews the literature on children and happiness with a focus on the moderating role of religiosity and on differences between countries. The third section describes the survey and the variables and methods used in the analysis, and the fourth section presents the results. The fifth and concluding section compares these results with those of previous research and discusses the validity of the results.
2. Happiness and children
Parenthood can be both rewarding and burdensome. To start with the latter, parenthood is associated with increased marital conflict, depression, decreased marital satisfaction, and decreased satisfaction with one’s financial situation (e.g., Balbo and Arpino 2016; Kravdal 2014; Nelson, Kushlev, and Lyubomirsky 2014; Pollman-Schult 2014; Pouwels 2011: 64–66).
family. However, as children grow older this conflict may lessen. Thus, it is important to control for stage of the life cycle. When parents grow older, children may care for parents in poor health or provide social protection in old age, as is often the case in developing countries (Margolis and Myrskylä 2011).
There are additional positive effects of having children. One of the most frequently cited reasons for having children is the expectation of emotional reward (Pollman-Schult 2014). Such a reward is expected to be greater for the first child, the motivation for second births being associated with providing companionship for the first child (Kohler, Behrman, and Skytthe 2005). A much less frequently cited reason for having children is to enhance one’s status and gain competitive advantage over significant others. In certain contexts, parenthood may increase social esteem (Nauck and Klaus 2007). Moreover, parents that produce many children may gain considerable prestige from their fertility and may have higher status than their less fertile neighbors (Hoffman, Thornton, and Manis 1978: 95). For example, high social status is attached to large families among Ultra-Orthodox Jews (Wieselberg 1992).
Religiosity may modify the relationship between children and happiness. According to one hypothesis (H1), when a religion supports pronatalist norms the religious will experience a stronger positive relationship between the number of children and happiness than those who are not religious (Cranney 2017). Only two previous studies have tested this hypothesis. Cranney (2017) uses data from the United States, whereas van Praag, Romanov, and Ferrer-i-Carbonell (2010) use data from Israel. Both studies conclude that the hypothesis fits the data. However, given the high social status attached to large families in their community, Ultra-Orthodox Jews with small families may be under social pressure to conform (McQuillan 2004). Thus, according to another hypothesis (H2), at lower parities the religious will have a weaker relationship between number of children and happiness than those who are not religious.
and liberal countries contributes less to happiness than in social-democratic countries. They do not find a significant difference between Mediterranean and social-democratic countries. Esping-Andersen (1999) omits Israel from his analysis. However, Gal (2010a, 2010b) has argued that the welfare regime in Israel shows a close affinity to the Mediterranean category.
3. Data and methods
The data for this study is from the Israel Social Survey (ISS). The ISS was designed to provide information on the well-being of the adult population and its living conditions. It is a repeated cross-sectional survey, with data available for the years 2002–2016. The sampling units are individuals in the population register. The respondents were interviewed in their homes. I used a pooled and integrated data set, which is available from the Israel Social Science Data Center and includes 109,160 respondents.
The percentage of large families is relatively high in Israel, making it an interesting place to investigate the association of happiness with number of children. Figure 1 shows trends in the total fertility rate by religion (State of Israel 1990: Table 3.17; and 2018: Table 3.13). In the 1960s the total fertility rate of Muslims reached a record high of more than nine births (Schellekens and Eisenbach 2002). Since then, Muslims have nearly completed the fertility transition. The rate for Jews conceals large differences by level of religiosity. Ultra-Orthodox Jews have more than six children, followed by other religious Jews, who have around four children, and less religious Jews, who have two to three children. With a total fertility rate of about two births, secular Jews are at the upper range of secular groups in more developed societies (Okun 2013).
Figure 1: The total fertility rate by religion, Israel 1955–2014
In colloquial terms, subjective well-being is sometimes labeled ‘happiness.’ Life satisfaction (overall judgment of one’s life) is a component of subjective well-being (Diener 2000). The ISS does not ask about subjective well-being, but only about life satisfaction. Thus, overall life satisfaction (OLS) is the outcome variable in the analysis. Respondents were asked: “Overall, how satisfied are you with your life?” There are four possible answers: ‘very satisfied’ = 4; ‘satisfied’ = 3; ‘not so satisfied’ = 2; or ‘not satisfied at all’ = 1.
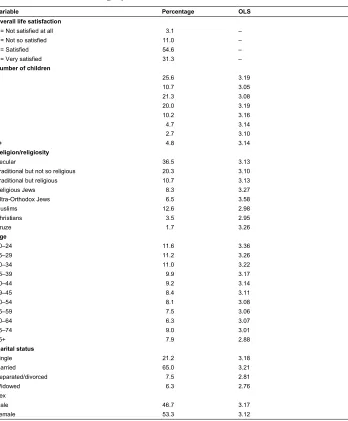
The key explanatory variable is the number of children the respondent has. Respondents (including men) were asked, “How many children have been born to you?” In the public use file of the ISS the number of children is coded as: none, one, two, three, four, five, six, and seven or more. The relationship between the number of children and OLS may not be linear (e.g., Kohler, Behrman, and Skytthe 2005; Stanca 2012). In the ISS, average OLS reaches a low with one child and a high with three children, after which it declines again (see Table 1). To cope with this lack of linearity I created seven indicator variables, ‘none’ being the reference category.
Religion may affect OLS (Mallard, Lance, and Michalos 1997). Therefore, I control for religion. There are four religious groups in Israel: Jews, Muslims, Christians, and Druze. Almost all Muslims in Israel belong to the Sunni branch of Islam and speak Palestinian dialects of Arabic. The Druze also speak Arabic, but not all Christians, some of whom are from the former Soviet Union.
The positive association between religiosity and happiness is well documented (e.g., Lim and Putnam 2010; Sander 2017). Levin (2013a, 2013b, 2014) and van Praag, Romanov, and Ferrer-i-Carbonell (2010) report a positive association between religiosity and OLS among Israeli Jews. The ISS asked Jewish respondents to define themselves as ‘Ultra-Orthodox,’ ‘religious,’ ‘traditional but religious,’ ‘traditional but not so religious’ or ‘nonreligious/secular.’ The difference in OLS between the latter three categories is very small. Therefore, I have combined them into one category, which for the sake of simplicity I refer to below as the ‘nonreligious’.
The difference in fertility by level of religiosity among Muslims is relatively small (Okun 2013). Moreover, there are not enough Christians or Druze in the survey to estimate their OLS by level of religiosity. Therefore, I did not model OLS among non-Jews by level of religiosity.
Table 1: Descriptive statistics for categorical variables and average OLS score for each category
Variable Percentage OLS
Overall life satisfaction
1 = Not satisfied at all 3.1 –
2 = Not so satisfied 11.0 –
3 = Satisfied 54.6 –
4 = Very satisfied 31.3 –
Number of children
0 25.6 3.19
1 10.7 3.05
2 21.3 3.08
3 20.0 3.19
4 10.2 3.16
5 4.7 3.14
6 2.7 3.10
7+ 4.8 3.14
Religion/religiosity
Secular 36.5 3.13
Traditional but not so religious 20.3 3.10
Traditional but religious 10.7 3.13
Religious Jews 8.3 3.27
Ultra-Orthodox Jews 6.5 3.58
Muslims 12.6 2.98
Christians 3.5 2.95
Druze 1.7 3.26
Age
20–24 11.6 3.36
25–29 11.2 3.26
30–34 11.0 3.22
35–39 9.9 3.17
40–44 9.2 3.14
45 –
49 8.4 3.11
50–54 8.1 3.08
55–59 7.5 3.06
60–64 6.3 3.07
65–74 9.0 3.01
75+ 7.9 2.88
Marital status
Single 21.2 3.18
Married 65.0 3.21
Separated/divorced 7.5 2.81
Widowed 6.3 2.76
Sex
Male 46.7 3.17
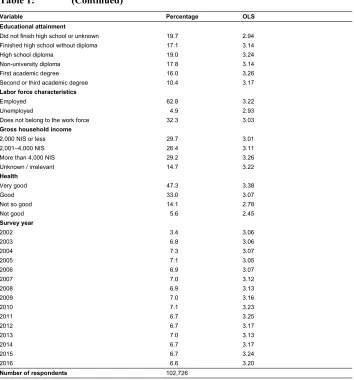
Table 1: (Continued)
Variable Percentage OLS
OLS is a function of age. Age is coded as: 20–24, 25–29, 30–34, 35–39, 40–44, 45–49, 50–54, 55–59, 60–64, 65–74, and 75 and above, 20–24 being the reference category. Considerable support has been found for the thesis that marriage is associated with higher levels of personal well-being (e.g., Aassve, Goisis, and Sironi 2012; Soons, Liefbroer, and Kalmijn 2009; Stack and Eshleman 1998; Zimmermann and Easterlin 2006). Marital status is coded as single, married, separated or divorced, and widowed.
Educational attainment
Did not finish high school or unknown 19.7 2.94
Finished high school without diploma 17.1 3.14
High school diploma 19.0 3.24
Non-university diploma 17.8 3.14
First academic degree 16.0 3.26
Second or third academic degree 10.4 3.17
Labor force characteristics
Employed 62.8 3.22
Unemployed 4.9 2.93
Does not belong to the work force 32.3 3.03
Gross household income
2,000 NIS or less 29.7 3.01
2,001–4,000 NIS 26.4 3.11
More than 4,000 NIS 29.2 3.26
Unknown / irrelevant 14.7 3.22
Health
Very good 47.3 3.38
Good 33.0 3.07
Not so good 14.1 2.78
Not good 5.6 2.45
Survey year
2002 3.4 3.06
2003 6.8 3.06
2004 7.3 3.07
2005 7.1 3.05
2006 6.9 3.07
2007 7.0 3.12
2008 6.9 3.13
2009 7.0 3.16
2010 7.1 3.23
2011 6.7 3.25
2012 6.7 3.17
2013 7.0 3.13
2014 6.7 3.17
2015 6.7 3.24
2016 6.6 3.20
There is a strong association between health and happiness (e.g., Ngamaba, Panagioti, and Armitage 2017). In the ISS, respondents were asked, “How is your health, overall?” There are four possible answers: ‘very good,’ ‘good,’ ‘not so good,’ and ‘not good at all’, ‘very good’ being the reference category. Only a very small number of respondents failed to answer this question. I omitted these from the analysis.
Several previous studies have shown income and happiness to be correlated (e.g., Diener et al. 1993; Frijters, Haisken-DeNew, and Shields 2004). Therefore, I control for gross average household income. Respondents were asked “What was the total gross income of all members of the household from all sources: work, pensions, support payments, rents, etc.?” The answers are in the local currency of New Israeli Shekels (NIS). (In 2002 one US dollar could be exchanged for 4.89 NIS and in 2016 for 3.84 NIS.) The result has been coded as ‘2,000 NIS or less,’ ‘2,001–4,000 NIS,’ ‘More than 4,000 NIS,’ or ‘Unknown/Irrelevant.’ Quite a few respondents did not answer the question about gross household income (see Table 1). Therefore, the analysis includes a variable indicating whether the answer is unknown or irrelevant.
Education is positively related to happiness (e.g., Witter et al. 1984). Respondents were asked “What is the highest certificate or degree that <name of respondent> has received?” I have recoded the answers as follows: ‘Did not finish high school or unknown,’ ‘Finished high school without diploma,’ ‘Finished high school with diploma,’ ‘Non-university diploma,’ ‘First academic degree,’ and ‘Second or third academic degree.’
Past research has shown that unemployment has a large negative effect on happiness (e.g., Clark and Oswald 1994). The ISS includes a variable indicating whether the respondent is ‘Employed,’ ‘Not employed,’ or ‘Does not belong to the labor force.’ Eleven percent of those who did not belong to the labor force were students and 26% were married women below the age of 65. I omitted the small number of respondents who did not answer the question.
Finally, I used year-fixed effects to absorb variation between survey years.
Following Margolis and Myrskylä (2011), I employed standard ordinary least squares regression for ease of interpretability. Following van Praag, Romanov, and Ferrer-i-Carbonell (2010), I added interactions between the number of children and level of religiosity to test the hypothesis that the effect of fertility on OLS varies with the level of religiosity.
4. Results
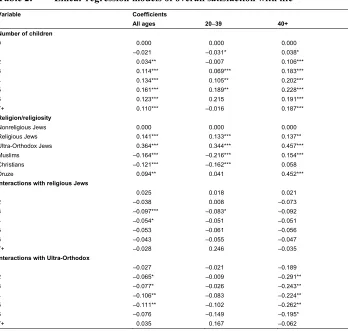
Table 1 presents descriptive statistics of the variables used in the analysis. Table 2 presents regression coefficients of the effect of the number of children and interactions of the number of children with level of religiosity on OLS in models that control for several variables (see first model in Table 2).
Table 2: Linear regression models of overall satisfaction with life
Variable Coefficients
All ages 20–39 40+ Number of children
0 0.000 0.000 0.000
1 –0.021 –0.031* 0.038*
2 0.034** –0.007 0.106***
3 0.114*** 0.069*** 0.183***
4 0.134*** 0.105** 0.202***
5 0.161*** 0.189** 0.228***
6 0.123*** 0.215 0.191***
7+ 0.110*** –0.016 0.187***
Religion/religiosity
Nonreligious Jews 0.000 0.000 0.000
Religious Jews 0.141*** 0.133*** 0.137**
Ultra-Orthodox Jews 0.364*** 0.344*** 0.457***
Muslims –0.164*** –0.216*** 0.154***
Christians –0.121*** –0.162*** 0.058
Druze 0.094** 0.041 0.452***
Interactions with religious Jews
1 0.025 0.018 0.021
2 –0.038 0.008 –0.073
3 –0.097*** –0.083* –0.092
4 –0.054* –0.051 –0.051
5 –0.053 –0.061 –0.056
6 –0.043 –0.055 –0.047
7+ –0.028 0.246 –0.035
Interactions with Ultra-Orthodox
1 –0.027 –0.021 –0.189
2 –0.065* –0.009 –0.291**
3 –0.077* –0.026 –0.243**
4 –0.106** –0.083 –0.224**
5 –0.111** –0.102 –0.262**
6 –0.076 –0.149 –0.195*
Table 2: (Continued)
Variable Coefficients
All ages 20–39 40+ Interactions with Muslims
1 0.019 0.033 –0.191**
2 0.025 0.054* –0.184**
3 0.033 0.066* –0.338***
4 0.029 0.028 –0.249***
5 0.048 –0.067 –0.210***
6 0.131*** –0.027 –0.153**
7+ 0.240*** –0.120 –0.037
Interactions with Christians
1 0.073* 0.039 –0.048
2 –0.013 –0.036 –0.158**
3 0.029 0.110 –0.156*
4 0.073 0.381** –0.127*
5 0.079 –0.079 –0.081
6 0.140 –0.418 –0.012
7+ 0.393*** 0.160 0.222*
Interactions with Druze
1 0.059 0.108 –0.405*
2 0.122* 0.245*** –0.426**
3 0.048 –0.002 –0.203
4 0.121* 0.072 –0.196
5 0.026 –0.280 –0.263*
6 0.076 0.450 –0.292**
7+ 0.307*** 0.028 –0.041
Age
20–24 0.000 0.000
25–29 –0.154*** –0.147***
30–34 –0.237*** –0.220***
35–39 –0.285*** –0.260***
40–44 –0.302*** 0.000
45 –
49 –0.286*** 0.015
50–54 –0.274*** 0.028**
55–59 –0.268*** 0.034**
60–64 –0.229*** 0.075***
65–74 –0.190*** 0.121***
75+ –0.146*** 0.173***
Marital status
Single –0.176*** –0.192*** –0.171***
Married 0.000 0.000 0.000
Separated/divorced –0.268*** –0.295*** –0.259***
Widowed –0.223*** –0.207* –0.226***
Sex
Male 0.000 0.000 0.000
Table 2: (Continued)
Variable Coefficients
All ages 20–39 40+ Educational attainment
Did not finish high school or unknown 0.000 0.000 0.000
Finished high school (no diploma) 0.068*** 0.070*** 0.080***
High school diploma 0.103*** 0.132*** 0.078***
Non-university diploma 0.069*** 0.087*** 0.064***
First degree 0.104*** 0.124*** 0.103***
Second or third degree 0.088*** 0.153*** 0.069***
Labor force characteristics
Employed 0.000 0.000 0.000
Unemployed –0.164*** –0.147*** –0.185***
Does not belong to the work force 0.036*** 0.057*** 0.014
Gross household income
2,000 NIS or less 0.000 0.000 0.000
2,001–4,000 NIS 0.084*** 0.061*** 0.099***
More than 4,000 NIS 0.179*** 0.131*** 0.208***
Unknown / irrelevant 0.123*** 0.108*** 0.131***
Health
Very good 0.000 0.000 0.000
Good –0.287*** –0.297*** –0.275***
Not so good –0.542*** –0.567*** –0.527***
Not good –0.865*** –0.827*** –0.854***
Survey year
2002 0.000 0.000 0.000
2003 –0.023 –0.044* –0.008
2004 –0.013 –0.028 –0.004
2005 –0.026 –0.046* –0.014
2006 –0.012 –0.015 –0.013
2007 0.027* 0.026 0.021
2008 0.036** 0.027 0.038*
2009 0.045** 0.045* 0.038*
2010 0.092*** 0.089*** 0.087***
2011 0.106*** 0.090*** 0.112***
2012 0.017 0.023 0.003
2013 0.007 –0.016 0.016
2014 0.016 –0.005 0.023
2015 0.061*** 0.024 0.082***
2016 0.029* –0.013 0.049**
Constant 3.373*** 3.416*** 2.973***
Number of respondents 102,726 44,932 57,794
R2 0.214 0.177 0.220
Note: * p < .05 ** p < .01 *** p < .001.
coefficients of the variables indicating the number of children, followed by adding marital status and socioeconomic variables (education, labor-force characteristics, and income). Adding health and survey year to the model only modifies the coefficients to a small extent (nested models not shown).
A preliminary analysis included two variables indicating whether a Jewish respondent was ‘traditional but religious’ or ‘traditional but not so religious.’ However, none of the interactions of these variables with the number of children had a significant effect (result not shown). Therefore, I combined these two categories with that of secular Jews.
The relationship between OLS and number of children may change with stage of the life cycle, because the demands of parenthood change as children mature (Margolis and Myrskylä 2011: 16–17). Therefore, I estimated separate models for two broad age groups: 20–39 and above 40 (see second and third models in Table 2). Note that in all the models the main effect represents the effect of the number of children on OLS among the omitted category, i.e., Jews who are not religious. To obtain the effect of the number of children on OLS among other religious groups, the interaction effect needs to be added. I will only discuss the results for the second and third models.
OLS among nonreligious Jews aged 20–39 decreases after the first child, but increases afterwards with number of children. Margolis and Myrskylä (2011: Figure 7a) observe a similar decline after the first child in other countries. However, the relationship among younger nonreligious Jews after the second child does not resemble that observed in other countries (see second model in Table 2).
Figure 3: The net effect of number of children on overall life satisfaction by religion and level of religiosity among respondents at age 20–39, Israel 2002–2016
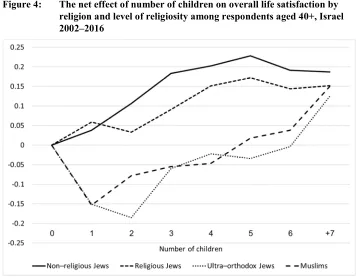
At older ages (40 and above) the association between number of children and OLS is positive among nonreligious Jews (see third model in Table 2). Nonreligious Jews with one child are slightly more satisfied than those without a child. Each child adds to their OLS, reaching a peak with five children. The relationship among nonreligious Jews above age 40 more closely resembles that observed by Margolis and Myrskylä (2011: Figure 7b) in Mediterranean (and former socialist) countries than in social democratic, liberal, or conservative countries.
None of the interactions for religious Jews are significant, suggesting that there are no major differences between religious and nonreligious Jews. However, the relationship among Ultra-Orthodox Jews is weaker than that among nonreligious Jews. The difference with nonreligious Jews is significant for two to six children. The hypothesis that there is more social pressure to continue childbearing among Ultra-Orthodox Jews (H2) is consistent with this finding. As with Ultra-Orthodox Jews, children also contribute less to the OLS of older Muslims. The interaction effect is significant up to the sixth child. After the first child, each child adds to their OLS, perhaps because children care for parents in poor health or provide social protection in old age (Margolis and Myrskylä 2011).
5. Conclusion
Theory predicts that when a religion supports pronatalist norms, then the religious will experience a stronger positive relationship between number of children and happiness than those who are not religious (Cranney 2017). Using the General Social Survey for 1972–2012, Cranney (2017) finds that in the United States the negative association between children and happiness is lessened for the religious. The religious population in his study consists mostly of Christians. Using the 2006 Israel Social Survey, van Praag, Romanov, and Ferrer-i-Carbonell (2010) investigate variation in the relationship between happiness and number of children by level of religiosity among Jews. They conclude that “secular families are less happy than orthodox families with an equal number of children” (van Praag, Romanov, and Ferrer-i-Carbonell 2010: 1017). Using a much larger pooled and integrated file of the Israel Social Survey for 2002–2016, this article shows that children do not contribute more to the overall life satisfaction of religious Jews.
Religious differences in the contribution of children to overall life satisfaction are largest among older respondents. In particular, small families contribute less to the overall life satisfaction of older Ultra-Orthodox Jews than they do to that of older nonreligious Jews. The high social status attached to large families among Ultra-Orthodox Jews may explain this. This could also explain why religious differences are largest among older respondents. At this stage of the life cycle it is too late to close the gap between ideal and actual family size.
However, there are also caveats. Like most previous research, I used a cross-sectional approach. Thus, my results may suffer from potential bias caused by endogeneity of childbearing behavior (e.g., Baetschmann, Staub, and Studer 2016; Cetre, Clark, and Senik 2016; Kravdal 2014; Le Moglie, Mencarini, and Rapallini 2015; Parr 2010). To overcome this drawback, Kohler, Behrman, and Skytthe (2005) conducted a twin study, finding that becoming a parent contributes positively to parents’ OLS. Other coefficients may also be biased because of reverse causality; for example, between marital status and OLS (e.g., Stutzer and Frey 2006) and between health and OLS (e.g., Diener et al. 2017).
6. Acknowledgements
References
Aassve, A., Goisis, A., and Sironi, M. (2012). Happiness and childbearing across Europe. Social Indicators Research 108(1): 65–86. doi:10.1007/s11205-011-9866-x.
Aassve, A., Mencarini, L., and Sironi, M. (2015). Institutional change, happiness, and fertility.European Sociological Review 31(6): 749–765.doi:10.1093/esr/jcv073. Adsera, A. (2006). Marital fertility and religion in Spain, 1985 and 1999. Population
Studies 60(2): 205–221.doi:10.1080/00324720600684817.
Baetschmann, G., Staub, K.E., and Studer, R. (2016). Does the stork deliver happiness? Parenthood and life satisfaction. Journal of Economic Behavior and
Organization 130: 242–260.doi:10.1016/j.jebo.2016.07.021.
Balbo, N. and Arpino, B. (2016). The role of family orientations in shaping the effect of fertility on subjective well-being: A propensity score matching approach.
Demography 53(4): 955–978.doi:10.1007/s13524-016-0480-z.
Baudin, T. (2015). Religion and fertility: The French connection. Demographic
Research 32(13): 397–420.doi:10.4054/DemRes.2015.32.13.
Cetre, S., Clark, A.E., and Senik, C. (2016). Happy people have children: Choice and self-selection into parenthood.European Journal of Population 32(3): 445–473.
doi:10.1007/s10680-016-9389-x.
Clark, A.E. and Oswald, A. (1994). Unhappiness and unemployment. Economic
Journal 104(424): 648–659.doi:10.2307/2234639.
Cranney, S. (2017). Is there a stronger association between children and happiness among the religious? Religion as a moderator in the fertility/happiness relationship. Journal of Happiness Studies 18(6): 1713–1727. doi:10.1007/ s10902-016-9798-x.
Diener, E. (2000). Subjective well-being: The science of happiness and a proposal for a national index. American Psychologist 55(1): 34–43. doi:10.1037//0003-066X. 55.1.34.
Diener, E., Pressman, S.D., Hunter, J., and Delgadillo-Chase, D. (2017). If, why, and when subjective well-being influences health, and future needed research.
Applied Psychology: Health and Well-Being 9(2): 133–167. doi:10.1111/
Diener, E., Sandvik, E., Seidlitz, L., and Diener, M. (1993). The relationship between income and subjective well-being: Relative or absolute? Social Indicators
Research 28(3): 195–223.doi:10.1007/BF01079018.
Esping-Andersen, G. (1999).Social foundations of postindustrial economies. Oxford: Oxford University Press.doi:10.1093/0198742002.001.0001.
Frijters, P., Haisken-DeNew, J.P., and Shields, M.A. (2004). Money does matter! Evidence from increasing real income and life satisfaction in East Germany following reunification. American Economic Review 94(3): 730–740.
doi:10.1257/0002828041464551.
Gal, J. (2010a). Is there an extended family of Mediterranean welfare states?Journal of
European Social Policy 20(4): 283–300.doi:10.1177/0958928710374374.
Gal, J. (2010b). Exploring the extended family of Mediterranean welfare states, or: Did Beveridge and Bismarck take a Mediterranean cruise together? In: Ajzenstadt, M. and Gal, J. (eds.). Children, gender and families in Mediterranean welfare
states. Dordrecht: Springer: 77–101.doi:10.1007/978-90-481-8842-0_4.
Glass, J., Simon, R.W., and Andersson, M.A. (2016). Parenthood and happiness: Effects of work-family reconciliation policies in 22 OECD countries.American
Journal of Sociology 122(3): 886–929.doi:10.1086/688892.
Hansen, T. (2012). Parenthood and happiness: A review of folk theories versus empirical evidence. Social Indicators Research 108(1): 29–64. doi:10.1007/ s11205-011-9865-y.
Hayford, S.R. and Morgan, S.P. (2008). Religiosity and fertility in the United States: The role of fertility intentions. Social Forces 86(3): 1163–1188. doi:10.1353/ sof.0.0000.
Hoffman, L.W., Thornton, A., and Manis, J.D. (1978). The value of children to parents in the United States. Journal of Population 1(2): 91–131. doi:10.1007/BF012 77597.
Keysar, A. and DellaPergola, S. (2018). Demographic and religious dimensions of Jewish identification in the US and Israel: Millennials in generational perspective. Journal of Religion and Demography 6(1): 149–188.doi:10.1163/ 2589742X-00601004.
Kohler, H.-P., Behrman, J.R., and Skytthe, A. (2005). Partner + children = happiness? The effects of partnerships and fertility on well-being. Population and
Development Review 31(3): 407–445.doi:10.1111/j.1728-4457.2005.00078.x.
Kravdal, Ø. (2014). The estimation of fertility effects on happiness: Even more difficult than usually acknowledged. European Journal of Population 30(3): 263–290.
doi:10.1007/s10680-013-9310-9.
Le Moglie, M., Mencarini, L., and Rapallini, C. (2015). Is it just a matter of personality? On the role of subjective well-being in childbearing behavior.
Journal of Economic Behavior and Organization 117: 453–475. doi:10.1016/
j.jebo.2015.07.006.
Levin, J. (2013a). Religious observance and well-being among Israeli Jewish adults: Findings from the Israel Social Survey. Religions 4(4): 469–484. doi:10.3390/ rel4040469.
Levin, J. (2013b). Religious behavior, health, and well-being among Israeli Jews: Findings from the European Social Survey. Psychology of Religion and
Spirituality 5(4): 272–282.doi:10.1037/a0032601.
Levin, J. (2014). Religion and happiness among Israeli Jews: Findings from the ISSP Religion III Survey.Journal of Happiness Studies 15(3): 593–611.doi:10.1007/ s10902-013-9437-8.
Lim, C. and Putnam, R.D. (2010). Religion, social networks, and life satisfaction.
American Sociological Review 75(6): 914–933. doi:10.1177/0003122410386
686.
Mallard, A.G.C., Lance, C.E., and Michalos, A.C. (1997). Culture as a moderator of overall life satisfaction: Life facet satisfaction relationships. Social Indicators
Research 40(3): 259–284.doi:10.1023/A:1006812301761.
Margolis, R. and Myrskylä, M. (2011). A global perspective on happiness and fertility.
Population and Development Review 37(1): 29–56. doi:10.1111/j.1728-4457.
2011.00389.x.
Matysiak, A., Mencarini, L., and Vignoli, D. (2016). Work–family conflict moderates the relationship between childbearing and subjective well-being. European
Journal of Population 32(3): 355–379.doi:10.1007/s10680-016-9390-4.
McQuillan, K. (2004). When does religion influence fertility? Population and
Nauck, B. and Klaus, D. (2007). The varying value of children: Empirical results from eleven societies in Asia, Africa and Europe.Current Sociology 55(4): 487–503.
doi:10.1177/0011392107077634.
Nelson, S.K., Kushlev, K., and Lyubomirsky, S. (2014). The pains and pleasures of parenting: When, why, and how is parenthood associated with more or less well-being?Psychological Bulletin 140(3): 846–895.doi:10.1037/a0035444.
Neuman, S. and Ziderman, A. (1986). How does fertility relate to religiosity: Survey evidence from Israel.Sociology and Social Research 70(2): 178–180.
Ngamaba, K.H., Panagioti, M., and Armitage, C.J. (2017). How strongly related are health status and subjective well-being? Systematic review and meta-analysis.
European Journal of Public Health 27(5): 879–885.doi:10.1093/eurpub/ckx081.
Okun, B.S. (2013). Fertility and family behavior in Israel: Diversity, change and stability. Demographic Research 28(17): 457–504. doi:10.4054/DemRes.2013. 28.17.
Okun, B.S. (2017). Religiosity and fertility: Jews in Israel. European Journal of
Population 33(4): 475–507.doi:10.1007/s10680-016-9409-x.
Parr, N. (2010). Satisfaction with life as an antecedent of fertility: Partner + happiness = children? Demographic Research 22(21): 635–662. doi:10.4054/DemRes.2010. 22.21.
Pollman-Schutt, M. (2014). Parenthood and life satisfaction: Why don’t children make people happy? Journal of Marriage and Family 76(2): 319–336. doi:10.1111/ jomf.12095.
Pouwels, B.J. (2011). Work, family, and happiness: Essays on interdependencies within families, life events, and time allocation decisions [PhD thesis]. Utrecht: Utrecht University.
Roeters, A., Mandemakers, J.J., and Voorpostel, M. (2016). Parenthood and well-being: The moderating role of leisure and paid work.European Journal of Population
32(3): 381–401.doi:10.1007/s10680-016-9391-3.
Sander, W. (2017). Religion, religiosity, and happiness. Review of Religious Research
59(2): 251–262.doi:10.1007/s13644-017-0285-6.
Schellekens, J. and Eisenbach, Z. (2002). The predecline rise in Israeli Moslem fertility.
Economic Development and Cultural Change 50(3): 541–555. doi:10.1086/
Soons, J.P.M., Liefbroer, A.C., and Kalmijn, M. (2009). The long-term consequences of relationship formation for subjective well-being. Journal of Marriage and
Family 71(5): 1254–1270.doi:10.1111/j.1741-3737.2009.00667.x.
Stack, S. and Eshleman, J.R. (1998). Marital status and happiness: A 17-nation study.
Journal of Marriage and Family 60(2): 527–536.doi:10.2307/353867.
Stanca, L. (2012). Suffer the little children: Measuring the effects of parenthood on well-being worldwide.Journal of Economic Behavior and Organization 81(3): 742–750.doi:10.1016/j.jebo.2010.12.019.
State of Israel (1990). Statistical abstract of Israel 41. Jerusalem: Central Bureau of Statistics.
State of Israel (2018). Statistical abstract of Israel 69. Jerusalem: Central Bureau of Statistics.
Stutzer, A. and Frey, B.S. (2006). Does marriage make people happy, or do happy people get married? Journal of Socio-Economics 35(2): 326–347.doi:10.1016/ j.socec.2005.11.043.
Van Praag, B.M.S., Romanov, D., and Ferrer-i-Carbonell, A. (2010). Happiness and financial satisfaction in Israel: Effects of religiosity, ethnicity, and war.Journal
of Economic Psychology 31(6): 1008–1020.doi:10.1016/j.joep.2010.08.008.
Vanassche, S., Swicegood, G., and Matthijs, K. (2013). Marriage and children as a key to happiness? Cross-national differences in the effects of marital status and children on well-being. Journal of Happiness Studies 14(2): 501–524.
doi:10.1007/s10902-012-9340-8.
Weinreb, A. and Blass, N. (2018). Trends in religiosity among the Jewish population in Israel. Jerusalem: Taub Center for Social Policy Studies in Israel (Policy Paper 02.2018).http://taubcenter.org.il/wp-content/files_mf/trendsinreligiosity.pdf. Wieselberg, H. (1992). Family therapy and Ultra-Orthodox Jewish families: A
structural approach. Journal of Family Therapy 14(3): 305–329. doi:10.1046/ j..1992.00462.x.
Witter, R.A., Okun, M.A., Stock, W.A., and Haring, M.J. (1984). Education and subjective well-being: A meta-analysis. Educational Evaluation and Policy
Analysis 6(2): 165–173.doi:10.3102/01623737006002165.


![Cytochrome P450 Monooxygenase Mediated Metabolic Utilization of Benzo[a]Pyrene by Aspergillus Species](data:image/gif;base64,R0lGODlhAQABAIAAAP///wAAACH5BAEAAAAALAAAAAABAAEAAAICRAEAOw==)