135
TRENDS, DEVELOPMENTS AND FIELD EXPERIENCES IN
THE USE OF MEMBRANE TECHNOLOGIES
TO TREAT “MARGINAL WATERS”
J.A. Redondo
Global Project Manager, Dow Deutschland Inc., Werk Rheinmünster, Liquid Separations, Technical Service and Development. Author to whom the correspondence should be addressed. POB 20, 77834 Rheinmünster, Germany. Tel.: 7227-913604, Fax:
+49-7227-913708
Abstract
As a consequence of continuous growth in population, in standards of life and in industrial development, stress on water supplies is steadily increasing in the Middle East. Therefore a need to use raw waters of lower quality (also called “marginal waters”) has developed. In the case of Israel, the government has issued new large scale programs to recover and reuse treated municipal waste waters, rehabilitate salinated and contaminated wells and desalinate brackish and marginal water sources.
This paper presents trends for the above type of treatments and discusses alternatives and problems seen in implementing some of the possibilities. Benefits and problems encountered in “real-life” application of modern membrane technologies are presented at the example of 4 case histories on industrial size and pilot plants for reverse osmosis (RO) or nanofiltration (NF) treatment. Feed waters included are industrial, municipal and agricultural effluents as well as highly contaminated surface and well waters. For some of the cases, economic figures are also presented. Based on the experiences given in the case histories, conclusions for the selection of feed waters and for future technical concepts are drawn.
1 Introduction
Some of the countries of the Middle East, including Israel, are experiencing a continuous growth in population, in the standards of life and in industrial development. These factors have tended to increase water consumption and the stress on water supplies. The water situation in this region is already precarious. Renewable water resources per capita have seen a reduction from about 3600 m3 to less than 700 m3. Thus, water has to be considered as a limited resource.
136
2 New options for water treatment
When water resources are scarce, marginal waters with high fouling tendency or sea water resources can be used. Waters with high fouling tendency include industrial, agricultural and municipal effluents as well as contaminated surface and well waters. Another option is to use sea water. Marginal waters are difficult to treat due to the fouling problems that can occur with insufficient pretreatment in a membrane plant. Some large installations use Integrated Membrane Systems (IMS), combining MF or UF with RO or NF, to achieve a better quality for the RO/NF in terms of turbidity, SDI and microbiology control resulting in a lower fouling rate for the RO/NF membranes resulting in an operation with substantially better plant availability and lower unit water production costs. But, extensive pretreatment, as achieved with integrated membrane systems generally increases pretreatment costs. The following options exist:
conventional pretreatment and reverse osmosis (RO) or nanofiltration (NF)
integrated membrane systems (IMS): continuous microfiltration (CMF) or ultrafiltration (UF) in combination with reverse osmosis (RO) or nanofiltration (NF)
For IMS (examples will be shown in case histories 1 and 2), the trend is to combine microfiltration and/or ultrafiltration systems with reverse osmosis and nanofiltration systems. In our experience, the membrane types mostly combined with reverse osmosis are:
e.g. MEMCOR or ZEEWEED for continuous microfiltration (CMF),
e.g. NORIT / X FLOW, AQUASOURCE and ZEE WEED-UF for ultrafiltration (UF) Most frequent membrane types following microfiltration or ultrafiltration are conventional RO elements, fouling resistant elements, nanofiltration and low energy RO elements
The reasons why the trend is tending IMS are mainly feasibility, process reliability, plant availability, modularity, relative insensitivity in cases of raw water changes and reduced operating costs. CMF and UF allows better control of reverse osmosis feed water quality, resulting in less frequent cleaning requirements for the RO membranes. Microfiltration and UF allow the membrane inventory of a RO plant to be reduced by some 20% (sometimes more). Microfiltration membranes have simplified the RO pretreatment process resulting in lowering the operating costs of the plants. CMF and UF are proven to be more economical than conventional pretreatment on whole life costs, especially when the feed water quality is highly loaded in suspended solids and colloids.
137
addition of coagulant or powder activated carbon (pAC) may have to be used to enhance the membrane processes effectiveness [10, 11]. The plants at West Basin (California) using CMF as pretreatment for RO are operational since 1997; there, CMF has simplified the wastewater reclamation process by eliminating the lime handling resulting in lower chemical requirements and eliminating the production and disposal or solid waste sludge.
The decision to treat marginal water will be based on economical evaluation, which heaviliy rely on technical feasibility but also on socio-economical, geographical and political factors. Basically the optimum between conventional pretreament and polishing treatment membrane system costs has to be found.
3 Case histories
3.1 Case history 1: Industrial Effluent Treatment
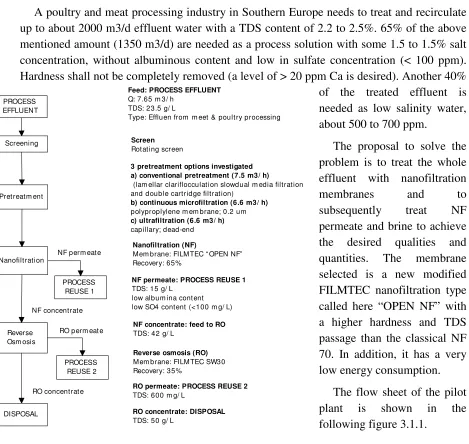
A poultry and meat processing industry in Southern Europe needs to treat and recirculate up to about 2000 m3/d effluent water with a TDS content of 2.2 to 2.5%. 65% of the above mentioned amount (1350 m3/d) are needed as a process solution with some 1.5 to 1.5% salt concentration, without albuminous content and low in sulfate concentration (< 100 ppm). Hardness shall not be completely removed (a level of > 20 ppm Ca is desired). Another 40% of the treated effluent is needed as low salinity water, about 500 to 700 ppm.
The proposal to solve the problem is to treat the whole effluent with nanofiltration
membranes and to
subsequently treat NF permeate and brine to achieve the desired qualities and quantities. The membrane selected is a new modified FILMTEC nanofiltration type called here “OPEN NF” with a higher hardness and TDS passage than the classical NF 70. In addition, it has a very low energy consumption.
[image:3.595.51.520.269.713.2]The flow sheet of the pilot plant is shown in the following figure 3.1.1.
Figure 3.1.1: Flow sheet of water treatment process at meat & poultry pilot plant
Screening
Pretreatm ent
Feed: PROCESS EFFLUENT Q: 7.65 m 3/ h
TDS: 23.5 g/ L
Type: Effluen from m eet & poultry processing
3 pretreatment options investigated a) conventional pretreatment (7.5 m3/ h)
(lam ellar clariflocculation slowdual m edia filtration and double cartridge filtration)
b) continuous microfiltration (6.6 m3/ h) polyproplylene m em brane; 0.2 um c) ultrafiltration (6.6 m3/ h) capillary; dead-end Screen Rotating screen PROCESS EFFLUENT Nanofiltration Reverse Osm osis NF concentrate
NF permeate: PROCESS REUSE 1 TDS: 15 g/ L
low album ina content low SO4 content (<100 m g/ L)
Nanofiltration (NF)
Mem brane: FILMTEC “ OPEN NF” Recovery: 65%
NF concentrate: feed to RO TDS: 42 g/ L
Reverse osmosis (RO) Mem brane: FILMTEC SW30 Recovery: 35%
RO permeate: PROCESS REUSE 2 TDS: 600 m g/ L
NF perm eate
PROCESS REUSE 1
RO perm eate
PROCESS REUSE 2
RO concentrate: DISPOSAL TDS: 50 g/ L
DISPOSAL
138 3.1.1 Pretreatment options investigated
Due to the high fouling potential, 3 pretreatment options were investigated in the pilot plant:
conventional pretreatment (lamellar clarifloculation, using a flocculent, slow dual media filtration (DMF) and double cartridge filtration), continuous microfiltration (CMF) and ultrafiltration (UF). Pilot trials were run at full recovery for 3000 hours. Conditions and results in the 3 pretreatment options are described below.
3.1.2 Conventional pretreatment
The nanofiltration step had to be operated at a recovery of 65%, fouling factor FF = 0.6 to 0.65 and an average permeate flow (APF) of 16 l/m2/h in order to keep a stable flow, but only for a maximum of 5 hrs. Later, the APF was reduced by fouling to about 14 l/m2/h. Average time between cleanings was 3-5 hrs. The lower figures (3 hrs) correspond to raw water with turbidities in the range of 52 NTU, TOC of 195-205 ppm and total bacterial count of TNTC (Too Numerous To Count). From a project management perspective, this was a technical “NO-GO”. The industrial plant would have to be installed with a 50% higher capacity (3 trains) to have one train normally in the “cleaning operation mode”.
3.1.3 CMF pretreatment
An 0.2 m polypropylene membrane was investigated. The unit was backwashed every 20 minutes with a procedure needing 2.5 minutes. This involved an air scour to loosen solids followed by an air/liquid backwash to remove solids from the membrane fibre bundle. Air blowers supply air for filter backwashing. After backwash the contents of the cell are dumped to the backwash tank. Supernatant form the backwash tank is returned to the feed reservoir with the plant effluent and eventually recycled through the plant.
Periodic chemical cleaning is carried out by a dedicated CIP system. This system includes a CIP tank to recover dilute cleaning solution, and a pump to CIP solution to and from the unit. Air scour mixing is used to ensure cleaning chemical is well distributed. This gives the additional benefit of loosening dirt from the membrane surface. CIP cycle time was 2-4 hrs.
Pressure drop across the membrane (TMP) increases during operation as filter cake builds up on the outside surface of the fibres. Pressure drop is mostly recovered by backwashing but eventually increases to the point where the membranes need chemical cleaning:
Table 3.1.3.1: Typical Pressure Drop at 20°C MF System Post Clean
139 Table 3.1.3.2: CMF Backwash Description
Backwash feature CMF
Air scour to loosen solids from
membrane surface High pressure instantaneous air flow from inside fibre (usually 3 seconds) Solids removed from fibre bundle Combined Air On/Pump On step (usually
5-10 seconds)
Removal of solids from filter cell. Cell contents displaced by raw water at high rate
Rewet of membrane surface Filtrate introduced at high pressure to remove air bubbles.
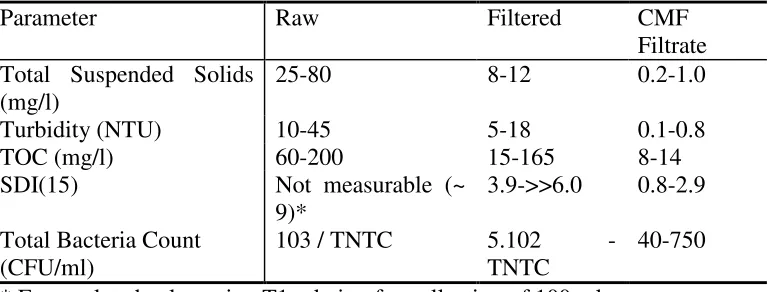
The CMF pretreatment had a backwashable sand filter upstreamer, which with the CMF together improved the quality of the raw feed as follows:
Table 3.1.3.3: Effect of CMF pretreatment
Parameter Raw Filtered CMF
Filtrate Total Suspended Solids
(mg/l) 25-80 8-12 0.2-1.0
Turbidity (NTU) 10-45 5-18 0.1-0.8
TOC (mg/l) 60-200 15-165 8-14
SDI(15) Not measurable (~
9)* 3.9->>6.0 0.8-2.9 Total Bacteria Count
(CFU/ml) 103 / TNTC 5.102 - TNTC 40-750
* Extrapolated value using T1 relation for collection of 100 ml.
Since a CMF does not need basically a pretreatment other than pre-chlorination, the sand filtration was bypassed for 120 hrs.
3.1.3.1 Impact on nanofiltration treatment
The nanofiltration step was operated at a recovery of 73-75% with a FF of 0.78 and the same APF as above. Higher APF values (up to 24 l/m2/h) were also investigated. Fluxes higher than 20 l/m2/h in the NF stage reduced the time between cleanings to about 4 to 7 hrs; at lower flows (18.8 l/m2/h) the operation was stable with an average time between the cleanings of about 28-36 hrs.
140 3.1.4 Results with UF pretreatment
3.1.4.1 Description of UF pretreatment
The UF pretreatment uses capillary membranes of 0.8 to 1.5mm diameter. The installation had dosage systems for cleaning agents and pneumatic valving for the diverse ways of filtration, back-washing and cross flushing.
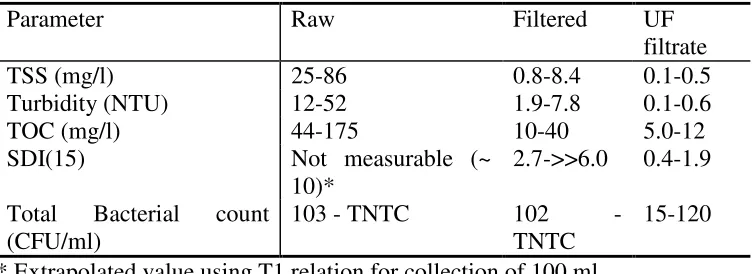
[image:6.595.73.451.309.446.2]The system was started with only a sand filter upstream, but this scheme was changed since it would reduce the operational elasticity at feed turbidities higher than 26 NTU, and these were possible at filter upsets. No chemical treatment other than flocculant dosage was used in the feed to the pilot. The improved Multi Media Filter (MMF) upstreams of the UF pretreatment (VF < 6.5 m/h) was efficient in reducing the TSS and turbidity by 90%. The combined action of the improved MMF and the UF system together were able to improve the quality of the raw water as follows:
Table 3.1.4: Effect of combined MMF and UF pretreatment
Parameter Raw Filtered UF
filtrate
TSS (mg/l) 25-86 0.8-8.4 0.1-0.5
Turbidity (NTU) 12-52 1.9-7.8 0.1-0.6
TOC (mg/l) 44-175 10-40 5.0-12
SDI(15) Not measurable (~
10)* 2.7->>6.0 0.4-1.9 Total Bacterial count
(CFU/ml) 103 - TNTC 102 TNTC - 15-120
* Extrapolated value using T1 relation for collection of 100 ml.
3.1.4.2 Impact on nanofiltration treatment
After the UF pretreatment step, the nanofiltration was operated with a recovery of 73%. A fouling factor of 0.87 was maintained for a good 1600 hrs.
After that, an upset of the UF system occurred. This happened when the MMF was out for maintenance and the raw water with turbidity of about 38-41 NTU was fed directly into the capilar module for about 1 hour. The SDI of the UF filtrate went then to about 3.9 for a short period of time. Probably, the upset of the UF has been potentiated by the fact that the flocculent dosage was shut down together with the MMF, and as a consequence, a much larger part of TOC could pass the UF and foul the NF operation.
After the upset of the UF, the FF went down to 0.58 for a short period, but both UF and NF systems were recovered by chemical cleanings. The new FF established was 0.84. This operation could be maintained for another 1000 hours until the pilot trial was terminated. An APF of 21 l/m2/h could be achieved, with a time between cleanings of 42 hrs up to 5 days.
3.1.5 Cost evaluation and comparison MF/UF to conventional pretreatmen
141
calculation was made for all three pretreatments. This evaluation shows that the conventional pretreatment would have operational costs in the order of $ 0.49/m3 permeate while MF and UF would be both lower than $ 0.35 ($ 0.34 for CMF and $ 0.33 for UF) for the final capacities of 2000 m3/d required for the industrial plants (the units costs indicated here are related to the pretreatment). This means more than 30% lower cost for the CMF/UF system than the conventional pretreatment processes. The calculated scale-up costs are supported by even larger differences given in the literature [15, 16, 17, 18]. The unit cost for the operation of the NF is about $ 0.22/m3 for the case with CMS/UF pretreatment and $ 0.26/m3 for the NF following a conventional pretreatment.
For larger capacities, the operation and maintenance (O&M) cost of CMF and UF technologies would be substantially lower. Literature indicates figures of about US$ 0.20/m3 treated wastewater for larger capacities [17, 18]. As for the nanofiltration, the unit costs would be reduced by about 7-10% in a larger size plant (10000 m3/d range).
3.1.6 Case history conclusions
Both CMF and UF were able to reduce the water turbidity by more than 90 to 92% while the conventional pretreatment (Lamellar Settling/DMF/Cartridge) could reduce only 84% in average. This is an efficiency increase of more than 80%.
Both CMF and UF were able to produce water adequate for the NF system operation with reductions of the SDI(15) of about 75 to 85% w.r.t. the media filtrate. The CMF was able to reduce a non measurable SDI (extrapolated estimate about 9.0) to a value 3 for a longer period of time (days) without significant troubles. The UF reduced it (in combination with MMF) to 2.0.
Both CMF and UF were able to reduce suspended solids, TOC and bacteria count to an extent that made feasible to operate the NF systems for 3 to 5 days between chemical cleanings.
CMF/RO and UF/RO have a less complex nature and are therefore simpler to operate than conventional systems. This observation is also in accordance with general judgement found in the literature [15, 16, 19]. The operation with conventional pretreatment proved difficult, especially the need for chemical cleaning every 3-5 hrs for the nanofiltration unit, due to 30% increase in differential pressure feed brine and/or 26% permeate flow decrease.
Maintenance costs were slightly higher for the conventional system. The pilot with CMF and UF used a space 25% smaller than the conventional skid and this difference was expected to expand to about 30-40% for the industrial plant.
142
3.2 Case history 2: Secondary municipal and agricultural effluent application
3.2.1 Introduction
This case history compares FILMTEC BW30-365FR2 with BW30-330 RO elements in a secondary municipal and agricultural effluent application. In the 1Q of 1998, a second generation of fouling resistant membrane was developed, with which the resistivity of the surface to adhesion of microorganisms is further reduced. Adhesion of microorganisms is believed to be the key initial step leading to the onset of biofilm formation when treating biologically active surface waters with membrane processes.
In a steel finishing factory in South America, which had been using conventional BWRO elements to treat agricultural and secondary municipal type effluents to produce Process Water, a new BWRO unit has been installed. This unit has been equipped with FILMTEC BW30-365 FR2 elements. The pretreatment of the RO units is conventional settling, slow multimedia filtration and cartridge filtration through 3 micron absolute filters.
The original unit continues using chlorination/dechlorination, but the new unit uses a brand (formulated) non-oxidizing biocide. This permits a comparison between the two operating modes. A feed with an SDI15 varying between 4.0 and 5.0 in the warm season (up to 28°C) is used. The water has a total bacterial count between 106 CFU/ml and TNTC (too numerous to count). The two units have approximately the same membrane area installed, but different operating parameters.
3.2.2 Results
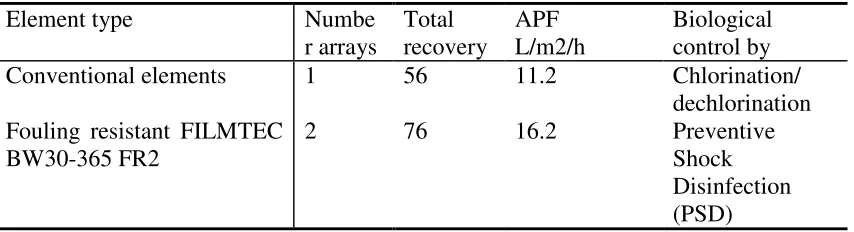
[image:8.595.68.495.503.619.2]The following table compares the results of both plants operating with conventional and with FILMTEC fouling-resistant membrane elements:
Table 3.2.2.1: Comparison of conventional and FR membrane elements
Element type Numbe
r arrays Total recovery APF L/m2/h Biological control by
Conventional elements 1 56 11.2 Chlorination/
dechlorination Fouling resistant FILMTEC
BW30-365 FR2 2 76 16.2 Preventive Shock
Disinfection (PSD)
The plant uses an intermittent disinfection technique which is called Preventive Shock Disinfection (PSD). This disinfection mode works very efficiently. The actual permeate flow is kept constant by varying the feed pressure. The performance can be seen in Figure and Figure (the flux in Figure is normalized).
143
Table 3.2.2.2: Fouling and cleaning with conventional and FR elements
Element type APF
L/m2/h Flux in% loss (after days)
Flux recovery after cleaning, %
Time between cleanings
Conventional 11.2 39 (81) 21 16 d
Fouling resistant FILMTEC
BW30-365 FR2 16.2 14 (172) 14 40 days
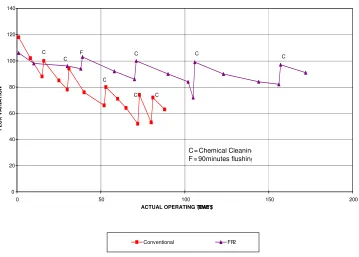
After 18 months of operating the effluent plant with the FILMTEC Fouling Resistant FR2 membranes and after 11 cleaning and 4 flushing campaigns, about 400 m3/d of agricultural effluent, which represent 38% of the feed flow to the RO plant, were canalized to the sea, since about the same quantity (400 m3/d) of secondary effluent had been added to the 650 m3/d secondary effluent feed. This resulted into 1050 m3/d to be treated in the RO plant. Interesting enough, the average time between cleanings was increased automatically to about
double, from 40 days to 78 days.
Figure 3.2.2.1: Stability of normalized flux FILMTEC BW30-365 FR2
STABILITY OF NORMALIZED FLUX FILMTEC BW30-365 FR 2
0 20 40 60 80 100 120 140
0 50 100 150 200
ACTUAL OPERATING TIME (DAYS)
FL
U
X
V
A
R
IA
TI
O
N
Conventional FR2
C = Chemical Cleaning F = 90 minutes flushing
C
F C C
C C
C
[image:9.595.110.469.343.600.2]144
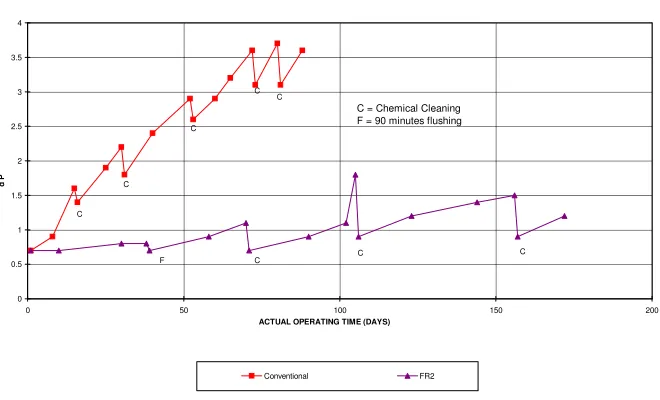
Figure 3.2.2.2: Pressure drop feed to brine FILMTEC BW30-365 FR2
A short investigation showed that the agricultural run-off had been the feed stream with the lowest quality, due to its content in quaternary amines as well as its high turbidity (which was not totally eliminated by the conventional pretreatment).
3.2.3 Plant expansion
For the plant expansion planned for 2002, pilot trials have been performed, using a Zeeweed microfiltration. There is not much data about the operation results yet, but the time between cleanings for the feed containing agricultural run-off could be increased from the mentioned 40 days to about 60 days, which correspond to an increase of 50%.
Financial estimates for the planned expansion are given in the following Table 3.2.3.1 Table 3.2.3.1: Plant size and specific treatment costs
Size of plant m3
permeate/day
Operational cost US$/m3 permeate
Conventional pret. + RO (a) CMF/UF + RO (b)
1000 0.50-0.52 0.46
5000 0.49 0.43
20000 0.46 0.40
Data by DEVRE Water treatment Co. includes flocculent settling. 1 stage MMF and cartridge filtration
Very similar for CMF and UF from various manufacturers
and (b) include 6% interest rate, 15 years linear depreciation, US$ 0.6/kWh, chemicals, maintenance and membrane replacement costs and do not include labor costs.
Data by J. Lopis and GAT-Buenos Aires (April 2000) d P Feed-Brine vs Time
FILMTEC BW30-365 FR 2
0 0.5 1 1.5 2 2.5 3 3.5 4
0 50 100 150 200
ACTUAL OPERATING TIME (DAYS)
d
P
Conventional FR2
C
C
C C
C
C = Chemical Cleaning F = 90 minutes flushing
[image:10.595.67.402.530.617.2]145
The cost of treated m3 RO permeate is about 14% lower than with conventional pretreatment. An important but not overwhelming influence of the plant size in the cost of treating the effluent water with integrated membrane systems can be seen.
3.2.4 Case history conclusions
The data shows conclusively that FILMTEC BW30-365 FR2 membrane elements were only slightly affected by flow loss. In addition these elements displayed a better cleanability and a very low increase in differential pressure. The increase in differential pressure relates directly to the rate of bacterial capture in the incubation period prior to the onset of colonization and biofilm generation, in the relation 3.3 to 1 for the conventional membrane elements to the Fouling Resistant membranes. The stand time between cleanings shows the following relation: 16 days to 40 days, i.e. 1 to 2.5 in favor of the FR2.
This demonstrates that modifying the chemistry at the surface of FILMTEC BW30 membranes can reduce the rate of microbial attachment and delay the start of biofilm formation, thus extending the time between chemical cleanings. Use of FR Technology will generate important savings in O&M costs, by cleanings. Further improvements to delay the start of biofilm formation in spiral wound elements can be realized by modifying the physical characteristics of the feed channel spacer and employing shorter leaf lengths with a multiple leaf design (e.g. > 25) for more uniform flow distribution.
In addition, the periodic application of an effective biocide can dramatically extend the interval between required chemical cleanings for spiral wound elements on bioactive (generally surface) waters. Biocide selection dosage frequency and rate are very important for the success of high fouling potential water treatment with membranes. It can also be seen that it is feasible to treat a secondary and agricultural effluent using conventional pretreatment and fouling resistant RO membranes (with a combined cost below US$ 0.48/m3 permeate). The costs of any treatment are dependant on effluent type and quality, final application of the treated water and location of the plant. The quality, economy and ease of operation, achievable by using an Integrated Membrane System (IMS) is clearly superior than the one obtainable by treating with a conventional pretreatment and RO.
3.3 Case history 3: Contaminated surface water treatment. Treatment with nanofiltration
146
[image:12.595.50.496.192.544.2]The original treatment installation previous to the softening plant consisted of the following units: Intake, measuring and control of the flow to be treated, pre-ozonization, mixing chambers, clarifiers, sand filtration, filter cleaning equipment, treated water pre-chlorination and disinfection system, final ozonization chamber, potable water reservoir, treated water pumping station.
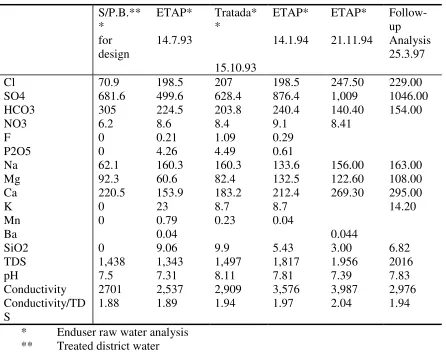
Table 1: Raw and filtered water analysis for the NF70 plant; water analysis by end- user and others.
S/P.B.** *
for design
ETAP* 14.7.93
Tratada* *
15.10.93
ETAP* 14.1.94
ETAP* 21.11.94
Follow-up Analysis 25.3.97
Cl 70.9 198.5 207 198.5 247.50 229.00
SO4 681.6 499.6 628.4 876.4 1,009 1046.00
HCO3 305 224.5 203.8 240.4 140.40 154.00
NO3 6.2 8.6 8.4 9.1 8.41
F 0 0.21 1.09 0.29
P2O5 0 4.26 4.49 0.61
Na 62.1 160.3 160.3 133.6 156.00 163.00
Mg 92.3 60.6 82.4 132.5 122.60 108.00
Ca 220.5 153.9 183.2 212.4 269.30 295.00
K 0 23 8.7 8.7 14.20
Mn 0 0.79 0.23 0.04
Ba 0.04 0.044
SiO2 0 9.06 9.9 5.43 3.00 6.82
TDS 1,438 1,343 1,497 1,817 1.956 2016
pH 7.5 7.31 8.11 7.81 7.39 7.83
Conductivity 2701 2,537 2,909 3,576 3,987 2,976
Conductivity/TD
S 1.88 1.89 1.94 1.97 2.04 1.94
* Enduser raw water analysis ** Treated district water *** Design water analysis
The design parameters stated in the Tender Documents are the water analysis (see 1st column in Table 1), a temperature range of 14 - 19°C and a maximum conversion. As a consequence of the prolonged drought, the water levels in the reservoir decreased substantially. Consequently the water quality was impoverished and an increase in sulphate levels up to 1100 mg/l took place. For this, the planned plant capacity was increased from 14000 m3/d to 21000 m3/d.
147
The definition of the conversion rate for the operation of the plant, was a basic factor to be considered for design purposes.
3.3.1 New enlarged pretreatment and NF70 plant
3.3.1.1 Equipment
The complementary equipment of the softening plant includes the following: HCl dosing system, SBS dosing system, anti-scalant dosing system, process pump with frequency converter, cartridge filter, nanofiltration racks, suck-back tank, permeate tank for flushing purposes.
To reduce the calcium carbonate precipitation potential, it is necessary to reduce the water pH value given the high sulphate level in the water. The dosification of HCl was considered not to increase the already high sulphate level in the water. To reduce free chlorine, a sodium metabisulphite dosing system has been installed. There are four pumps installed, one per rack and one reserve pump connectable to any of the 3 racks. The filtered water is pumped to the racks through cartridge filters.
[image:13.595.70.379.422.617.2]3.3.1.2 NF70 trains
Figure 3.3.1.2 shows a general flow sheet of the plant. The configuration of each rack is in two different arrays of 44 and 20 P.V. respectively. Each PV contains six (6) FILMTEC nanofiltration membranes type NF70-345. Each train operates at a recovery rate of 70%.
Filtered Water Storage
Dosage of antiscalant Doasge of SMBS
Dosage of HCL Train 1 Reserve Train 2 Train 3 ETC ETC PERMEATE TANK 1st Array 44 PVs (6 Elem/PV) 2nd Array 20 PVs
(6 Elem/PV) Brine
disposal to sea
Y
Post ozonation chamber To regulation storage and water distribution Cleaning & Flushing System Mixer NANOFILTRATIONRACKS WATER FROM EXISTING PRETREATMENT PROCESS PUMPS SUCK-BACKTANK Cartridge Filter 5 Micr.Figure 3.3.1.2: General flow sheet of the NF70 plant Bajo Almanzora.
The rise in sulphate concentration during the projection and construction time of the plant forced the design to reduce the overall recovery and to install sacrificial membranes to reduce the operational risk.
148
Table 3.3.1.1: Key performance parameters of the NF70-345 plant Operating time 2 months
Actual Predicted
12 months Actual Predicted
Feed water temp. (°C) 12 12 11.6 11.6
Feed water SDI(15) 4.2 --- 4.5 ---
Recovery % 65* 65* 70 70
Feed TDS (mg/l) 1998 1998 2200 2200
Feed conductivity ( s/cu) 2618 2618 2870 2870
Feed pressure (bar) 8 7.86 10.2 10.15
Product flow (m3/h) 215 220 280 249.4
Permeate TDS (mg/l) 138 251 89.6 275
Permeate conduct. ( s/cu) 194 351** 126 285** * Test period with sacrificial membranes
** Estimated values
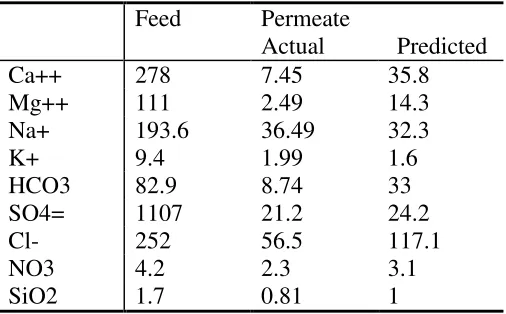
The ionic analysis of NF70 permeate and feed after about 2 months and one year of operation is shown in CASE 3, Table 3.3.1.2. The ionic analysis after one year of operation has values about 40% lower for the permeate TDS, despite a considerable increase in the feed TDS. This corresponds to an element salt rejection of 97.8%, which is very high for a NF70 plant (23).
Table 3.3.1.2: Ionic analysis of the feed and permeate Feed Permeate
Actual Predicted
Ca++ 278 7.45 35.8
Mg++ 111 2.49 14.3
Na+ 193.6 36.49 32.3
K+ 9.4 1.99 1.6
HCO3 82.9 8.74 33
SO4= 1107 21.2 24.2
Cl- 252 56.5 117.1
NO3 4.2 2.3 3.1
SiO2 1.7 0.81 1
It can be observed that the actual concentrations are considerably lower than predicted. This is partially explained by the high concentration of divalent ions.
3.3.2 Economic considerations
149
that the power costs to run process pumps are about 40 to 45% of the total costs for conventional RO and 28 to 32% for low pressure RO. In the same context, they would be between 15 and 22% for nanofiltration. All other factors being equal, this results in general operating cost savings in the range of 15 to 22% compared to low pressure RO and conventional RO respectively. These are significant savings and may in some applications influence the economic viability of large projects.
3.3.3 Case history conclusions
Nanofiltration membrane elements combine a higher flux efficiency with a larger membrane area packed in the same volume and format as conventional 8 inch elements allowing for a substantial reduction of investment costs, as well as lower operating costs due to reduced pressure and fouling tendency. In the case of the FILMTEC NF70 elements, the part of the operating cost related to energy consumption has been roughly reduced by 40% compared with conventional RO technology.
It became evident that it is possible to treat this marginal brackish surface water with conventional pretreatment and nanofiltration to produce potable water quality at acceptable cost.
In a similar case for a new plant, the use of a CMF/UF pretreatment could result in a better operation at a lower unit cost.
3.4 Case history 4: High salinity “brackish” well water treatment. 3.4.1 Introduction
This case history illustrates the membrane treatment of high salinity well water for potable water and agricultural irrigation using the “regular” sea water reverse osmosis elements (SWRO) FILMTEC SW30-8040 (high rejection elements would be the alternative). Results with pilot trials with a new high flow SWRO product are also given.
The plants upon which this case history is based, is located in Southern Spain, in the Murcia region, well known for the extensive horticulture and fruticulture with industrial character. The water to treat contains agricultural run-off and aquifer water with a substantial sea water penetration. The water is extracted from deep wells (up to 200 m) and the TDS is between 8,000 and 35,000 mg/L. The plants are usually owned by agricultural associations. Some of them are also owned by individual agro-industrial enterprises [25].
150 3.4.2 New plant
On the base of these applications, new plants were built, but since in the meantime the wells had experienced a strong salinity increase from 4,000 to about 18,000 and in some cases up to 33,000 mg/L, the new RO plants were equipped with sea water reverse osmosis elements, non high rejection type. In the case of the study, the plant has been projected and built by the Spanish OEM Tedagua (based in Gran Canaria) and has 5 trains, each one with a single array of 32 PVs, containing 7 elements per pressure vessel, type FILMTEC SW30-8040, 1120 elements in total (above applications have been widely served by this element type). The specification of the element is 6000 gpd (950 l/h) at seawater standard conditions and the typical rejection is 99.1% at 25°C.
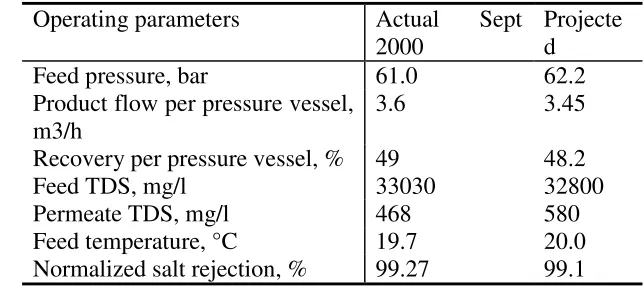
[image:16.595.126.448.399.542.2]The plant started in May 1998 and had been running with some troubles in the first two months of operation due to the contaminants affecting the membrane surface. After the special treatment was implemented, the plant did stabilize and it is operating perfectly. It has been cleaned only two times in the 30 months operation and all contaminants from the agricultural run-off are retained by more than 99.4%. Part of the water is used as potable water and part is blended with other waters to a higher TDS and used for irrigation purposes. Operating parameters for one pressure vessel with 7 elements FILMTEC SW30-8040 using today’s high TDS water are presented in the following table [25].
Table 3.4.2: Operating parameters Murcia VDM II plant Operating parameters Actual Sept
2000 Projected
Feed pressure, bar 61.0 62.2
Product flow per pressure vessel,
m3/h 3.6 3.45
Recovery per pressure vessel, % 49 48.2
Feed TDS, mg/l 33030 32800
Permeate TDS, mg/l 468 580
Feed temperature, °C 19.7 20.0
Normalized salt rejection, % 99.27 99.1
3.4.3 Development and pilot performance of the new high flow FILMTEC SW30-380 (non HR membrane).
151
Table 3.4.3: High brackish well origin – Murcia VDM II plant (Data averaged for 1 PV with 7 x FILMTEC SW30-380)
Operating parameters Actual Sept 2000 Projected
Feed pressure, bar 61.0 61.8
Product flow per pressure
vessel, m3/h 5.8 4.95
Recovery per pressure vessel,
% 51 48.4
Feed TDS, mg/l 33030 33000
Permeate TDS, mg/l 438 567
Feed temperature, °C 19.9 20.0
Normalized salt rejection, % 99.3 99.1
Based on the performance results and the product flow ration, the estimated savings in investment cost (DFC) for a plant of 14000 m3/d like the reported here (VDM II) would be 46 PV’s containing 322 elements, which is in the order of 29% of the total cost for PV’s and elements.
On the other side, if a part of this difference, say 50% is installed, the energy consumption of this configuration would represent about 6.5% of energy savings, i.e. about $US 19000 per year (calculated using 1 kWh = $ 0.06).
The quality of the permeate would stay about constant . 3.4.4 Conclusions for case history 4
This case history shows that, based on the right plant design and membrane choice, high TDS brackish can be used for irrigation purposes. A higher flow membrane like FILMTEC SW30-380 is adequate for this type of application [24, 25].
4 Selection of feed water and pretreatment system
The case histories presented above allow conclusions on the type of feed waters to be used as well as for the type of pretreatment that is preferable for marginal water treatment. Based on the cost evaluated from these case histories and from literature data, implications for the treatment of marginal waters are given below.
4.1 Sea water desalination or “marginal water” treatment
152
Treatment of high TDS (33000 mg/l) brackish waters (case history 4) is about $ 0.25 to $ 0.28/m3 based on conventional (not extensive) pretreatment and higher flow SWRO type elements. Some innovations in the membrane and pump systems could reduce this cost by 10%. This would make possible a cost of $ 0.23/m3 product for plant sizes larger than 15,000 m3/d. This cost would probably not be reduced by changing the pretreatment from conventional to CMF/UF type, since the cost is mainly attributed to the high feed water TDS content.
Basically brackish water treatment and sea water desalination need to be developed complementary and this is what is happening in many advanced and emerging economy countries, e.g. USA, Spain, parts of Middle East, Japan, Mexico). Where the needs are mainly covered by renewable brackish sources (parts of USA, Canada, Central and North Europe), these have the preference due to habits and cost reasons. When brackish water sources become scarce, sea water desalination and effluent water treatment (reuse) should become complementary developed.
4.2 Conventional versus integrated membrane systems (IMS)
The treatment costs of “marginal” waters depend on the application and to a high degree on their quality. This is also demonstrated in case history 2. Secondary effluent and agricultural run-off water treatment with conventional pretreatment and RO or NF costs are compared to integrated membrane systems using CMF/UF and RO. Cost for sizes in the 5,000 m3/day range are $ 0.49/m3 (conventional pretreatment and RO or NF) versus $ 0.43/m3 (IMS with CMF/UF + RO, using FR technology). For the size range of 20,000 m3/d, costs amount to $ 0.46/m3 (conventional) versus $ 0.40/m3 (IMS).
Costs for larger plants have been given in the literature with figures about 5 to 10% lower than the last, to even less than $ 0.37/m3 if the RO pretreatment cost stays under $ 0.26/m3. There are figures in the literature showing similar costs for “less marginal” waters (see of Galilee) treated with conventional simpler pretreatments adding to about $ 0.40/m3, even discounting some 4 US cents for raw water cost and 9 US cents for brine removal, both per m3. This would move the cost figure without these extra costs to less than US$ 0.30/m3 [5]. Other estimates put the unit cost for treating difficult or marginal surface waters some with heavy pollution (fish pond effluent) with UF and RO (FR type) at $ 0.40 to 0.45/m3, which are also in line with the first indicated here [6].
153
There are industrial effluents like the one described in case history 1, where the treatment without an IMS becomes a virtual technical “NO GO” for practical and cost reasons. Even if the plant capacities are small (e.g. 2,000 m3/d) the differences in unit costs are such (e.g. more than 25%), that the IMS become more or less a must. The alternative not to reuse the water is often prevented by ecological reasons and legal regulations.
For sea water desalination, current trends are lowering costs by applying better energy recovery devices, better pumps and better membranes. The application of IMS is currently not frequently used to lower costs, although this may change [8, 15, 18]. However, for other types of marginal waters, the trend to using IMS is very strong, especially in the case of diverse effluent type waters or difficult waters.
5 Conclusions
Evaluation of operational and economical data from literature and case histories involving FILMTEC membrane elements show that the treatment of marginal waters is feasible and economical. Various options exist with regard to feed water and pretreatment system. Integrated membrane systems have generally shown advantages where they are being used and appear to be a promising trend for the future.
6 Disclaimer
No freedom for any patent owned by Dow Deutschland Inc./FilmTec Corporation or others is to be inferred. Because use conditions and applicable laws may differ from one location to another and may change with time, Customer is responsible for determining whether products and the information in this document are appropriate for Customer’s use and for ensuring that Customer’s workplace and disposal practices are in compliance with applicable laws and other governmental enactments. Dow Deutschland Inc./FilmTec Corporation assume no obligation or liability for the information in this document. No warranties are given; all implied warranties of merchantability or fitness for a particular purpose are expressly excluded.
7 References
J. Alvarez and F. Brinon, “Water price, desalination process and the role of the market forces”, Comentarios sobre un discurso politico, Feb 1995
J. Redondo and F. Lanari (int. com.), “Collection of Q&A over the Technical and Economical review” after IDA Conference in Madrid, Jan 1998
M.L. Bouguerra, “Batalla por el oro azul”, Le Monde Diplomatique, Nov 1997
G.F. Leitner, “Project report No. 5 – The Tampa SWRO case”, D&W Reuse, May 1999, Vol. 9/1
154
P. Glueckstern et al, “Desalination of brackish fish poud effluents comparative evaluation of IMS (UF/RO) vs. conventional membranes in drink + industrial water”, Paris, Oct 2000
J.A. Redondo and I. Lomax, Desalination 110, 1997, 167-182, “Experiences with the pretreatment of raw water with high fouling potential for reverse osmosis plant using FILMTEC membranes”
I. Zsirai, Zenon International, personal communication, April 2000
Zhan Qishan and Z. Xiao, “Water issues and substainable social development in China”, Water International IWRA, Vol. 20, 1995
Malleviale et al, “Water treatment membrane processes”, Mc Graw Hill, 1996
S. Duranceau et al, “Integrating immerse UF process into a lime softening WTP”, Membranes in drinking and industrial water conference, Paris, Oct 2000
S. Freeman et al, “Experiences with submerged MF and UF for surface water treatment”, AWWA conference, June 2000
FILMTEC Technical Manual, Version Nov 1995, The Dow Chemical Company
R. Pauer, DEVRE WTC, “Water treatment for metal finishing using IMS”, personal communication, Aug 2000
B. Durham, Vivendi, personal communication, Oct 2000 S. van Hoot, NORIT, personal communication, Nov 2000
M.M. Bourbigout, B. Durham, J. Zuback, Vivendi Water, “Waste water reuse and desalination through dual-membrane processes”, Euromembrane 2000, Jerusalem
S. van Hoot et al, “The effect of US as pretreatment to RO in WW reuse and SW desalination”, Desalination 124 (1999), 231-242
Current issues in membrane applications and research. Membrane system design issues, Full scale applications AWWA membrane technology conference, Preconference workshop, Feb 1999
S.A. McClellan, personal communication, 1995 P. Bernaola, personal communication, 1994 B. Almanzora, project documents, 1995
Dow and Cadagua evaluations of plant performance, 1995-1997 Project documents of Tedagua for Mazarron I and VDM II projects Personal communication of Mr. J.L. Loidi, Tedagua