doi:10.5194/angeo-30-97-2012
© Author(s) 2012. CC Attribution 3.0 License.
Geophysicae
Kinetic structure and wave properties associated with sharp
dipolarization front observed by Cluster
S. Y. Huang1,2, M. Zhou2,3, X. H. Deng1,3, Z. G. Yuan1, Y. Pang3, Q. Wei1, W. Su1, H. M. Li1, and Q. Q. Wang1
1School of Electronic Information, Wuhan University, Wuhan 430072, China
2State Key Laboratory of Space Weather, Chinese Academy of Sciences, Beijing 100190, China 3Institute of Space Science and Technology, Nanchang University, Nanchang 330031, China
Correspondence to: S. Y. Huang ([email protected])
Received: 17 March 2011 – Revised: 29 October 2011 – Accepted: 24 December 2011 – Published: 9 January 2012
Abstract. Multiple dipolarization fronts (DFs) were ob-served by Cluster spacecraft in the magnetotail during a substorm. These DFs were kinetic structures, embedded in the bursty plasma flow, and moved earthward (mainly) and dawnward. Intense electric field, parallel and perpendicular currents were detected in the DF layer. These front layers were energy dissipation region (load region) where the en-ergy of electromagnetic fields were transferred to the plasma thermal and kinetic energy. This dissipation was dominated by electrons. There were enhancements of plasma waves around the DF region: wavelet results show that wave ac-tivities around the ion cyclotron frequency in the front layer were generated by Alfv´en ion cyclotron instability; whistler waves were also detected before, during and after the DFs, which are triggered by electron temperature anisotropy and coincident with enhancement of energetic electron fluxes. The observation of these waves could be important for the understanding of evolution of DF and electron energization during the substorm. We discuss the generation mechanism of the DFs and suggest that these DFs were generated in the process of transient reconnection, and then traveled toward the Earth.
Keywords. Magnetospheric physics (Energetic particles, precipitating; Magnetotail; Plasma waves and instabilities)
1 Introduction
Substorm is considered as the most important dynamic pro-cess in the magnetosphere and ionosphere. A strong increase of magnetic field componentBznormal to the neutral plane
is known as the magnetic field dipolarization. Dipolarization
in the near-Earth plasma sheets is a common signature as-sociated with substorm expansion onset (Baker et al., 1978; Baumjohann et al., 1999, and references therein). Dipo-larization phenomena are observed through a large range of magnetotail, from−5RE (the Earth’s radius) to−31RE
(Nakamura et al., 2002, 2005; Ohtani et al., 2004; Shiokawa et al., 2005). Dipolarization betweenX= −8RE andX=
−12RE is suggested to be either caused by the braking of
fast plasma flow in the near-Earth tail region (Shiokawa et al., 1997), or the disruption of the cross-tail current (Lui, 1996). Analyzing the database of Geotail, Ohtani et al. (2004) sta-tistically studied the fast flow in the plasma sheet and found that the magnetic field became dipolar in the fast plasma flow and the sharp DF tends to be preceded by a transient decrease in Bz. They compared their observations with isothermal
two-fluid simulations and suggested that the asymmetricBz
bipolar structure of dipolarization front (DF) was due to the passage of a magnetic island which was generated by mul-tiple X lines. On the other hand, full-particle simulations with open boundaries showed that the DF is a new regime of transient reconnection in contrast to flux pileup region and secondary islands or plasmoids generated by magnetic re-connection (Sitnov et al., 2009). They also found that the DF was a kinetic structure with thickness comparable with ion inertial length or larmor radius.
−150 −100 −50 0 50 100 −50
0 50 100 150 200 250
X (km)
Y (km)
−150 −100 −50 0 50 100 −50
0 50 100 150 200 250
X (km)
Z (km)
Clsuter 1 Clsuter 2 Clsuter 3 Clsuter 4
12 13 14 15
600 400 200 0 200
AU!AL!(nT
)
12 13 14 15
0 200 400 600 800
AE!(nT)
UT(hr )
(a)
(b)
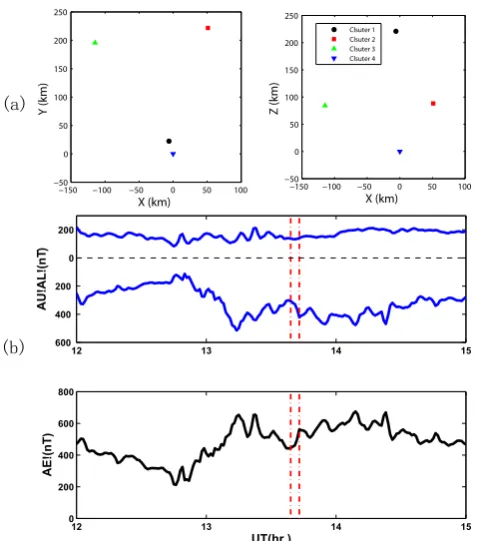
Fig. 1. (a) The relative positions of the four Cluster spacecraft at 13:39 UT on 29 August 2003 are presented in the GSM coordinate.
Cluster-4 was located at (−17.48,−1.77, 2.87)RE. (b) AU, AL
and AE index from 12:00 to 15:00 UT on 29 August 2003. The red dashed vertical lines mark the time interval of 13:37–13:47 UT.
number of small scale elements. Zhou et al. (2009) and Deng et al. (2010) found the energetic electron injection was closely related with DFs and burst bulk flows. They also sug-gested that DFs were located at the leading edge of plasma bubble (Zhou et al., 2009).The plasma bubble was proposed to explain the bursty bulk flow in the magnetotail. It is sug-gested as a plasma depleted flux tube, where plasma pres-sure reduces and magnetic prespres-sure increases (maintaining approximately constant total pressure), associated with fast plasma flow (Chen and Wolf, 1993; Sergeev et al., 1996).
In addition, intense wave activities were associated with the DFs. Lower hybrid waves, electrostatic electron cy-clotron harmonic waves, and nonlinear electrostatic struc-tures such as electrostatic solitary waves and double layers were detected around the DF (Zhou et al., 2009; Deng et al., 2010).
We define the sharp DF as a sharp increase ofBzwith
vari-ation amplitudeδBz>10 nT in less than 30 s, and without
large fluctuation ofBzpreceding front crossing in the central
plasma sheet where requires ion plasmaβ >1. In this paper, we utilize data from four Cluster spacecraft to investigate the kinetic structure and wave properties associated with sharp DF in detail. The advantage of Cluster over THEMIS for studying small scale structure is that the inter-distance
be-tween four spacecraft is much smaller (around 200 km in the year of 2003). High resolution data from Cluster spacecraft are used for this analysis. The FGM instrument provides 22 Hz magnetic field data (Balogh et al., 1997), and the EFW instrument provides 25 Hz electric field data (Gustafson et al., 1997). Spin resolution (4 s) ion plasma data is obtained from the CIS instrument (R`eme et al., 2001). The electron distribution is from the PEACE instrument (Johnstone et al., 1997). High-energy electron and proton differential particle flux data are obtained from the RAPID instrument (Wilken et al., 2001). Electric and magnetic fields power-spectrograms are from the STAFF experiment (Cornilleau-Wehrlin et al., 2003).
The remainder of this paper is organized as follows. In Sect. 2, we present the observation of multiple DFs on 29 Au-gust 2003. In Sect. 3, kinetic structure of the DFs is analyzed in detail. In Sect. 4, we show wave properties around the DFs. The results are discussed in Sect. 5 and we summarize our results in Sect. 6.
2 Observation overview
In this paper, we report Cluster observations of the multi-ple DFs during the interval of 13:37–13:47 UT on 29 Au-gust 2003. Figure 1a shows the relative position of the Clus-ter spacecraft at 13:39 UT in the Geocentric Solar Magneto-spheric (GSM) coordinate. All the variables are presented in GSM coordinate system unless otherwise specified. Cluster-4 was located around (−17.48,−1.77, 2.87)REin the
mag-netotail, and four Cluster spacecraft formed a tetrahedron with a maximum inter-distance of about 250 km. All four spacecraft were in the post-midnight sector.
Figure 1b shows the AU, AL, and AE index between 12:00 UT and 15:00 UT. The red dashed vertical lines mark the interval of 13:37–13:47 UT when the DFs were observed. AE index started to increase at 12:42 UT and reached up to 700 nT at 13:15 UT. During the time interval when multiple DFs were detected, the AL index decreased and the AE index increased up to 570 nT after a slight drop. The indexes sug-gest that the DFs were detected during a substorm expansion phase.
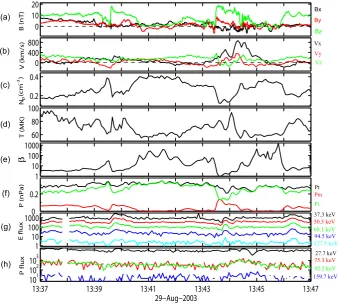
Figure 2 shows an overview of the Cluster-4 observations from 13:37 UT to 13:47 UT. On the scale of Fig. 2, the obser-vations of all four spacecraft are essentially identical.Bxwas
fluctuated around zero with very small amplitude, less than 10 nT, during the whole time interval (Fig. 2a), and the ion plasmaβ (the ratio of the ion pressure to the magnetic pres-sure) was larger than 1, which implies that spacecraft was located in the central plasma sheet. The magnetic fieldBz
[image:2.595.48.287.60.331.2]0 10 20
B (nT)
0 400 800
V (km/s)
0.2 0.4
Np
(cm
−3
)
60 80 100
T (MK)
1 10 100 1000
β
0 0.2
P (nPa)
1 10 100 1000
E flux
13:37 13:39 13:41 13:43 13:45 13:47
101 102 103
29−Aug−2003
P flux
Bx
By
Vx Bz
Vy Vz
Pt
Pm Pi
50.5 keV 68.1 keV
37.3 keV
94.5 keV
127.5 keV
75.3 keV 92.2 keV
27.7 keV
159.7 keV (a)
(b)
(c)
(d)
(e)
(f)
(g)
[image:3.595.128.467.63.367.2](h)
Fig. 2. Overview of magnetic field, ion plasma data, and electron plasma data observed by Cluster-4 between 13:37 UT to 13:47 UT on 29 August 2003. The top panel shows the three components of magnetic field. The next three panels show the three components of ion
plasma velocity, ion plasma density and temperature, respectively. The fifth panel shows the ion plasmaβand the sixth panel shows the
thermal pressure, magnetic pressure and total pressure. The last two panels show electron differential fluxes (1/(cm2str s keV)) and proton
differential fluxes (1/(cm2str s keV)) measured by the RAPID instrument.
DF. Both flows around DFs have large dawnward compo-nent. After the crossing of DFs, the Y component of plasma flow reveals from dawnward (−Vy)to duskward (+Vy)
di-rection, which may be due to the passage of a vortex. The observations of two DFs were separated by less than 4 min. The observed DFs have typical signatures similar as those sharp DFs observed by THEMIS, such as sharpBzincrease,
ion plasma density decrease (Fig. 2c), temperature increase (Fig. 2d), andβdecrease (Fig. 2e). Inside the DFs, magnetic pressure increased while thermal pressure decreased and the total pressure (Fig. 2f) did not vary a great deal, which is similar as the plasma bubble in the near earth region (Chen and Wolf, 1993; Sergeev et al., 1996). The energetic electron fluxes between 37.3 keV and 127.5 keV increased around the DFs. The fluxes started to increase when the Cluster en-countered the first front, while there was a slight lag be-tween the arrival of the second front and electron fluxes in-crease (Fig. 2g). High energy ion fluxes, between 27.7 keV and 92.2 keV, also show some enhancements at both DFs (Fig. 2h). Such ion fluxes enhancements have been observed by previous researches (e.g. Ohtani et al., 1992). In this
pa-per we do not discuss the detailed structures ofBzincrease at
around 13:44:20 UT and 13:45:50 UT since they don’t satisfy our criteria of selecting sharp DF.
3 Kinetic structure of DF
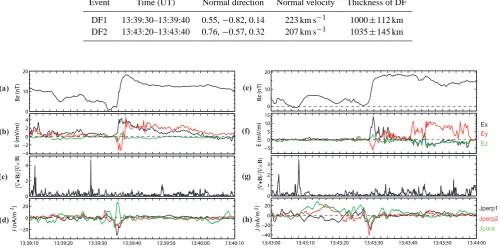
To determine the velocity of these fronts, multi-spacecraft timing analysis was used. The timing analysis results are summarized in Table 1. It is found that both fronts moved earthward, which is consistent with recent THEMIS obser-vations (Runov et al., 2009; Zhou et al., 2009). However, the fronts also moved in the dawnward direction since the normal direction deviated in the Y-direction. The normal ve-locities of two fronts, i.e. 223 km s−1 and 207 km s−1, are close to the ion plasma velocities in the normal direction with 195 km s−1and 236 km s−1, respectively. It implies that the DFs moved together with the fast plasma flow, which is con-sistent with the previous observations (Runov et al., 2009; Zhou et al., 2009). The thickness of the DF could be esti-mated byVn·t, whereVnis the normal speed of the front and
Table 1. Timing analysis results.
Event Time (UT) Normal direction Normal velocity Thickness of DF
DF1 13:39:30–13:39:40 0.55,−0.82, 0.14 223 km s−1 1000±112 km
DF2 13:43:20–13:43:40 0.76,−0.57, 0.32 207 km s−1 1035±145 km
0 10 20
Bz (nT)
−5 0 5 10 15
E (mV/m)
0 1 2 3
13:43:00 13:43:10 13:43:20 13:43:30 13:43:40 13:43:50 13:44:00 −40
−20 0 20
J (nA/m
2)
0 10 20
Bz (nT)
−4 −2 0 2 4
E (mV/m)
0 2 4
13:39:10 13:39:20 13:39:30 13:39:40 13:39:50 13:40:00 13:40:10 −20
0 20
J (nA/m
2)
|∇
•
B|/
|∇
×
B|
(a)
(b)
(c)
(d)
|∇
•
B|/
|∇
×
B|
(e)
(f)
(g)
(h)
Jperp1
Jperp2
Jpara
Ex
Ey
Ez
Fig. 3. Overview of electric field and electric current density around two DFs. (a)–(b) and (e)–(f) are the magnetic field componentBzand
electric field of Cluster-4, respectively. (c) and (g) are the values of|∇ ·B|/|∇ ×B|. (d) and (h) are electric current density in the field aligned coordinate (FAC).
the t based on the profile from the minimum ofBz to the
maximum ofBz. The thickness of the first front is estimated
to be about 1000±112 km ∼ρi(ρi∼964 km, is the local ion gyro-radius). The thickness of the second front is esti-mated to be about 1035±145 km∼0.85ρi (ρi∼1217 km). The thickness of kinetic-scale DF is consistent with results of obtained by THEMIS (Runov et al., 2009; Sergeev et al., 2009).
Figure 3 presents electric field and electric current density during the passage of two DFs. Two components of electric field are measured in the spin plane of the spacecraft which is nearly parallel to the geocentric solar ecliptic (GSE) X-Y plane, the third component can be obtained by the assump-tion ofE·B=0 (Borg et al., 2005). This assumption is expected to be valid everywhere except in the electron dif-fusion region where the electrons are not frozen in the mag-netic field lines. Before the arrival of DFs, electric fields were very small, less than 4 mV m−1(Fig. 3b and f). There were intense electric fields in the first front and the electric fields went up to 15 mV m−1in the second one.
The electric current density is calculated by the Curlome-ter method (Dunlop et al., 2002). Figure 3c and g are the values of |∇ ·B|/|∇ ×B|. Figure 3d and h displays elec-tric current density in Field Align coordinate (FAC). The
|∇ ·B|/|∇ ×B|reveals the computational efficiency of Cur-lometer method. The smaller values of|∇ ·B|/|∇ ×B|, the
more reliable the electric current density was. The values of |∇ ·B|/|∇ ×B| are small (Fig. 3c and g), i.e. less than 0.5 in the front, which indicates the estimated current den-sity are reliable. There are strong parallel and perpendicular components of current density at the DFs while current is small before and after the fronts (Fig. 3d and h). It means that the DFs not only correspond to strong transverse cur-rent, but also field aligned current. This field-aligned current may have close correlation with auroral activities.
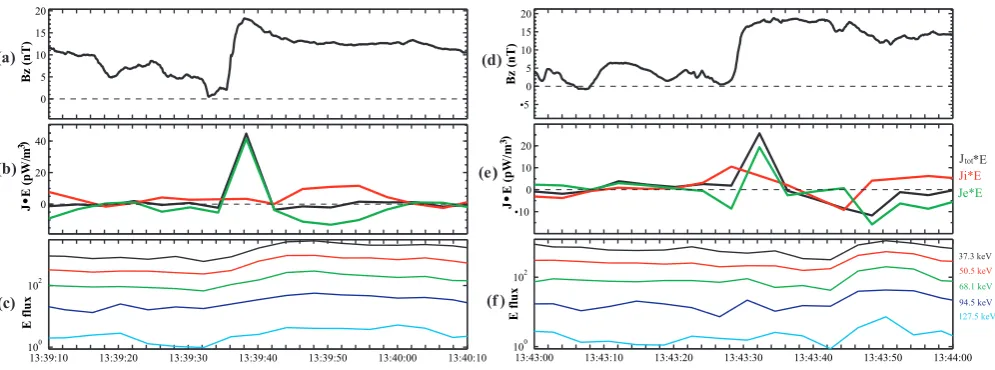
Figure 4 showsJ·Eterm associated with two DFs. Elec-tron current density is estimated byJe=Jtot−Ji, where Jtotis the total current density,Ji=NieViis the proton
cur-rent density,Ni is the proton density,eis the magnitude of
the electron charge andVi is the velocity of proton plasma
flow. Our event was not observed during a storm-time, so the heavy ion species, such as O+, He+and He++, are ten-uous. In addition, there were no large energetic ion fluxes (with energy higher than 40 keV) increase, soVicontributed
by high energy ions can be ignored. Therefore, the estimated
Jishould be reliable for the following analysis. The positive
0 5 10 15 20
Bz (nT)
0 20 40
J
•E (pW/
m
3)
13:39:10 13:39:20 13:39:30 13:39:40 13:39:50 13:40:00 13:40:10
100
102
E flux
(a)
(b)
(c)
•5 0 5 10 15 20
Bz (nT)
•10 0 10 20
J
•
E (pW/
m
3)
13:43:00 13:43:10 13:43:20 13:43:30 13:43:40 13:43:50 13:44:00
100
102
E flux
(d)
(e))
(f )
50.5 keV
68.1 keV
37.3 keV
94.5 keV 127.5 keV
J Ji*E Je*E
[image:5.595.49.547.61.246.2]tot*E
Fig. 4. Magnetic filedBz,J·E(Jtot·E,Ji·E, andJe·E), and the differential fluxes of energetic electrons (1/(cm2str s keV)) are displayed from top to bottom panels.
with the simulation (Sitnov et al., 2009). The energy dissipa-tion in fronts is dominated by electrons sinceJe·E>Ji·E.
The electron fluxes started to increase when the electromag-netic field energy was dissipated by electrons in the first front (Fig. 4b and c). However, the electron fluxes increased a few seconds later than theJe·E became positive at the second
front (Fig. 4e and f).
4 Wave analysis
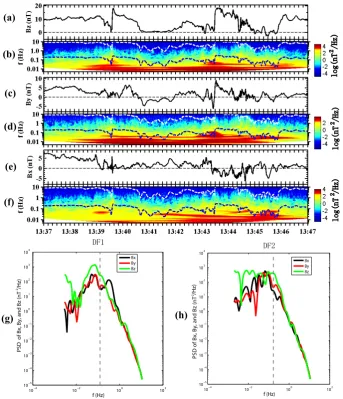
In this section, we investigate the wave properties associ-ated with the DFs. First, we investigate the waves below the lower hybrid frequency. Figure 5 shows the frequency-time spectrogram of three components of magnetic field measured by Cluster-4. Ion cyclotron frequency and lower hybrid frequency are marked by blue and white traces in each frequency-time spectrogram. Wave activities around the ion cyclotron frequency were observed in the front layer. The most remarkable feature is the inverse cascade in the power spectrum ofBzbefore the arrival of DFs (13:39:00–
13:39:34 UT and 13:43:05–13:43:27 UT). The inverse cas-cade was mainly between 0.02–0.1 Hz for the first DF and 0.01–0.09 Hz for the second DF (Fig. 5b). There were sim-ilar features in theBycomponent (Fig. 5d) andBx
compo-nent (Fig. 5f). Figure 5g and h also shows the power spectral density (PSD) during both DFs. We can see that the PSDs enhance around the ion cyclotron frequency.
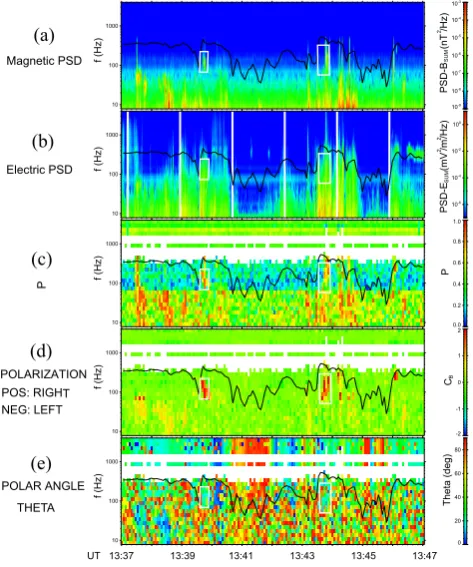
Second, there were higher frequency wave activities associated with the DFs. The waves in the frequency range from 10 Hz to 4000 Hz observed by STAFF instrument are analyzed by the Propagation Analysis of STAFF-SA Data with Coherency Tests (PRASSADCO) tool (Santolik et al., 2003). Figure 6 presents the polarization analysis results between 13:37 UT and 13:47 UT. Black curve on all panels
(a)
(b)
(c)
(d)
(e)
(f)
log(nT /Hz)log(nT /Hz)
log(nT /Hz)log(nT /Hz)
log(nT /Hz)log(nT /Hz)
10−4 10−2 100 102
10−5
10−4
10−3
10−2
10−1
100
101
102
103
104
f (Hz)
PSD of Bx, By, and Bz (nT
2/Hz)
Bx By Bz
10−4 10−2 100 102
10−5
10−4
10−3
10−2
10−1
100
101
102
103
104
f (Hz)
PSD of Bx, By, and Bz (nT
2/Hz)
Bx By Bz
(g) (h)
DF1 DF2
22
22
[image:6.595.126.470.61.461.2]22
Fig. 5. Power spectrograms of magnetic fields recorded by Cluster-4. (a), (c), and (e) are three components of magnetic fieldBz,Byand
Bx, respectively. (b), (d), and (f) are power spectrogram of three components of magnetic fieldBz,ByandBxobtained via wavelet analysis.
The blue and white traces show the Ion cyclotron frequency and lower hybrid frequency in each frequency-time spectrogram. (g) and (h) are the power spectrum densities (PSDs) around two DFs. The vertical dashed gray lines show the ion cyclotron frequency.
5 Discussion
Sitnov et al. (2009) found that the fronts are kinetic scale structure and the energy dissipation is dominated by ions in the front layer via two-dimensional full particle simulation. Figure 4b and 4e shows the DF is a load region (Jtot·E>0)
where the energy of electromagnetic field transfers to the plasma and kinetic energy, and the energy dissipation in fronts is dominated by electrons (Je·E>Ji·E), instead
of ions. At the first front, the energetic electrons enhance-ment was companied with positive values ofJe·E(Fig. 4c).
However, there was a slight lag between the positiveJe·E
and electron fluxes increase at the second front (Fig. 4f). DFs were found associated with fruiful wave activities from below the lower hybrid frequency to above the electron
CLUSTER STAFF-SA 2003-08-29 13:36:59.162 - 2003-08-29 13:47:02.997
[image:7.595.49.286.71.355.2]UT 13:37 13:39 13:41 13:43 13:45 13:47 Magnetic PSD 10-9 10-8 10-7 10-6 10-5 10-4 10-3 PSD-B SU M (n T 2/Hz) 10 100 1000 f (Hz) Electric PSD 10-6 10-4 10-2 100 PSD-E SU M (mV 2/m 2/Hz) 10 100 1000 f (Hz) 0.0 0.2 0.4 0.6 0.8 1.0 P 10 100 1000 f (Hz) POLARIZATION POS: RIGHT NEG: LEFT -2 -1 0 1 2 CB 10 100 1000 f (Hz) POLAR ANGLE THETA 0 20 40 60 80 Theta (deg) 10 100 1000 f (Hz) P (a) (b) (c) (d) (e)
Fig. 6. Polarization analysis of waves from 8 to 4000 Hz between 13:37 UT and 13:47 UT on Cluster-4. Note that the frequency scale is logarithmic on all panels. From top to bottom are: (a) power spectral density of magnetic fields; (b) power spectral density of electric fields; (c) planarity of polarization; (d) the sense of polar-ization and (e) the propagation angles of the waves with respect to ambient magnetic field. Black curve on all panels corresponds to the electron cyclotron frequency. The white rectangles show the whistler wave emissions around two DFs.
activities. This technique allows one to estimate the magnetic wave field energy distribution in the frequency and wave vec-tor domain from data measured simultaneously in several dif-ferent points in space, under the assumption of (sufficient) stationarity of the time series (more details on this technique can be found in Pinc¸on and Lefeuvre, 1991; Pinc¸on and Motschmann, 1998; Sahraoui et al., 2003, 2010a). There-fore we could obtain wave vectors for a series of frequencies and propagation angles. This method was successfully used in the solar wind (Sahraoui et al., 2010b), magnetosheath (Sahraoui et al., 2003, 2006), and magnetotail (Huang et al., 2010). Regular configuration of Cluster spacecraft in this event satisfies the restriction of using this method. We found that the propagation angles mainly varied between 60◦ and 120◦(not shown), i.e. quasi-perpendicular the ambient mag-netic field. Therefore, the low frequency waves are probably the nearly quasi-perpendicular propagating waves excited by Alfv´en ion cyclotron instability. In addition, the time du-ration of DFs, i.e. ∼10–20 s (corresponds 0.05–0.1 Hz) is
close to the frequencies of wave activities. Thus, the waves may play some roles in the time evolution of the DFs. The ion fluxes enhancements around DFs may be caused by the low wave activities with a frequency comparable to the local ion cyclotron frequency (Artemyev et al., 2009; Nos´e et al., 2010; Ono et al., 2009).
We also observed quasi-parallel whistler waves before, during and after the DFs. Le Contel et al. (2009) ex-plored quasi-parallel whistler waves before, during and af-ter the dipolarization. In hot plasma the electron temperature anisotropyT⊥e/Tke>1 is the source of whistler anisotropy
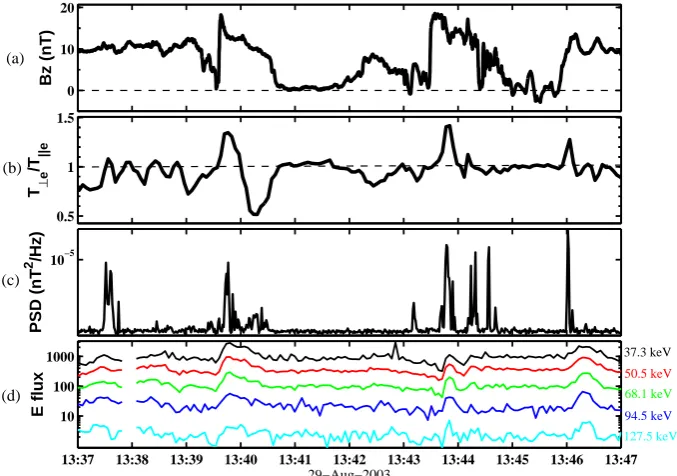
instability (Gary and Wang, 1996, and references therein). Figure 7 shows the magnetic field Bz, electron
tempera-ture anisotropy, power spectral density of whistler wave, and energetic electron fluxes between 13:37 UT and 13:47 UT recorded by Cluster-4. We found that there are good one to one correlations between whistler wave enhancements, electron anisotropies (T⊥e/Tke>1) and energetic electron
fluxes increase. Gary and Wang (1996) have shown that fast wave-particle scattering could enhance whistler fluctu-ations for large electron anisotropies. In order to compare the observations with the theory of the whistler mode insta-bility, we solved the dispersion relation under linear wave as-sumptions using the WHAMP code (Rˇonnmark, 1982). We chooseB0=10 nT as an average value of the background
magnetic field. Other average plasma parameters are as fol-lows: the plasma density was about 0.3 cm−3, proton temper-atureTi∼7 keV, electron temperatureTe∼1.6 keV, electron
anisotropyαe∼1.4, ion isotropyαi∼1. Figure 8 shows the
results from WHAMP with above parameters as input. We obtain the maximum growth rateγm≈0.0332ωceat the real
frequencyωr≈0.217ωce. The bandwidth withγm≥0 ranges
from 0.078 to 0.289ωce, which is from 22 to 81 Hz with
elec-tron cycloelec-tron frequencyfce=280 Hz (ordinary frequency),
consistent with the observed bandwidth shown in Fig. 6. Thus the results imply the whistler waves detected by the Cluster spacecraft were likely triggered by the electron tem-perature anisotropy. This is different from the tailward prop-agating negative DF, where the whistler waves were triggered by strong electron beams (Zhou et al., 2011). The generation mechanism of whistler waves around DF in different regions requires further detail analysis.
0 10 20
Bz (nT)
0.5 1 1.5
T ⊥
e
/T ||e
10−5
PSD (nT
2 /Hz)
13:37 13:38 13:39 13:40 13:41 13:42 13:43 13:44 13:45 13:46 13:47 10
100 1000
29−Aug−2003
E flux
(a)
(b)
(c)
(d)
50.5 keV 68.1 keV 37.3 keV
94.5 keV 127.5 keV
Fig. 7. (a) The Z-component of magnetic field; (b) ratios between the perpendicular and parallel electron temperatures, i.e. electron anisotropy; (c) total power spectrum density of magnetic field from 50 Hz to 250 Hz, i.e. power spectrum density of whistler waves; (d) the differential fluxes of energetic electrons (1/(cm2str s keV)).
0 0.1 0.2 0.3 0.4 0.5 0.6 0.7 0.8
0 0.1 0.2 0.3 0.4
Re (
ω
) /
ωce
0 0.1 0.2 0.3 0.4 0.5 0.6 0.7 0.8−0.15
−0.1 −0.05 0 0.05
P
Im (
ω
) /
[image:8.595.127.466.63.301.2]ωce
Fig. 8. WHAMP results: Real frequency Re(ω)/ωce (bule line)
and Imaginary frequency, i.e. damping/growth rates, Im(ω)/ωce(red
line) of the whistler anisotropy instability as function of the
modu-lus of the wave numberP=kρeand for different wave angles (wave
vectors with the respect of the ambient magnetic field) between 0◦
and 5◦from top to bottom.
might play some roles in electron energization at the fronts (Zhou et al., 2009). Whistler waves observed here might be able to efficiently accelerate electrons. Electron anisotropy was probably caused by betatron acceleration as electrons moved from low magnitude ambient field to strong dipolar-ization region. Then, the electron anisotropy triggered the
whistler waves. These whistler waves may further acceler-ate electrons to become energetic. Further investigation on the role of whistler wave to electronic dynamic requires self-consistent kinetic simulation.
There are a number of simulations and observations to study the generation mechanism of DF. Ohtani et al. (2004) compared observations with two-fluid simulation, and sug-gested the asymmetricBz bipolar structure of DF was due
to the passage of a magnetic island. Recently, Sitnov et al. (2009) found that the DF is a new regime of transient re-connection. It is well known that near earth neutral lines are often located atX∼ −20RE. In this paper, we observed two
DFs with bursty plasma flow atX∼ −17.5RE, and found
that the time interval was about 4 min between two fronts. Many features of the DFs observed here are similar to the simulations of Sitnov et al. (2009). Thus, we suggest that the DFs may be a result of interaction between ambient magnetic field and burst plasma flow from transient magnetic recon-nection, then the DFs move earthward (mainly) and dawn-ward. The low frequency wave activities, i.e. around ion cy-clotron frequency wave activities, may be also responsible for the time evolution of the DFs.
6 Summary
[image:8.595.52.285.374.543.2]embedded in fast plasma flow. Plasma density and ther-mal pressure decreased, while magnetic pressure increased associated with the DFs, like bubble structures. The front layer was a thin current sheet with intense parallel and per-pendicular current. There were energetic electron fluxes in-crease associated with the DFs. The thicknesses of the DFs were on the order of ion gyroradius length, which implies they were kinetic scale structures. We estimated the val-ues of J·E and found the fronts were energy dispersion region which is dominated by electrons. Strong wave activ-ities were detected around the front region. It is shown that there were intense wave activities around the ion cyclotron frequency in the front. These waves are likely generated by Alfv´en ion cyclotron instability. Whistler waves were also detected before, during and after the DFs, which coincident well with electron temperature anisotropy and energetic elec-tron fluxes enhancement. The results from WHAMP imply that these whistler waves are excited due to electron tempera-ture anisotropy. We also discussed the generation mechanism of DF and the relationship among the fronts, the waves and electron dynamics. Further understanding the microphysics of DF requires multi-spacecraft observations and more so-phisticated simulations, especially 3-D full particle simula-tion and large scale kinetic simulasimula-tion.
Acknowledgements. This work is supported by the National Natu-ral Science Foundation of China (NSFC) under grants 40890163, 41004060, and the Specialized Research Fund for State Key Lab-oratories. S. Y. Huang is also supported by the Fundamental Re-search Funds for the Central Universities. AE data were provided by the World Data Center for Geomagnetism in Kyoto. We thank the Cluster teams (FGM, CIS, EFW, PEACE, RAPID, and STAFF) and Cluster Active Archive for the high-quality data and successful operation.
Topical Editor I. A. Daglis thanks S. Machida and another anonymous referee for their help in evaluating this paper.
References
Artemyev, A. V., Zelenyi, L. M., Malova, H. V., Zimbardo, G., and Delcourt, D.: Acceleration and transport of ions in turbulent current sheets: formation of non-maxwelian energy distribution, Nonlin. Processes Geophys., 16, 631–639, doi:10.5194/npg-16-631-2009, 2009.
Ashour-Abdalla, M., El-Alaoui, M., Goldstein, M., Zhou, M., Schriver, D., Richard, R., Walker, R., Kivelson, M. G., and Hwang, K.: Observations and Simulations of Nonlocal Accelera-tion of Electrons in Magnetotail Magnetic ReconnecAccelera-tion Events, Nat. Phys., 7, 360–365, doi:10.1038/nphys1903, 2011.
Baker, D. N., Higbie, P. R., Hones, E. W., and Belian, R. D.: High resolution energetic particle measurements at 6.6RE 3. Low en-ergy electron anisotropies and short-term substorm predictions, J. Geophys. Res., 83, 4863–4868, 1978.
Balogh, A., Dunlop, M. W., Cowley, S. W. H., Southwood, D. J. Thomlinson, J. G., Glassmeier, K. H., Musmann, G., L¨uhr, H., Buchert, S., Acu˜na, M. H., Fairfield, D. H., Slavin, J. A., Riedler,
W., Schwingenschuh, K., and Kivelson, M. G.: The Cluster Mag-netic field Investigation, Sp. Sci. Rev., 79, 65–91, 1997. Baumjohann, W., Hesse, M., Kokubun, S., Mukai, T., Nagai, T.,
and Petrukovich, A. A.: Substorm dipolarization and recovery, J. Geophys. Res., 104, 24995–25000, 1999.
Borg, A. L., Øieroset, M., Phan, T. D., Mozer, F. S., Pedersen, A., Mouikis, C., McFadden, J. P., Twitty, C., Balogh, A., and Reme, H.: Cluster encounter of a magnetic reconnection diffusion re-gion in the near-Earth magnetotail on September 19, 2003, Geo-phys. Res. Lett., 32, L19105, doi:10.1029/2005GL023794, 2005.
Chen, C. X. and Wolf, R. A.: Interpretation of High-Speed
Flows in the Plasma Sheet, J. Geophys. Res., 98, 21409–21419, doi:10.1029/93JA02080, 1993.
Cornilleau-Wehrlin, N., Chanteur, G., Perraut, S., Rezeau, L., Robert, P., Roux, A., de Villedary, C., Canu, P., Maksimovic, M., de Conchy, Y., Hubert, D., Lacombe, C., Lefeuvre, F., Parrot, M., Pinc¸on, J. L., D´ecr´eau, P. M. E., Harvey, C. C., Louarn, Ph., San-tolik, O., Alleyne, H. St. C., Roth, M., Chust, T., Le Contel, O., and STAFF team: First results obtained by the Cluster STAFF experiment, Ann. Geophys., 21, 437–456, doi:10.5194/angeo-21-437-2003, 2003.
Deng, X., Ashour-Abdalla, M., Zhou, M., Walker, R., El-Alaoui, M., Angelopoulos, V., Ergun, R. E., and Schriver, D.: Wave and Particle Characteristics of Earthward Electron Injections Associ-ated with Dipolarization Fronts, J. Geophys. Res., 115, A09225, doi:10.1029/2009JA015107, 2010.
Dunlop, M., Balogh, A., Glassmeier, K.-H., and Robert,
P.: Four-point Cluster application of magnetic field
analy-sis tools: The Curlometer. J. Geophys. Res., 107, 1384,
doi:10.1029/2001JA005088, 2002.
Fu, H. S., Khotyaintsev, Y. V., Andr´e, M., and Vaivads, A.: Fermi and betatron acceleration of suprathermal electrons be-hind dipolarization fronts, Geophys. Res. Lett., 38, L16104, doi:10.1029/2011GL048528, 2011.
Gary, S. P. and Wang, J.: Whistler instability: Electron anisotropy upper bound, J. Geophys. Res., 101, 10749–10754, 1996. Gustafson, G., Bostr¨om, R., Holback, B., Holmgren, G., Lundgren,
A., Stasiewicz, K., Ahlen, L., Mozer, F. S., Pankow, D., Harvey, P., Berg, P., Ulrich, R., Pedersen, A., Schmidt, R., Butler, A., Fransen, A. W. C., Klinge, D., Thomsen, M., Falthammar, C.-G., Lindqvist, P.-A., Christenson, S., Holtet, J., Lybekk, B., Sten, T. A., Tanskanen, P., Lappalainen, K., and Wygant, J.: The Electric Field and Wave Experiment for the Cluster Mission, Space Sc. Rev., 79, 137–156, 1997.
Huang, S. Y., Zhou, M., Sahraoui, F., Deng, X. H., Pang, Y., Yuan, Z. G., Wei, Q., Wang, J. F., and Zhou, X. M.: Wave properties in
the magnetic reconnection diffusion region with highβ:
Appli-cation of the k-filtering method to Cluster multispacecraft data, J. Geophys. Res., 115, A12211, doi:10.1029/2010JA015335, 2010. Johnstone, A. D., Alsop, C., Gurge, S., Carter, P. J., Coates, A. J., Coker, A. J., Fazakerley, A. N., Grande, M., Gowen, R. A., Gur-giolo, C., Hancock, B. K., Narheim, B., Preece, A., Sheather, P. H., Winningham, J. D., and Woodcliffe, R. D.: PEACE, a plasma electron and current experiment, Space Sci. Rev., 79, 351–398, doi:10.1023/A:1004938001388, 1997.
S., Russell, C. T., Donovan, E., Mann, I., and Singer, H.: Quasi-parallel whistler mode waves observed by THEMIS dur-ing near-earth dipolarizations, Ann. Geophys., 27, 2259–2275, doi:10.5194/angeo-27-2259-2009, 2009.
Li, X., Baker, D. N., Temerin, M., Reeves, G. D., and Belian, R. D.: Simulation of dispersionless injections and drift echoes of ener-getic electrons associated with substorms, Geophys. Res. Lett., 25, 3763–3766, doi:10.1029/1998GL900001, 1998.
Lui, A. T. Y.: Current disruption in the Earth’s magnetosphere: Observations and models, J. Geophys. Res., 101, 13067–13088, doi:10.1029/96JA00079, 1996.
Lui, A. T. Y., Yoon, P. H., Mok, C., and Ryu, C.-M.: Inverse cascade feature in current disruption, J. Geophys. Res., 113, A00C06, doi:10.1029/2008JA013521, 2008.
Nakamura, R., Baumjohann, W., Klecker, B., Bogdanova, Y., Balogh, A., R`eme, H., Bosqued, J. M., Dandouras, I., Sauvaud, J.-A., Glassmeier, K.-H., Kistler, L., Mouikis, C., Zhang, T. L., Eichelberger, H., and Runov, A.: Motion of the dipolarization front during a flow burst event observed by Cluster, Geophys. Res. Lett., 29, 1942, doi:10.1029/2002GL015763, 2002. Nakamura, R., Baumjohann, W., Zhang, T. L., Carr, C. M., Balogh,
A., Fornacon, K.-H., Georgescu, E., R`eme, H., Dandouras, I., Takada, T., Volwerk, M., Asano, Y., Runov, A., Eichelberger, H., Klecker, B., Mouikis, C., Kistler, L. M., and Amm, O.: Cluster and Double Star observations of dipolarization, Ann. Geophys., 23, 2915–2920, doi:10.5194/angeo-23-2915-2005, 2005. Nos´e, M., Koshiishi, H., Matsumoto, H., C:son Brandt, P., Keika,
K., Koga, K., Goka, T., and Obara, T.: Magnetic field dipolar-ization in the deep inner magnetosphere and its role in
develop-ment of O+-rich ring current, J. Geophys. Res., 115, A00J03,
doi:10.1029/2010JA015321, 2010.
Ohtani, S., Takahashi, K., Zanetti, L. J., Potemra, T. A.,
McEn-tire, R. W., and Iijima, T.: Initial signatures of magnetic
field and energetic particle fluxes at tail reconfiguration: Ex-plosive growth phase, J. Geophys. Res., 97, 19311–19324, doi:10.1029/92JA01832, 1992.
Ohtani, S., Shay, M. A., and Mukai, T.: Temporal structure of the fast convective flow in the plasma sheet: Comparison between observations and two-fluid simulations, J. Geophys. Res., 109, A03210, doi:10.1029/2003JA010002, 2004.
Ono, Y., Nos´e, M., Christon, S. P., and Lui, A. T. Y.: The role of magnetic field fluctuations in nonadiabatic acceleration of ions during dipolarization, J. Geophys. Res., 114, A05209, doi:10.1029/2008JA013918, 2009.
Pinc¸on, J. L. and Lefeuvre, F.: Local characterization of homoge-neous turbulence in a space plasma from simultahomoge-neous measure-ments of field components at several points in space, J. Geophys. Res., 96, 1789–1802, 1991.
Pinc¸on, J. L. and Motschmann, U.: Multi-spacecraft filtering: Gen-eral framework, in: Analysis Methods for Multi-Spacecraft Data, edited by: Paschmann, G. and Daly, P. W., pp. 65–78, Int. Space Sci. Inst., Bern, Switzerland, 1998.
R`eme, H., Aoustin, C., Bosqued, J. M., Dandouras, I., Lavraud, B., Sauvaud, J. A., Barthe, A., Bouyssou, J., Camus, Th., Coeur-Joly, O., Cros, A., Cuvilo, J., Ducay, F., Garbarowitz, Y., Medale, J. L., Penou, E., Perrier, H., Romefort, D., Rouzaud, J., Vallat, C., Alcayd´e, D., Jacquey, C., Mazelle, C., d’Uston, C., M¨obius, E., Kistler, L. M., Crocker, K., Granoff, M., Mouikis, C., Popecki, M., Vosbury, M., Klecker, B., Hovestadt, D., Kucharek, H.,
Kuenneth, E., Paschmann, G., Scholer, M., Sckopke, N., Seiden-schwang, E., Carlson, C. W., Curtis, D. W., Ingraham, C., Lin, R. P., McFadden, J. P., Parks, G. K., Phan, T., Formisano, V., Amata, E., Bavassano-Cattaneo, M. B., Baldetti, P., Bruno, R., Chion-chio, G., Di Lellis, A., Marcucci, M. F., Pallocchia, G., Korth, A., Daly, P. W., Graeve, B., Rosenbauer, H., Vasyliunas, V., Mc-Carthy, M., Wilber, M., Eliasson, L., Lundin, R., Olsen, S., Shel-ley, E. G., Fuselier, S., Ghielmetti, A. G., Lennartsson, W., Es-coubet, C. P., Balsiger, H., Friedel, R., Cao, J.-B., Kovrazhkin, R. A., Papamastorakis, I., Pellat, R., Scudder, J., and Sonnerup, B.: First multispacecraft ion measurements in and near the Earth’s magnetosphere with the identical Cluster ion spectrometry (CIS) experiment, Ann. Geophys., 19, 1303–1354, doi:10.5194/angeo-19-1303-2001, 2001.
Ronnmark, K.: WHAMP-Waves in homogeneous anisotropic multi component plasmas, Kiruna Geophysical Institute Report, 179, 1982.
Runov, A., Angelopoulos, V., Sitnov, M. I., Sergeev, V. A., Bonnell, J., McFadden, J. P., Larson, D., Glassmeier, K.-H., and Auster, U.: THEMIS observations of an earthward-propagating dipolarization front, Geophys. Res. Lett., 36, L14106, doi:10.1029/2009GL038980, 2009.
Sahraoui, F., Pinc¸on, J. L., Belmont, G., Rezeau, L., Cornilleau-Wehrlin, N., Robert, P., Mellul, L., Bosqued, J. M., Canu, P., Balogh, A., and Chanteur, G.: ULF wave identification in the magnetosheath: k-filtering technique applied to Cluster II data, J. Geophys. Res., 108, 1335, doi:10.1029/2002JA009587, 2003. Sahraoui, F., Belmont, G., Rezeau, L., Cornilleau-Wehrlin,
N., Pinc¸on, J. L., and Balogh, A.: Anisotropic
tur-bulent spectra in the terrestrial magnetosheath as seen by the Cluster spacecraft, Phys. Rev. Lett., 96, 075002, doi:10.1103/PhysRevLett.96.075002, 2006.
Sahraoui, F., Belmont, G., Goldstein, M. L., and Rezeau, L.: Lim-itations of multispacecraft data techniques in measuring wave number spectra of space plasma turbulence, J. Geophys. Res., 115, A04206, doi:10.1029/2009JA014724, 2010a.
Sahraoui, F., Belmont, G., Goldstein, M. L., and Rezeau, L.: Three Dimensional Anisotropic k Spectra of Turbulence at Subpro-ton Scales in the Solar Wind, Phys. Rev. Lett., 105, 131101, doi:10.1103/PhysRevLett.105.131101, 2010b.
Santol´ık, O., Parrot, M., and Lefeuvre, F.: Singular value decom-position methods for wave propagation analysis, Radio. Sci., 38, 1010, doi:10.1029/2000RS002523, 2003.
Sergeev, V. A., Angelopulous, V., Gosling, J. T., Cattell, C. A., and Russell, C. T.: Detection of localized, plasma-depleted flux tubes or bubbles in the midtail plasma sheet, J. Geophys. Res., 101, 10817–10826, 1996.
Sergeev, V., Angelopoulos, V., Apatenkov, S., Bonnell, J., Er-gun, R., Nakamura, R., McFadden, J., Larson, D., and Runov, A.: Kinetic structure of the sharp injection/dipolarization front in the flow-braking region, Geophys. Res. Lett., 36, L21105, doi:10.1029/2009GL040658, 2009.
Shiokawa, K., Baumjohann, W., and Haerende, G.: Braking of high-speed flows in the near-Earth tail, Geophys. Res. Lett., 24, 1179–1182, 1997.
Shiokawa, K., Miyashita, Y., Shinohara, I., and Matsuoka,
A.: Decrease in Bz prior to the dipolarization in the
Sitnov, M. I., Swisdak, M., and Divin, A. V.: Dipolarization fronts as a signature of transient reconnection in the magnetotail, J. Geophys. Res., 114, A04202, doi:10.1029/2008JA013980, 2009. Wilken, B., Daly, P. W., Mall, U., Aarsnes, K., Baker, D. N., Belian, R. D., Blake, J. B., Borg, H., B¨uchner, J., Carter, M., Fennell, J. F., Friedel, R., Fritz, T. A., Gliem, F., Grande, M., Kecskemety, K., Kettmann, G., Korth, A., Livi, S., McKenna-Lawlor, S., Mur-sula, K., Nikutowski, B., Perry, C. H., Pu, Z. Y., Roeder, J., Reeves, G. D., Sarris, E. T., Sandahl, I., Søraas, F., Woch, J., and Zong, Q.-G.: First results from the RAPID imaging ener-getic particle spectrometer on board Cluster, Ann. Geophys., 19, 1355–1366, doi:10.5194/angeo-19-1355-2001, 2001.
Wu, P., Fritz, T. A., Larvaud, B., and Lucek, E.: Substorm as-sociated magnetotail energetic electrons pitch angle evolutions and flow reversals: Cluster observation, Geophys. Res. Lett., 33, L17101, doi:10.1029/2006GL026595, 2006.
Yoon, P. H., Lui, A. T. Y., and Bonnell, J. W.:
Iden-tification of plasma instability from wavelet spectra in a current disruption event, J. Geophys. Res., 114, A04207, doi:10.1029/2008JA013816, 2009.
Zhou, M., Ashour-Abdalla, M., Deng, X., Schriver, D.,
El-Alaoui, M., and Pang, Y.: THEMIS observation of
multi-ple dipolarization fronts and associated wave characteristics in the near-Earth magnetotail, Geophys. Res. Lett., 36, L20107, doi:10.1029/2009GL040663, 2009.