THE EFFECT OF ANALYSIS METHODS ON THE RESPONSE OF
STEEL DUAL-SYSTEM FRAME BUILDINGS FOR SEISMIC
RETROFITTING
G. Ghodrati Amiri* and H. Hamidi Jamnani
Center of Excellence for Fundamental Studies in Structural Engineering School of Civil Engineering, Iran University of Science and Technology
P.O. Box 16765-163, Tehran, Iran [email protected] - [email protected]
H.R. Ahmadi
Department of Civil Engineering, Tarbiat Modares University P.O. Box 14155-4838, Tehran, Iran
*Corresponding Author
(Received: February 23, 2009 – Accepted in Revised Form: November 5, 2009)
Abstract In the present paper, the focus is on the evaluation of steel dual-system frame buildings using four main types of structural analysis (Linear Static, Linear Dynamic, Nonlinear Static and Nonlinear Dynamic Analyses) with regard to "Seismic Rehabilitation Code for Existing Buildings in Iran" (based on FEMA 273 and 356) where the first two authors of the article tend to follow the previous work (Section 2). The difference of the results taken from these four types of analyses and also seismic performance of the dual-system buildings will be studied in both linear and nonlinear treatments. Three 2D models which include 3 common dual-system buildings (5,10 and 15-story) have been chosen and designed subjected to earthquake based on the Standard No. 2800 of Iran (3rd revision). Then, the 2D models have been analyzed and controlled according to “Seismic Rehabilitation Code for Existing Buildings”. The selected rehabilitation goal for this research is Fair (Controlling Life Safety and Collapse Prevention in two hazard levels derived from PSHA analysis). Based on the research results, the main role of lateral load-bearing is on bracing members. The linear analysis of bracing members evaluation, has a low accuracy, in evaluation of columns the results derived from linear static analysis shows more accuracy than linear dynamic and nonlinear static analyses. Also, the accuracy of nonlinear static analysis decreases when the number of stories increases.
Keywords Seismic Retrofitting, Steel Dual-System Frame Building, Linear Analysis, Nonlinear Analysis, Seismic Hazard Analysis
ﻜﭼ
ﻴ
ﻩﺪ
ﺍﺭﺩ ﻳ ﻥﺎﻤﺘﺧﺎﺳ،ﻪﻟﺎﻘﻣﻦ ﺎﻫﻱ ﺩﻻﻮﻓ ﻱ ﻪﺑﻞﻤﻌﻟﺍﺭﻮﺘﺳﺩﺱﺎﺳﺍﺮﺑ،ﻪﻧﺎﮔﻭﺩ ﺯﺎﺳ
ﻱ ﻩﺯﺮﻟ ﺍ ﻱ ﺭﺎﻬﭼﺯﺍﻩﺩﺎﻔﺘﺳﺍﺎﺑ
ﻠﺻﺍ ﺵﻭﺭ ﻉﻮﻧ ﻲ ﻠﺤﺗ ﻴ ﻩﺯﺎﺳ ﻞ ﺎﻫ ) ﺗﺎﺘﺳﺍ ﻴ ﮑ ﻲ ﻄﺧ ﻲ ﺩ ، ﻳ ﻣﺎﻨ ﻴ ﮑ ﻲ ﻄﺧ ﻲ ﺗﺎﺘﺳﺍ ، ﻴ ﮑ ﻲ ﻏ ﻴ ﻄﺧﺮ ﻲ ﺩ ﻭ ﻳ ﻣﺎﻨ ﻴ ﮑ ﻲ ﻏ ﻴ ﻄﺧﺮ ﻲ ( ﺯﺭﺍﺩﺭﻮﻣ ﻳﺑﺎ ﻲ ﺮﻫ ﺯﺍﻞﺻﺎﺣﺦﺳﺎﭘﺕﻭﺎﻔﺗ،ﻪﺘﻓﺮﮔﺭﺍﺮﻗ ﻳ ﺯﺍﮏ ۴ ﻠﺤﺗ ﻉﻮﻧ ﻴ ﻞ ﻳ ﻨﭽﻤﻫﻭﻩﺪﺷﺩﺎ ﻴ
ﻩﺯﺮﻟﺩﺮﮑﻠﻤﻋ ﻦ ﺍ ﻱ ﻩﺯﺎﺳ ﺷﺎﻧ ﺎﻫ ﻲ ﻥﺁ ﺯﺍ ﺎﻫﺭﺎﺘﻓﺭ ﻩﺯﻮﺣ ﺭﺩ ﺎﻫ ﻱ ﻄﺧ ﻲ ﻏ ﻭ ﻴ ﻄﺧﺮ ﻲ ﺳﺭﺮﺑ ﻲ ﻣ ﻲ ﺩﺩﺮﮔ . ﺪﺑ ﻳ ﻦ ﺪﻌﺑﻭﺩ ﻝﺪﻣﻪﺳ ﺭﻮﻈﻨﻣ ﻱ
ﻑﺭﺎﻌﺘﻣﻥﺎﻤﺘﺧﺎﺳﻪﺳﻞﻣﺎﺷ ۵
، ۱۰ ﻭ ۱۵ ﺩﺭﺍﺪﻧﺎﺘﺳﺍﻖﺒﻃﻭﺏﺎﺨﺘﻧﺍﻪﻘﺒﻃ ۲۸۰۰ ) ﻭﻳ ﺍﺮ ﻳ ﻡﻮﺳﺶ ( ﺣﺍﺮﻃ ﻲ ﺎﺑﻭﻩﺪﺷ
ﺎﺘﻧﺯﺍﻩﺩﺎﻔﺘﺳﺍ ﻳ ﻠﺤﺗﺞ ﻴ ﻞ ﺭ ﻳ ﻻﺎﻤﺘﺣﺍﮏﺴ ﺗ ﻲ ﺍ،ﻥﺍﺮﻬﺗﺰﮐﺮﻣﺭﺩﺮﻄﺧ ﺢﻄﺳﻭﺩﺭﺩ ﻳ
ﻪﺑﻑﺪﻫﺖﺤﺗﻝﺪﻣﻪﺳﻦ ﺯﺎﺳ
ﻱ
ﺵﻭﺭﺎﺑﺏﻮﻠﻄﻣ ﺎﻫ
ﻱ ﻳ ﻠﺤﺗﻩﺪﺷﺩﺎ ﻴ
ﺩﺮﮔﻝﺮﺘﻨﮐﻭﻞ ﻳ ﺪﻧﺪ . ﺎﺘﻧﻖﺑﺎﻄﻣ ﻳ ﺍﺞ ﻳ ﻘﺤﺗﻦ ﻴ ﻠﺻﺍﺶﻘﻧ ،ﻖ ﻲ ﺮﺑﺭﺎﺑ ﻱ ﻩﺯﺮﻟ ﺍ ﻱ ﺮﺑ ﺎﻀﻋﺍ ﻩﺪﻬﻋ ﻱ ﺪﻨﺑﺭﺎﻬﻣ ﻱ ﻣ ﻲ ﺪﺷﺎﺑ . ﻠﺤﺗ ﺖﻗﺩ ﻴ ﻞ ﺎﻫ ﻱ ﻄﺧ ﻲ ﺯﺭﺍ ﺭﺩ ﻳﺑﺎ ﻲ ﺎﻀﻋﺍ ﻱ ﺪﻨﺑﺭﺎﻬﻣ ﻱ ﻣﻢﮐ ﻲ
ﺯﺭﺍﺭﺩ،ﺪﺷﺎﺑ ﻳﺑﺎ ﻲ ﻮﺘﺳ ﻥ ﺎﺘﻧﺎﻫ ﻳ ﻠﺤﺗﺞ ﻴ ﺗﺎﺘﺳﺍﻞ ﻴﮑ ﻲ ﻄﺧ ﻲ ﻠﺤﺗﻪﺑﺖﺒﺴﻧ ﻴ ﻞ ﺎﻫ ﻱ ﺩ ﻳ ﻣﺎﻨ ﻴﮑ ﻲ ﻄﺧ ﻲ ﺗﺎﺘﺳﺍﻭ ﻴﮑ ﻲ ﻏ ﻴ ﻄﺧﺮ ﻲ ﻌﻗﺍﻭﻪﺑ ﻴ ﺩﺰﻧﺖ ﻳ ﺮﺘﮑ ﻣ ﻲ ﺪﺷﺎﺑ . ﻨﭽﻤﻫ ﻴ ﺍﺰﻓﺍﺎﺑﻦ ﻳ ﻠﺤﺗﺖﻗﺩﺯﺍ،ﻥﺎﻤﺘﺧﺎﺳﺕﺎﻘﺒﻃﺩﺍﺪﻌﺗﺶ ﻴ ﺗﺎﺘﺳﺍﻞ ﻴﮑ ﻲ ﻏ ﻴ ﻄﺧﺮ ﻲ ﺯﺭﺍﺭﺩ ﻳﺑﺎ ﻲ ﻣﻪﺘﺳﺎﮐﺎﻫ ﻲ ﺩﻮﺷ
.
1. INTRODUCTION
Seismic retrofitting is the modification of existing
earthquake engineering implies design, evaluation, construction, monitoring the function and maintenance of engineering facilities (Bozorgnia, et al [1]). The results of the studies done in advance in the field of seismic response of steel frame buildings under the cyclic load of earthquake (e.g., Fragiacomo, et al [2]) showed that due to plastic behaviour of structures in strong ground motions, strength can not be regarded a sufficient criteria for seismic design. Thus, the idea of performance based design which has a more comprehensive concept than previous common methods has been formed. In this method the criteria of design is presented based on performance goals. Therefore, with combining earthquake level and building performance level, a performance goal can be formed (Grecca, et al [3]). The 8-billion dollar loss caused by Loma Prieta earthquake in 1989, prompted SEAOC decision making group (SEAOC [4]) to form the primary idea of making performance based design code in 1992. But nothing special (except some limited activities) was done in this field until Northridge earthquake with magnitude of 6.7 Richter (with its 20-billion dollar loss) showed the importance of the issue more than ever. Following this issue, VISION 2000 committee (SEAOC [4]) has announced a report (Bertero [5]) for performance based design in 1995. Therefore, Bertero (Bertero [6]) reexamined the SEAOC instruction for new buildings and NEHRP did the same for seismic retrofitting of existing buildings in 1997 (FEMA [7]). Finally, a main and primary source called FEMA 273 (its new revision named FEMA 356 [8]) was made available for engineers and consultants in relation to performance based design.
2. RESEARCH METHODOLOGY
The aim of this research is to investigate seismic response of steel dual-system frame buildings for seismic retrofitting following the previous work of the first two authors of this paper (Ghodrati, et al [9]). In this research, the 2D models which include three common 5, 10, 15-story dual-system buildings have been chosen, designed according to 2800 Standard (Standard No. 2800 [10]). Based on “Seismic Rehabilitation Code for Existing Buildings” (IIEES [11]), the selected rehabilitation
goal which is used for the buildings control is fair (see Section 10), where the spectra have been derived from Section 8. The process has been carried out with the help of four main methods of analysis (Linear Static, Linear Dynamic, Nonlinear Static and Nonlinear Dynamic Analyses) in SAP 2000 program. In the end, the results were summarized and concluded.
3. DIFFERENT METHODS OF STRUCTURAL ANALYSIS
Four different types of analysis are mentioned in “Seismic Rehabilitation Code for Existing Buildings” (IIEES [11]) which are as followings:
A. Linear Static Analysis, B. Nonlinear Static Analysis, C. Linear Dynamic Analysis, D. Nonlinear Dynamic Analysis.
A comprehensive description is described in FEMA 273 [7] and a brief description is presented for each:
3.1. Linear Static Analysis
The pseudo lateral load of earthquake in linear static method is selected in a way that the base shear be equal to the base shear shown by Equation 1. In this method, the amount of the mentioned base shear is chosen in such a way that the maximum deformation of structure be in accordance with the predicted hazard level earthquake (IIEES [11]).W a S m C 3 C 2 C 1 C
V= (1)
Lateral force distribution on building height according to the weight, height and base shear force of the stories are presented in Equation 2.
V . n
1 j
k j h j W
k i h i W i F
∑ =
= (2)
3.3. Nonlinear Static Analysis (Pushover)
Nonlinear static procedures (NSPs) are now widely used in engineering practice to predict seismic demands in building structures (Kalkan, et al [12]). Reliability and accuracy of this type of analysis has been verified by some researches (Moghadam, et al [13]), and also new methods have been developed gradually such as Modal Pushover Analysis (Chopra, et al [14]) and Adaptive Pushover Procedure (Antonio, et al [15]). For structures with rigid diaphragms, the mathematical based model of the building should undergo the monotonically increasing lateral forces or displacements until either a target displacement (Equation 3) is reached or the building collapses (IIEES [11]).
g 2 4
2 e T a S 3 C 2 C 1 C 0 C
t = π
δ (3)
As mentioned below, two types of lateral load distribution have been used on structures:
• DistributionTypeI: Distribution corresponding to lateral forces derived from linear dynamic method (spectrum analysis).
• Distribution Type II: Uniform distribution (in which lateral forces is calculated corresponding to the mass distribution at each floor level).
3.4. Nonlinear Dynamic Analysis
The most appropriate method which is used for the structural analysis is nonlinear dynamic procedure, even though as Elnashai states the “necessity domain” of nonlinear dynamic analysis as against static inelastic analysis is ever decreasing [16]. In this method, solving the differential equation of dynamic equilibrium of motion (Equation 4) is actually the main goal.) t ( r ) t ( u M ) t ( u C ) t ( u
K + & + && = (4)
Where: M, C, K are mass, damping and stiffness matrixes, respectively. r(t) is external force vector. u&&,u& andu are the acceleration, velocity and displacement vectors, respectively (Clough [17]). Nonlinear dynamic analysis is done in two general methods: 1-Direct Integration, 2-Modal Analysis (Bathe [18]). Direct integration can be done by methods of Houbolt, Central Difference,
Wilson-θ and Newmark. Direct integration method (Wilson-θ and Newmark) has been used in the present research.
4. STUDIED MODELS
Three symmetric and regular 5, 10, 15-story dual-system buildings have been selected. The models are regarded as common building because the ratio of height to width varies from 1.5 to 3. For each model:
* The height of first story is 3.8 m and the rest are 3.2 m.
* Bay width for each direction is 4 m.
* Cross brace system (because of wide usage) + moment resistant frame is used.
The buildings are located in the center of Tehran. They are residential and have an average importance. The resistance system against lateral loads is braced frame + moment resistant frame in all models. The elevations of the buildings under study are shown in Figure 1.
5. MATERIAL SPECIFICATIONS AND ELEMENT SECTIONS
Material specifications are mentioned below: E = 2 * 105 MPa, F
y = 235 MPa, Fu = 392 MPa, ν =
0.3.
Box, IPE and Box sections, based on DIN Standard, have been selected for columns, beams and bracings, respectively.
6. DESIGNING AND ANALYSIS SOFTWARE
7.LOADING AND DESIGNINGACCORDING TO 2800 STANDARD
Gravity loading of the models is based on “National Building Code for Structural Loadings” (Standard No. 519 [21]). Accordingly the lateral loading is based on 2800 Standard (Standard No. 2800 [10]). Dead and live area loads calculated in the stories are 220 MPa/m, 40 MPa/m, respectively. The same loads in the roof are 145 MPa/m, 30 MPa/m, respectively. To evaluate the effect of earthquake lateral loading according to 2800 Standard (Standard No. 2800 [10]), static equivalent loading method has been used. Values of seismic parameters are stated below:
* Importance Factor: I = 1
* Base Design Acceleration: A = 0.35 g * Soil Type: Type II (Tsoil = 0.5 s.)
Design Code AISC-ASD89 has been used for designing members. Specific criteria for steel dual-system frame buildings which are earthquake
resistant according to 2800 Standard (Standard No. 2800 [10]) and (National Building Code for Steel Structures [22]) are mentioned below:
* Reduction of allowed compressive stress in bracing members
* Controlling the least slenderness of bracing members
* Controlling of columns in load combinations mentioned below:
A. Axial pressure PDL+0.8PLL+2.8PE≤PSC B. Axial tension 0.85PDL+2.8PE≤PST
8. PROBABILISTIC SEISMIC HAZARD ANALYSIS (PSHA)
A probabilistic seismic hazard analysis has been done previously (Ghodrati, et al [9]) in center of Tehran in two hazard levels (HL1 and HL2). For
(a) (b) (c)
this analysis (PSHA), appropriate attenuation relationships for Iranian plateau have been chosen (Ghodrati, et al [23]). The buildings have been evaluated in two hazard levels. Hazard level 1 is determined based on 10 % earthquake probability of exceedance in 50 years where the return period equals 475 years. Hazard level 2 is determined based on 2 % earthquake probability of exceedance in 50 years where the return period equals 2475 years. The obtained design spectra are shown in Figure 2.
9. APPROPRIATE ACCELEROGRAMS AND THE SCALING PROCESS
9.1. Selecting Appropriate Accelerograms
In this study, 7 accelerograms (Table 1) similar to the previous work of the first two authors of this paper (Ghodrati, et al [9]) have been used for the nonlinear dynamic procedure, so their average response values have been used to control the deformations and internal forces. The accelerograms used for nonlinear dynamic procedure should haveSpectra (Sa)
0 0.2 0.4 0.6 0.8 1 1.2 1.4 1.6 1.8
0 0.5 1 1.5 2 2.5 3 3.5 4 4.5
Sa
(
g
)
2800 10% 2%
T(S.)
Figure 2. Design spectra based on PSHA and 2800 Standard (Ghodrati, et al [9]).
TABLE 1. Accelerograms and the Utilized Scale Factors (Nonlinear Dynamic Analysis) (Ghodrati, et al [9]).
Record
No. Record Name Date Station PGA (g)
Area under Normalized Spectrum (T=0.1-3.0)
Scale Factor (HL 1)
Scale Factor (HL 2) 1 Capemendocino 1992 Capemend-rio270 0.385 2.67 1.3 1.34
2 Kocaeli 1999 Kocaeili-skr090 0.376 2.46 1.41 1.45
3 Kobe 1995 Kobe-kjm000 0.821 3.11 1.11 1.15
4 Northridge 1994 Northt-oppr360 0.514 3.06 1.13 1.17
matching specifications with the site of the structure. The mentioned specifications include PGA, duration, frequency contents and conformity with design spectra (Lestuzzi, et al [24]). To use the accelerograms in nonlinear dynamic analysis, the spectrum of this accelerogram should be in great conformity with design spectrum of the site. Therefore, they should be scaled before using the accelerograms.
9.2. Scaling Accelerograms
These accelerograms have been scaled by using spectrum scaling method. In this method at first the maximum acceleration of each accelerograms is scaled to 1g (g=gravity acceleration). Then the response of SDOF system (single-degree-of-freedom) is calculated versus the specified records. The area under this spectrum is calculated between periods of 0.1 second and 3 seconds. Accordingly, the area under site spectrum curve between the same two periods is determined. The scaled accelerogram can be obtained by Equation 5:s ) PGA ( s 2 A1s A ng A sc
A = × × (5)
Where Asc is the scaled accelerogram, Ang is the
accelerogram normalized to 1g, A1s is the site
spectrum area, A2s is the accelerogram spectrum
area and (PGA)s is the site design acceleration. The
energy of accelerograms is conformed to design spectrum by using this method (Lestuzzi, et al [24]).
10. DISCUSSION
Designed models which are based on 2800 Standard (Standard No. 2800 [10]) have been analyzed according to “Seismic Rehabilitation Code for Existing Buildings” (IIEES [11]), using four main types of analyses which include Linear Static, Nonlinear Static, Linear Dynamic and Nonlinear Dynamic procedures. The selected rehabilitation goal for this study is Fair (Controlling Life Safety and Collapse Prevention in two hazard levels). In nonlinear static method, two different kinds of load distributions (Types I and II) are implemented on the models. Spectrum method and time-history method has been used in linear dynamic and
nonlinear dynamic analysis, respectively.
For Deformation-Controlled actions, design actions QUD shall be calculated based on:
LL DL G Q
EQ E Q
E Q G Q UD Q
+ = =
± =
and for Force-Controlled actions, design actions QUF shall be calculated based on:
LL DL G Q
EQ E Q
J 3 C 2 C 1 C
E Q G Q UF Q
+ = =
± =
, (IIEES [11]).
Where LL is the effective live load (action), equal to 0.25 of the unreduced design live load, but not less than the actual live load.
10.1. Linear Static Procedure
The mentioned models with the forces presented in Table 2 have been loaded and then evaluated. Acceptance criteria were implemented based on “Seismic Rehabilitation Code for Existing Buildings” (IIEES [11]), a brief description is shown below: 1. Deformation-controlled actions should satisfythe following equation in primary and secondary components and elements:
UD Q CE Q . k .
m ≥
2. Force-controlled actions should satisfy the following equation in primary and secondary components and elements:
UF Q CL Q .
k ≥
Where QCE =PCE =1.7AFas or QCE =TCE =AFye for braces in compression or tension, respectively. and
ye F . Z CE M CE
Q = = for beams.
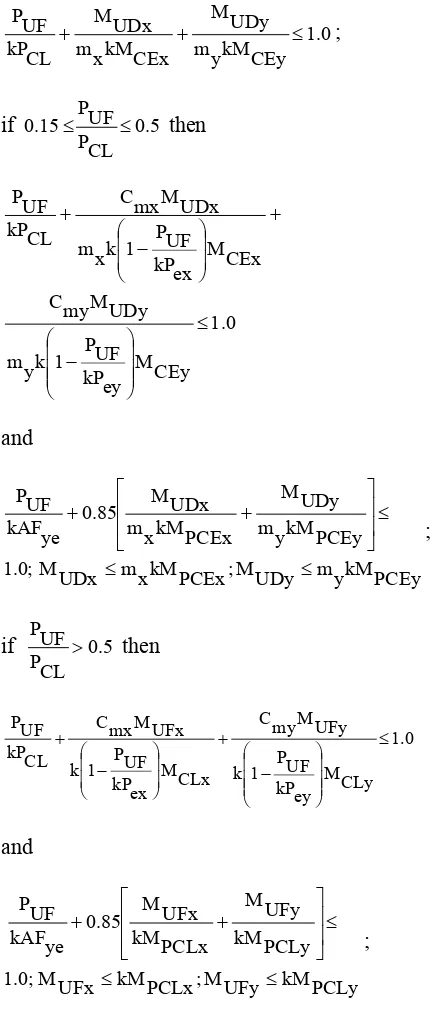
For columns, if 0.15 CL P
UF P
0 . 1 CEy kM y m UDy M CEx kM x m UDx M CL kP UF P ≤ + + ;
if 0.5
CL P UF P 15 .
0 ≤ ≤ then
0 . 1 CEy M ey kPUF P 1 k y m UDy M my C CEx M ex kP UF P 1 k x m UDx M mx C CL kP UF P ≤ ⎟⎟ ⎟ ⎠ ⎞ ⎜⎜ ⎜ ⎝ ⎛ − + ⎟ ⎟ ⎠ ⎞ ⎜ ⎜ ⎝ ⎛ − + and PCEy kM y m UDy M ; PCEx kM x m UDx M ; 0 . 1 PCEy kM y m UDy M PCEx kM x m UDx M 85 . 0 ye kAF UF P ≤ ≤ ≤ ⎥ ⎥ ⎦ ⎤ ⎢ ⎢ ⎣ ⎡ + + ;
if 0.5 CL
PUF
P
> then
0 . 1 CLy M ey kP UF P 1 k UFy M my C CLx M ex kP UF P 1 k UFx M mx C CL kP UF P ≤ ⎟⎟ ⎟ ⎠ ⎞ ⎜⎜ ⎜ ⎝ ⎛ − + ⎟ ⎟ ⎠ ⎞ ⎜ ⎜ ⎝ ⎛ − + and PCLy kM UFy M ; PCLx kM UFx M ; 0 . 1 PCLy kM UFy M PCLx kM UFx M 85 . 0 ye kAF UF P ≤ ≤ ≤ ⎥ ⎥ ⎦ ⎤ ⎢ ⎢ ⎣ ⎡ + + ;
The general assumptions have been used in evaluating all models are presented below:
* K, the knowledge factor = 1 * The rehabilitation goal is fair
The results of the evaluation are presented in Table 3. Based on this method, all beams and bracing members (deformation-controlled) have satisfied the acceptance criteria but lack of
acceptance of these criteria quite stands out in some percentage of columns.
10.2. Linear Dynamic Procedure
The mentioned models have been analyzed and evaluated with spectrum obtained from PSHA analysis (Section 8).The values of parameters used in this method are presented in Table 4. Acceptance criteria are implemented like Section 10.1.
The results of the evaluation are shown in Table 5. Based on this method, all bracing and beams members (deformation-controlled) have satisfied the acceptance criteria. In hazard level 2, lack of acceptance of these criteria is evident in some percentage of columns.
10.3. Nonlinear Static Procedure
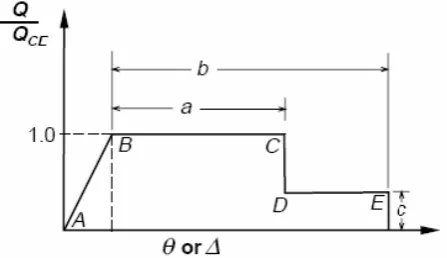
The mentioned models have been analyzed and evaluated by nonlinear static analysis (Target Displacement Method). Needed parameters for this analysis are presented in Table 6.In order to model the stiffness of members in nonlinear static procedure, the principles of “Seismic Rehabilitation Code for Existing Buildings” (IIEES [11]) have been used. For modeling force-deformation curve of members (Figure 3), nonlinear parameters and acceptance criteria of section TUBO 100x100x10 are shown in Table 7 as a sample. Strain-hardening of components is accounted based on the slope of 3% of the elastic slope. In this table, d/t shows the ratio of depth/thickness. The results of the evaluation are presented in Table 8. As presented below, all beams (deformation-controlled) have satisfied the acceptance criteria, some percentage (exact values shown in Table 8) of bracing members (deformation-controlled) and columns have not satisfied acceptance criteria. Note that by increasing the stories the percentage of columns which have not satisfied the acceptance criteria will decrease.
TABLE 2. Loading Details Based on Linear Static Method.
Earthquake Force Evaluation-Linear Static Procedure
Building 5-Story 10-Story 15-Story
Period T = 0.514 s. T = 0.85 s. T = 1.15 s.
Hazard Level HL 1 HL 2 HL 1 HL 2 HL 1 HL 2
Story Force fi(ton) fi(ton) fi(ton) fi(ton) fi(ton) fi(ton)
15 - - - - 37.82 65.95
14 - - - - 52.52 91.59
13 - - - - 48.49 84.57
12 - - - - 44.47 77.56
11 - - - - 40.12 69.97
10 - - 30.85 53.62 35.76 62.37
9 - - 41.39 71.95 31.45 54.85
8 - - 36.47 63.39 27.41 47.80
7 - - 31.63 54.98 23.27 40.59
6 - - 27.00 46.93 19.01 33.15
5 31.48 57.49 22.13 38.47 15.22 26.54
4 38.40 70.11 17.32 30.10 11.50 20.06
3 29.55 53.97 12.75 22.16 8.01 13.97
2 20.49 37.42 8.24 14.31 4.90 8.54
1 11.23 20.51 4.10 7.13 2.23 3.88
TABLE 3. Percentage of the Members which Don’t Satisfy the Acceptance Criteria (Linear Static).
Hazard Level 2 Hazard Level 1 LSP
TABLE 4. The Values of Parameters (Linear Dynamic).
Building 5-Story 10-Story 15-Story Note
Hazard Level (HL) HL 1 HL 2 HL 1 HL 2 HL 1 HL 2
C1 1 1 1 1 1 1 1 2TT 0T.2
0 0 − − +
C2 1 1 1 1 1 1 Linear Analysis
C3 1 1 1 1 1 1 θ < 0.1
T0 0.5 0.5 0.5 0.5 0.5 0.5 Soil Type II
T 0.514 0.85 1.15 2800 Standard
Tdynamic 0.52 0.77 1.3 Modal Analysis
TABLE 5. Percentage of the Members which Don’t Satisfy the Acceptance Criteria (Linear Dynamic).
Hazard Level 2 Hazard Level 1 LDP
Beam Column Bracing Beam Column Bracing Building 0 40 0 0 0 0 5-Story 0 4 0 0 0 0 10-Story 0 0 0 0 0 0 15-Story
TABLE 6. Needed Parameters for Nonlinear Static Analysis.
Parameters for Nonlinear Static Analysis-Load Distribution Type I and II
Building 5-Story 10-Story 15-Story
Hazard Level (HL) HL 1 HL 2 HL 1 HL 2 HL 1 HL 2 Note
C0 1.4 1.4 1.5 1.5 1.5 1.5 Distribution Type I and II
C1 1.0 1.0 1.0 1.0 1.0 1.0 Te > T0
C2 1.1 1.2 1.1 1.2 1.1 1.2 LS-->C2=1.1, CP-->C2=1.2
C3 1.0 1.0 1.0 1.0 1.0 1.0 α>0
Sa (g) 0.92 1.54 0.59 0.94 0.436 0.697 Spectrum
T0 (s.) 0.5 0.5 0.5 Soil Type II
Te (s.) 0.514 0.852 1.15 Experimental
δt (cm) 8.46 14.15 15.98 25.47 21.5 34.36 g
4 T S C C C
C 2
2 e a 3 2 1 0 t
π =
δ
TABLE 7. Parameters and Acceptance Criteria in Nonlinear Static Analysis (Bracing Members).
Nonlinear Hinge Parameters
Compression Tension
Section
(TUBEBOX) d/t a b c IO LS CP a b c IO LS CP
100x100x10 10 0.5 7 0.4 0.25 3 4 11 14 0.8 0.25 7 9
TABLE 8. Percentage of the Members which Don’t Satisfy the Acceptance Criteria (Nonlinear Static).
Hazard Level 2 Hazard Level 1 NSP
Type II Type I Type II Type I
Beam Column Bracing Beam Column Bracing Beam Column Bracing Beam Column Bracing Building
0 10 60 0 25 80 0 10 60 0 15 40 5-Story 0 4 55 0 14 75 0 4 50 0 10 60 10-Story
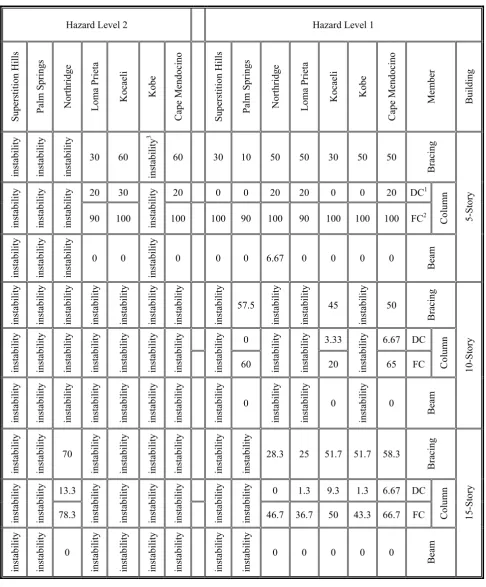
TABLE 9. Percentage of the Members which Don’t Satisfy the Acceptance Criteria (Nonlinear Dynamic).
Hazard Level 2 Hazard Level 1
Sup erstitio n Hi lls Pal m S pri ngs No rth rid ge Lo
ma Prieta Kocaeli Ko
be C ape Men do ci no Sup erstitio n Hi lls Pal m S pri ngs No rth rid ge Lo
ma Prieta Kocaeli Ko
be C ape Men do ci no Mem ber Bu ild ing in stab ility in stab ility in stab ility 30 60 in stab ility 3
60 30 10 50 50 30 50 50
Bracing
20 30 20 0 0 20 20 0 0 20 DC1
in stab ility in stab ility in stab ility 90 100 in stab ility
100 100 90 100 90 100 100 100 FC2
Co lu mn in stab ility in stab ility in stab ility 0 0 in stab ility
0 0 0 6.67 0 0 0 0
Beam 5-St or y in stab ility in stab ility in stab ility in stab ility in stab ility in stab ility in stab ility in stab ility 57.5 in stab ility in stab ility 45 in stab ility 50 Bracing
0 3.33 6.67 DC
in stab ility in stab ility in stab ility in stab ility in stab ility in stab ility in stab ility in stab ility
60 instab
ility
in
stab
ility
20 instab
ility
65 FC Colu
mn in stab ility in stab ility in stab ility in stab ility in stab ility in stab ility in stab ility in stab ility 0 in stab ility in stab ility 0 in stab ility 0 Beam 10 -St or y in stab ility in stab ility 70 in stab ility in stab ility in stab ility in stab ility in stab ility in stab ility
28.3 25 51.7 51.7 58.3
Bracing
13.3 0 1.3 9.3 1.3 6.67 DC
in stab ility in stab ility
78.3 instab
ility in stab ility in stab ility in stab ility in stab ility in stab ility
46.7 36.7 50 43.3 66.7 FC Colu
mn in stab ility in stab ility 0 in stab ility in stab ility in stab ility in stab ility in stab ility in stab ility
0 0 0 0 0
Beam
15
-St
or
y
1DC: Deformation-Controlled 2FC: Force-Controlled
of beams, bracing members (deformation-controlled) and columns have not satisfied the acceptance criteria. Lack of stability of different buildings against some earthquakes is visible in the hazard levels 1 and 2 especially for the 10-story model.
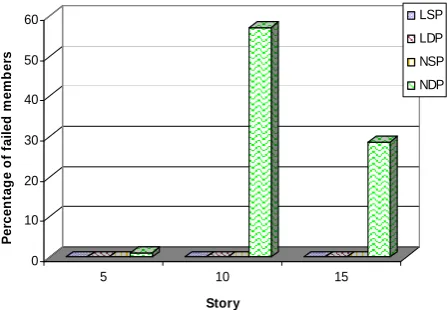
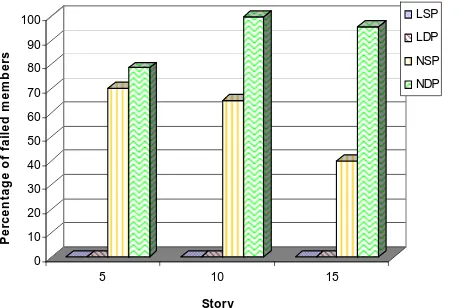
11. CLASSIFICATION OF RESULTS In order to get a good understanding of analyses, the results of four types of analyses are shown for comparison in a column form in Figure 4 to 9. In these columns:
LSP: stands for linear static procedure, LDP: stands for linear dynamic procedure, NSP: stands for nonlinear static procedure, NDP: stands for nonlinear dynamic procedure.
The vertical axis shows the percentage of failed members (members which have not satisfied acceptance criteria) and the nonlinear analysis results would be considered as benchmark for results accuracy.
12. CONCLUSION
The quantitative results have been shown in Sections 10 and 11. Before expressing the final conclusion, the limitations and assumptions made for the analayses are:
a. Very high seismicity zone, b. Regular and symmetric buildings, c. Primary design based on equivalent static analysis and d. The 7 mentioned accelerograms.
Hence, the summay of the results are:
1. The accuracy of linear analysis (static and dynamic) in evaluation of the bracing members is unreliable.
2. The results of linear static analysis are closer to reality than linear dynamic and nonlinear static analyses in evaluation of the columns. 3. In the dual-system steel frame buildings, the
main role of lateral load-bearing is on bracing members and beams have no such important role.
4. In particular, the results obtained from
0 10 20 30 40 50 60 70 80
P
e
rc
e
n
ta
ge
of
f
a
il
e
d
m
e
m
b
e
rs
5 10 15
Story
LSP LDP NSP NDP
Figure 4. Comparison of results accuracy derived from 4 types of analyses, bracing members (HL 1).
0 10 20 30 40 50 60 70
P
e
rc
e
n
ta
ge
of
f
a
il
e
d m
e
m
b
e
rs
5 10 15
Story
LSP LDP NSP NDP
Figure 5. Comparison of results accuracy derived from 4 types of analyses, columns (HL 1).
0 10 20 30 40 50 60
P
e
rc
e
n
ta
ge
of
f
a
il
e
d me
mbe
rs
5 10 15
Story
LSP LDP NSP NDP
nonlinear static analysis are more accurate and more reliable than linear static and linear dynamic analysis.
5. The results of nonlinear static analysis in the evaluation of 15-story building are less accurate than 5 and 10-story buildings. (This might be caused by lack of contribution of higher modes effects in load distribution pattern used in this method. Since in tall buildings higher modes have substantial effects, it is recommended that in nonlinear static analysis of tall buildings, MPA method (e.g., Chopra, et al [14]) be used).
6. Based on nonlinear dynamic analysis for the buildingsdesignedaccordingto 2800 Standard, the results have been stated below:
A.5. Story Building
Hazard Level 1: Around 29 % of members do not satisfy the acceptance criteria. Hazard Level 2: Around 66 % of members do not satisfy the acceptance criteria.B.10. Story Building
Hazard Level 1: Around 68 % of members do not satisfy the acceptance criteria.Hazard Level 2: The structure experienced instability.
C.15. Story Building
Hazard Level 1: Around 41 % of members do not satisfy the acceptance criteria.Hazard Level 2: Around 90 % of members do not satisfy the acceptance criteria.
13. ACKNOWLEDGEMENT
The authors would like to thank Mr. Hadi Hamidi for his great help in translating the text.
14. NOTATIONS A Area of bracing,
C Damping Matrix,
C0 Modification factor to relate spectral
displacement of an equivalent SDOF system to the roof displacement of the building MDOF system calculated, 0
10 20 30 40 50 60 70 80 90 100
P
e
rc
en
ta
g
e
o
f
fa
il
ed
m
e
m
b
er
s
5 10 15
Story
LSP LDP NSP NDP
Figure 7. Comparison of results accuracy derived from 4 types of analyses, bracing members (HL 2).
0 10 20 30 40 50 60 70 80 90 100
P
e
rc
e
n
ta
g
e
o
f f
a
ile
d
m
e
m
b
e
rs
5 10 15
Story
LSP LDP NSP NDP
Figure 8. Comparison of results accuracy derived from 4 types of analyses, columns (HL 2).
0 10 20 30 40 50 60 70 80 90 100
P
e
rc
e
n
ta
g
e
o
f f
a
ile
d
m
e
m
b
e
rs
5 10 15
Story
LSP LDP NSP NDP
C1 Modification factor to relate expected
maximum inelastic displacements to displacements calculated for linear elastic response,
C2 Modification factor to represent the effects
of pinched hysteretic shape, stiffness degradation and strength deterioration on the maximum displacement response, C3 Modification factor to represent increased
displacements due to P-Δ effects,
Cm Effective mass factor to account for
higher mode mass participation effects, E Modulus of elasticity,
Fas Allowable compression stress,
Fi Lateral load applied at floor level i,
Fy Yield strength of the material,
Fye Expected yield strength,
Fu Tensile strength of the material,
J Force-delivery reduction factor K Stiffness Matrix,
M Mass Matrix,
MCE Expected flexural strength of a member,
MPCE Expected plastic flexural strength,
MPCL Lower-bound plastic flexural strength,
MUD Bending moment (deformation-controlled),
MUF Bending moment (force-controlled),
Pe Euler critical force,
PCE Expected compression strength of the
column,
PCL Lower-bound compression strength of the
column,
PDL Axial force in member, due to dead load,
PE Axial force in member, due to earthquake,
PLL Axial force in member, due to live load,
PSC Column axial load capacity, compression,
PST Column axial load capacity, tension,
PUF Column axial force,
Q Generalized force in a component,
QCE Expected strength of the component or
element at the deformation level under consideration for deformation-controlled actions,
QCL Lower-bound strength of a component or
element at the deformation level under consideration for force-controlled actions, QUD Deformation-controlled design action due
to gravity loads and earthquake loads, QUF Force-controlled design action due to
gravity loads in combination with earthquake loads,
Sa Spectral response acceleration, g,
T Fundamental period of the building in the direction under consideration,
T0 Period at which the constant acceleration
region of the design response spectrum transitions to the constant velocity region,
Te Effective fundamental period of the
building in the direction under consideration,
V Pseudo lateral load,
W Effective seismic weight of a building including total dead load and applicable portions of other gravity loads,
Z Plastic section modulus,
hi Height from the base to floor level i.
hj Height from the base to floor level j.
g Acceleration of gravity, k Knowledge factor,
m Component or element demand modifier (factor) to account for expected ductility associated with this action at the selected Structural Performance Level,
r(t) External forces vector, )
t (
u Displacement vector, )
t (
u& Velocity vector,
) t (
u&& Acceleration vector,
wi Portion of the effective seismic weight W
located on or assigned to floor level i, wj Portion of the effective seismic weight W
located on or assigned to floor level j, Δ Generalized deformation, θ Generalized deformation, radians, δt Target displacement,
ν Poisson’s ratio,
15. REFERENCES
1. Bozorgnia, Y. and Bertero, V.V., “Earthquake Engineering: from Engineering Seismology to Performance Based Engineering”, CRC Press, Boca Raton, Florida, U.S.A., (2004).
2. Fragiacomo, M., Amadio, C. and Macorini, L., “Seismic Response of Steel Frames under Repeated Earthquake Ground Motions”, Engineering Structures, Vol. 26,
No. 13, (2004), 2021-2035.
3. Grecca, D., Dinu, F. and Dubina, D., “Performance Criteria for MR Steel Frames in Seismic Zones”,
Journal of Constructional Steel Research, Vol. 60, No.
4. SEAOC, Vision 2000, “Performance Based Seismic Engineering for Buildings”, Sacramento (CA): Structural Engineers Association of California, U.S.A., (1995). 5. Bertero, V.V., “Performance-Based Seismic Engineering:
Conventional Vs. Innovative Approaches”, Proc. 12 WCEE. New Zealand, (1995).
6. Bertero, V.V., “Performance-Based Seismic Engineering: A Critical Review of Proposed Guidelines in Seismic Design Methodologies for the Next Generation of Codes”, Bled, Slovenia, (1997), 1-31.
7. FEMA 273, “NEHRP Guidelines for the Seismic Rehabilitation of Buildings”, Federal Emergency Management Agency, (1997).
8. FEMA 356, “Prestandard and Commentary for the Seismic Rehabilitation of Buildings”, Federal Emergency Management Agency,( 2000).
9. Ghodrati Amiri, G., Hamidi Jamnani, H. and Mohebi, B., “The Effect of Analysis Methods on the Response of Steel-Braced Frame Buildings for Seismic Retrofitting”,
Journal of Applied Sciences, Vol. 8, No. 3, (2008),
432-442.
10. Standard No. 2800, “Iranian Code of Practice for Seismic Resistant Design of Buildings”, Third Revision, Building and Housing Research Center, Iran, (2005). 11. IIEES, International Institute of Earthquake Engineering
and Seismology, “Seismic Rehabilitation Code for Existing Buildings in Iran”, 2nd Revision, Tehran, Iran, (2007).
12. Kalkan, E. and Kunnath, S.K., “Assessment of Current Nonlinear Static Procedures for Seismic Evaluation of Buildings”, Engineering Structures, Vol. 29, No. 3,
(2007), 305-316.
13. Moghaddam, H. and Hajirasouliha, I., “An Investigation on The Accuracy of Pushover Analysis for Estimating the Seismic Deformation of Braced Steel Frames”,
Journal of Constructional Steel Research., Vol. 62,
No. 4, (2006), 343-351.
14. Chopra, A.K. and Goel, R.A., “Modal Pushover Analysis Procedure for Estimating Seismic Demands For Buildings”, Earthquake Engineering and Structural Dynamics, Vol. 31, No. 3, (2002), 561-582.
15. Antonio, S. and Pinho, R., “Development and Verification of a Displacement-Based Adaptive Pushover Procedure”,
Journal of Earthquake Engineering, Vol. 8, No. 5,
(2004), 643-61.
16. Elnashai, A.S., “Do We Really Need Inelastic Dynamic Analysis”, Journal of Earthquake Engineering, Vol. 6,
(2002), 123-130.
17. Clough, R.W. and Penzin, J.P., “Dynamics of Structures”, Mc Graw Hill, New York, U.S.A., (1993). 18. Bathe, K.J, “Finite Element Procedure”, Prentice-Hall,
Englewood Cliffs, NJ, U.S.A., (1996).
19. Computers and Structures, Inc., “ETABS, Extended 3D Analysis of Building Systems”, Berkeley, California, U.S.A., (2004).
20. Computers and Structures, Inc., “SAP 2000, Structural Analysis Program”, Berkeley, California, U.S.A., (2005).
21. Standard No. 519, Part 6, “Iranian National Building Code for Structural Loadings”, Ministry of Housing and Urban Development, Tehran, Iran, (2004).
22. INBCSS “Iranian National Building Code for Steel Structures”, Part 10, Ministry of Housing and Urban Development, Tehran, Iran, (2004).
23. Ghodrati Amiri, G., Mahdavian, A. and Manouchehri, Dana, F., “Attenuation Relationships for Iran”, Journal of Earthquake Engineering, Vol. 11, No. 4, (2007),
469-492.

![Figure 2. Design spectra based on PSHA and 2800 Standard (Ghodrati, et al [9]).](https://thumb-us.123doks.com/thumbv2/123dok_us/240168.2018705/5.595.131.466.261.443/figure-design-spectra-based-psha-and-standard-ghodrati.webp)