SUPPLEMENTATION PRACTICES OF GOATS IN THE POTHOWAR
REGION OF PAKISTAN
Abid Hussain*, Imdad Hussain Mirza and Muhammad Azeem Khan**
ABSTRACT: Goats have helped people to survive and thrive for countless gen-erations. Proper feeding and management is of fundamental importance to the success of any goats’ enterprise. In Pothowar region of Punjab, household and sedentary system of goat production is practiced. The availability of feed varies according to the season. Goats in the region are under nourished and producing less than potential. This study was conducted to find out the feed supplementa-tion practices of goats in the Pothowar region. Data for this study was collected for the complete calendar year 2008. Data sheets were prepared in Urdu and pro-vided to 100 literate female household members belonging to ten villages of tehsil Talagang of Chakwal district for data collection. According to the findings of the study, average number of goats per household was four; two does and two non-milking goats. Goats were mainly supplemented with ber (Zizyphus) leaves, wheat and mustard fodders in winter season and ber leaves, sorghum and bajra fodders in summer. Groundnut and wheat straws were main dry fodder. Wheat grains, oil seed cakes, wheat bran (choker), grams and left over dry breads were the concen-trates fed to goats. On the whole about 30% metabolizable energy requirements of non-milking goats and 34% of does were fulfilled by supplementation. Goats were supplemented maximum during January-March, June, November and December and grazed for greater periods in summer and autumn than in winter and spring seasons. It can therefore be concluded that in general the months when minimum supplements were given are the better ones in terms of feed availability because majority of feed intake comes from grazing. Moreover, supplementation of goats can be improved by educating local communities about the proper supplementa-tion and by planting palatable shrubs and fodder trees.
Key Words: Goats; Feeding; Population; Supplementation; Pakistan.
INTRODUCTION
Goats are well-admired and docu-mented worldwide for providing food in terms of milk and meat and their products. The goat (Capra hircus) is thought to have been the first animal domesticated for eco-nomic purposes in about 7000 BC in South West Asia, on the borders of present day Iran and Iraq, where agriculture was al-ready advanced (Peacock, 1996). Goats are playing a key role in supporting millions of people who are poor, landless and living in the rural areas. Goats are not only well-embedded in the culture but socially accept-able too for reducing global poverty particu-larly in developing nations. A goat is uni-versally called as “poor man’s cow”. Globally about 90 % goats are found in the develop-ing countries of Asia, Africa and South
America. Goat population in Asia is about 359 million (60.6%) and Asia alone produces about 80 % goat milk (Iqbal et al., 2008).
Goat sector is well-established in de-veloped countries like Greece, Spain, France, Italy, Australia etc. Goat milk con-sumption has become an upper edge for the humans afflicted with peptic ulcers, allergy and various gastrointestinal disorders which usually develop from intolerance to cow milk (Haenlein, 2004). Goat milk has been found to be useful for diabetic patients in Japan (Nagura, 2004). This fact favours goats for dairying and can prove an ideal preposition especially for developing world where majority of goat population is found with people having low economic status.
Pakistan is presently having about 56.7 million goats. Goats are playing a
cant role in the country’s economy by pro-ducing approximately 275 thousand tonnes mutton, 25 million skins and 21.4 thousand tonnes hair. They also produce about 851 thousand tonnes milk which amounts to 2.5 % of the national milk supply (Ali, 2006, Anonymous, 2008). Furthermore, they are also producing manure (dung, urine) which can be used to increase the soil fertility.
Most of the milk produced by the goats is either fed to kids by the does or used for some domestic needs. Similar situation is prevailing in our local goat farming sys-tems. In some cases, milk selling to the neighborhood is customary. Goat and sheep milk is usually mixed with cow /buffalo milk before marketing (Khan, 2008).
The goat being a ruminant is able to live and be productive on fibrous vegeta-tion of relatively poor quality. The goat is a natural browser, feeding by preference on tree leaves, flowers, and seed pods, when it can. Goats are able to eat quite woody stems of trees and bushes. They are very active when they eat, moving rapidly round a tree, picking off the best parts, and quickly moving on the next tree or bush. Goats can stand on their hind legs for long periods and prefer to eat at a height of 20-120 cm above the ground. Goats are considered superior to other ruminant species in utilization of forages for maintenance and production (Howe et al., 1988 and Dominique et al., 1991). In Pakistan, major feed resources available for goats are mainly ranges (60%), while other feeding material available to these animals is along canal/river banks, roadsides, pastures, crop residues, tree leaves, pods etc.
Good nutrition is a prerequisite for good health, good reproduction, high milk yield, fast growth rates and a successful goat production (Peacock, 1996). However, pro-vision of good nutrition is limited by food procurement problems (Chidibelu and Njondjou, 1997). In Pakistan, most of the goats are raised under grazing system; how-ever, during feed scarcity periods or dur-ing lactation, some farmers supplement their goats with some high quality rough-ages or branches of trees like ber. Under
rainfed conditions, fodder is not evenly available throughout the year. Thus fodders and crop residues are used as supplements to meet the animal nutritional require-ments. Sometimes concentrate supple-mentation is also practiced. In this study data on various aspects of feeding and pro-duction in Pothowar region was obtained to develop a feeding calendar of does and non-milking goats in the rainfed areas of Punjab and to find out nutritional status based on the supplementation made to them round the year.
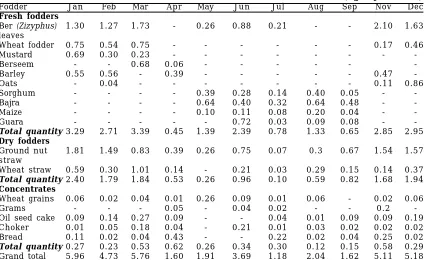
MATERIALS AND METHODS Data sheets were prepared in Urdu and provided to women household members in the Talagang Tehsil of Chakwal district for data collection. These data sheets were given to 100 women of 10 villages. The vil-lages included Tiba Hermal, Dhok Bali, Dewal, Dhok Mehar Ali, Dhok Khor, Mahmood Wala, Murali, Thati Bangla, Muthrhrala and Dhok Pathan. Women re-corded weekly averages of supplementation per day both for does and non-milking goats and filled data sheets were collected from them on fortnightly basis for data editing, entry and analysis. The results of the study are presented in calendar format to show the average daily quantities of fresh and dry fodders and concentrates fed to the goats (Table 2 and 3). Feeding calendars of does and non milking goats are presented in Figure 1 and 2. Finally, metabolizeable en-ergy available to does and non-milking goats is presented by line charts in Figure 3.
Feed and Metabolizeable Energy Require-ments of Grazing Goats
In the study area, average weight of female goats irrespective of breed is 20 kg with milk productivity of half to one kg per day. An adult goat of 20 kg weight requires about 3 kg feed per day including 0.8 to 1 kg dry matter and 2 - 2.2 kg green matter (Peacock, 1996). Metabolizable energy (ME) requirements of goats vary with age, body weight, physical status and seasons.
Chakwal. Mustard, barley and oats are among the other fodders fed to the goats. In summer season along with grazing,
Zizyphus leaves, sorghum and bajra are the
main fodders fed to goats; while, maize and guara fodders are also fed in small quanti-ties. Groundnut straw and wheat straw are fed to milking goats as supplemental dry fodders throughout the year. More dry fod-ders per day are fed during winter and spring than in summer (Table 2). As in arid areas, farmers face fodder shortage throughout the year therefore, some quan-tities of concentrates are fed by few farm-ers to does to fulfill their nutritional re-quirements. Wheat grain and left over dry breads, oilseed cakes, choker and grams etc. are the concentrates which are usu-ally fed to them as supplement (Table 2).
Quantities of Fresh and Dry Fodders Fed and Free Grazing Duration of Does
During winter season does are grazed for short duration as compared to other sea-Table 1. Metabolizable energy in
differ-ent fodders, forages and con-centrates
Fodders, forages Metabolize energy and concentrates MJ kg-1 Green fodders
Ber (Zizyphus) leaves 9.13
Wheat fodder 9.21
Mustard 8.58
Oats 8.00
Barley 8.41
Berseem 9.05
Dry fodders
Sorghum stalks 7.16
Bajra 7.16
Maize 7.67
Guara 8.29
Wheat straw 6.78
Ground nut straw 6.34
Concentrates
Wheat grains 11.81
Gram 10.59
Maize grains 12.14
Cotton seed cake 9.59
Wheat Bran (Choker) 10.76
Bread 11.51
mally a non-milking goat with body weight of 20 kg daily requires 80.39 Mega Joule (MJ) of metabolizeable energy for healthy living. While a doe with the same body weight and with half to one kg milk pro-duction per day requires 84.28 MJ of metabolizeable energy.
Metabolizeable Energy in Different Fodders, Forages and Concentrates
To assess availability of metabolize-able energy to she-goats from feeding, facts about energy available per kg of fodders, forages and concentrates are very impor-tant. The data about presence of metabolizeable energy in different fodders, forages and concentrates was used to esti-mate the availability of metabolizeable en-ergy per day from supplementation to does and non-milking goats (Table 1).
For calculation of availability of metabolizeable energy from supplementa-tion following equasupplementa-tion was used. The sum-mation of available energy from fresh and dry fodders and concentrates gives the to-tal available energy from supplementation. Metabolizeable Energy =
(AGFi x EGFi) (ADFi x EDFi) (ACONi x ECONi) Where,
AGFi = Average daily quantity of ith green fodder
EGFi = Available metabolizeable energy in ith green fodder
ADFi = Average daily quantity of ith dry fod-der
EDFi = Available metabolizeable energy in ith dry fodder
ACONi = Average daily quantity of ith centrate
ECONi=Available metabolizeable energy in ith concentrate
RESULTS AND DISCUSSION Stall Feeding of Does
Winter and Summer Fodders
sons (Figure 1). In winter season, does are grazed for minimum duration in Decem-ber (about 1 hour per day) and for a maxi-mum duration in February and November (about 4 hour per day). In summer, does are grazed for maximum duration of about 7 to 8 hours daily in April, July and September with a minimum in May and August (5-6 hours per day). It is observed that from No-vember through March better
supplemen-tation is done while from April to Septem-ber goats are grazed for greater duration with less supplementation.
Stall Feeding of Non-Milking Goats
Winter and Summer Fodders
In winter season, ber (Zizyphus) leaves and mustard are the main fodders fed to the non-milking goats. Barley, oats,
ber-ABID HUSSAIN ET AL.
Table 2. Quantity of fresh and dry fodders and concentrates supplemented to does (kgday-1 head-1)
Fodder Jan Feb Mar Apr May Jun Jul Aug Sep Nov Dec
Fresh fodders
Ber (Zizyphus) 1.30 1.27 1.73 - 0.26 0.88 0.21 - - 2.10 1.63 leaves
Wheat fodder 0.75 0.54 0.75 - - - 0.17 0.46
Mustard 0.69 0.30 0.23 - - -
-Berseem - - 0.68 0.06 - - -
-Barley 0.55 0.56 - 0.39 - - - 0.47
-Oats - 0.04 - - - 0.11 0.86
Sorghum - - - - 0.39 0.28 0.14 0.40 0.05 -
-Bajra - - - - 0.64 0.40 0.32 0.64 0.48 -
-Maize - - - - 0.10 0.11 0.08 0.20 0.04 -
-Guara - - - 0.72 0.03 0.09 0.08 -
-Total quantity 3.29 2.71 3.39 0.45 1.39 2.39 0.78 1.33 0.65 2.85 2.95
Dry fodders
Ground nut 1.81 1.49 0.83 0.39 0.26 0.75 0.07 0.3 0.67 1.54 1.57 straw
Wheat straw 0.59 0.30 1.01 0.14 - 0.21 0.03 0.29 0.15 0.14 0.37 Total quantity 2.40 1.79 1.84 0.53 0.26 0.96 0.10 0.59 0.82 1.68 1.94
Concentrates
Wheat grains 0.06 0.02 0.04 0.01 0.26 0.09 0.01 0.06 - 0.02 0.06
Grams - - - 0.05 - 0.04 0.02 - - 0.2
-Oil seed cake 0.09 0.14 0.27 0.09 - - 0.04 0.01 0.09 0.09 0.19 Choker 0.01 0.05 0.18 0.04 - 0.21 0.01 0.03 0.02 0.02 0.02 Bread 0.11 0.02 0.04 0.43 - - 0.22 0.02 0.04 0.25 0.02 Total quantity 0.27 0.23 0.53 0.62 0.26 0.34 0.30 0.12 0.15 0.58 0.29 Grand total 5.96 4.73 5.76 1.60 1.91 3.69 1.18 2.04 1.62 5.11 5.18
Figure 1. Quantities of fresh and dry fodders fed and grazing duration of does
Jan Feb Mar Apr May Jun Jul Aug Sep Nov Dec
(Month)
(h
)
Qt
y (k
g
d
ay
)
-1
4
3
2
1
seem and wheat leaves are among the oth-ers foddoth-ers fed to the non-milking goats. In summer season, ber (Zizyphus) leaves, bajra and sorghum are the major fodders fed to non-milking goats; while, guara and maize are also fed in small quantities. Table 3 shows that in non-milking goats May, July, August and September are the main graz-ing months, as less than 2 kg green fodder per day is fed as supplement to the goats
during these months. As in does, ground-nut and wheat straw is fed to non-milking goats as dry fodders, almost through out the year (Table 3). Wheat grains, dry breads, cotton seed cakes, choker and grams are the concentrates fed to the non-milking goats (Table 3). If we compare Table 3 with Table 2 (about concentrates feeding to does), it is noticeable that non-milking goats are generally fed less quantities of Table 3. Quantity of fresh and dry fodders and Concentrates Supplemented to
Non-milking goats (kg day-1head-1)
Quantity Jan Feb Mar Apr May Jun Jul Aug Sep Nov Dec
Green Fodders
Ber (Zizyphus) 2.52 1.31 0.36 0.70 0.13 1.16 0.51 - - 1.31 3.0 Leaves
Wheat fodder - - - 0.12
-Mustard 0.40 0.59 0.26 0.09 - - - 0.01 0.39
Berseem - 0.80 - - - 0.05
-Barley 0.25 - 0.63 0.33 - - - 0.62 0.25
Oats - - 0.10 - - - 0.09
-Sorghum - - - - 0.13 1.03 0.23 - -
-Bajra - - - - 0.38 0.30 0.43 0.35 - -
-Maize - - - 0.19 - - - -
-Guara - - - 0.49 0.03 0.07 0.26
-Total quantity 3.17 1.90 2.15 1.12 0.64 3.17 0.97 0.65 0.00 2.76 3.34
Dry Fodders
Ground nut 1.50 0.28 0.75 - 0.10 0.08 0.74 0.06 0.72 1.82 0.54 Straw
Wheat straw 0.50 0.83 0.07 0.04 0.06 0.04 0.03 0.50 0.15 0.01 Total quantity 2.00 0.28 1.58 0.07 0.14 0.14 0.78 0.09 1.22 1.97 0.55
Concentrates
Wheat grains 0.05 0.03 0.05 0.02 0.04 0.04 0.01 - 0.29 0.03 0.05
Grams - - - 0.11 - 0.04 - 0.01 - -
-Oil seed cake 0.09 0.19 0.2 0.01 0.12 0.2 0.02 0.02 - 0.05 0.08 Choker - 0.06 0.13 0.02 0.05 0.12 0.01 - 0.04 0.03 -Bread 0.08 0.04 0.55 0.02 0.07 0.37 0.12 0.2
Total quantity 0.14 0.36 0.42 0.71 0.23 0.47 0.41 0.03 0.45 0.31 0.13 Grand total 5.31 3.34 3.35 1.9 1.01 3.78 2.16 0.77 1.67 4.74 4.32
Figure 2. Quantities of fresh and dry fodders fed and grazing duration of non-milking goats
Green Fodder Dry Fodder Grazing
10 8 6 4 2 0 4
3 2
1
0
Jan Feb Mar Apr May Jun Jul Aug Sep Nov Dec
Qt
y
(
k
g d
a
y
)
-1
(h
)
ABID HUSSAIN ET AL.
concentrates than does.
Quantities of Fresh and Dry Fodders Fed and Free Grazing Duration of Non-Milking Goats During winter season non-milking goats are grazed for short time as compared to other seasons (Figure 2) and grazed for maximum duration in June and July (7-8 h). Because of longer grazing duration in summer, less supplements were offered, while reverse is true for winter months.
Metabolizeable Energy Available from Feed Supplements
The non-milking goat with a body weight of 20 kg requires on an average 80.39 MJ of metabolizeable energy while a doe with same body weight requires about 84.28 MJ of metabolizeable energy. Does are generally fed better than non-milking goats (Figure 3). It is clear that during win-ter and spring seasons, goats are supple-mented well than during summer. During winter and spring (from November to March) on an average, 43.6 and 35.0 MJ energy per day is available to does and non-milking goats from supplementation, spectively, while remaining energy re-quirement is probably fulfilled by grazing. However, availability of energy from graz-ing was not measured. While durgraz-ing sum-mer and autumn (from April to September)
on an average 15.5 and 15.8 metabolizeable energy is available to does and non-milk-ing goats from supplemental feednon-milk-ing re-spectively.
LITERATURE CITED
Ahmad, S. T. and Muller, Z. O. 1986. Tables of chemical composition of feedstuffs in Pakistan converted into various energy values. PAK /80/019 Islamabad, Paki-stan. 40p.
Ali, Q. 2006. Goats-undervalued assets in Asia. In: Proc. The APHCA-ILRI Regional Workshop on Goat Production Systems and Markets, Luang Prabang, Lao PDR, October 24-25, p. 47-49.
Anonymous, 2008. Livestock Census. Ag-ricultural Census Organization, Statis-tics Division, Government of Pakistan, Gulberg, Lahore
Chidibelu, S. D. and Njondjou, M. 1997. The economies of goat production in South-eastern Nigeria. Implication for the fu-ture. Nigerian J. Anim. Prod. 25: 93-99. Dominique, B. M. F. Dellow, D. W. and Barry T. N. 1991. Voluntary intake and rumen digestion of low quality roughage by goats and sheep. J. Agric. Sci. (Cambridge) 117: 111-120.
Haenlein, G. F. W .2004. Goat milk in hu-man nutrition. Small Rum. Res. 51: 155-163.
Figure 3. Metabolizable Energy Available from Su
E
n
er
gy
(M
J)
Howe, J. C. Barry, T. N. and Popay, A. J. 1988 Voluntary intake and digestion of gorse by goat and sheep. J. Agric. Sci. (Cambridge) 111: 107-114
Iqbal, A. Khan, B. B. Tariq, M. and Mirza, M. A. 2008. Goat-a potential dairy ani-mal: present and future prospects. Pa-kistan J. Agric. Sci. 45(2): 227-230. Khan, B. B. (ed.). 2008. Health and
hus-bandry of dairy animals. Pak T M
Print-ers, Faisalabad.
Nagura, Y. 2002. Utilization of goat milk and meat in Japan. Farming Japan. 36 (4): 9-13.