Design and simulation of bulk micro-machined
piezoresistive MEMS accelerometer
Meenakshi Arya
#1, Ashavani Kumar
*2, Ram Gopal
#3#MEMS and Micro Sensors Group, CSIR-Central Electronics Engineering Research Institute, Pilani-333031, Rajasthan, India *Department of Physics, National Institute of Technology Kurukshetra-136119, Haryana, India
Abstract This paper reports the design and simulation of z-axis accelerometer having 8-spring configuration, thereby eliminating the undesired modes of oscillations, and allowing only the required mode of oscillation i.e. along the z-axis. Such design architecture of accelerometer with piezoresistive sensing elements in Wheatstone bridge configuration enables the device to produce the output signal free from nonidealities. In this structure the proof mass is nested in square frame interconnected by eight springs, two springs at the each four corners of the proof mass and that of the frame. The proposed structure of accelerometer is then mathematically modelled and simulated by FEM using COMSOL software to verify the design based on analytical formulation.
Keywords — MEMS accelerometer, MEMS, bulk micromachining, von Mises stress, Wheatstone bridge
I. INTRODUCTION
Micro-electro-mechanical engineering has brought forth many micro devices based on structured silicon. Gyroscopes [1] and accelerometers [2] are such devices the structures of which were realized by directional etching process known as wet bulk micro-machining [3]. Alternatively, deep reactive ion etching (DRIE) [4] and surface micro-machining [5] techniques were also employed for the fabrication of these inertial sensors. Since the wet bulk machining technology does not requires additional costly equipment, the device manufactured by this technique economically viable. By using wet bulk machining technique, the numbers of accelerometers [5] were brought into reality. These are: single axis accelerometers [2,6], dual axis accelerometers [5] and tri axis accelerometers [7,8,9] with high sensitivities. Aforesaid accelerometers are either capacitive sensing [8,9] or piezoresistive sensing devices [10]. In capacitive sensing devices, the capacitance values are very small i.e. in order of fF. Therefore, the readout circuit to be interfaced is very sophisticated. Of course, capacitive sensing devices have advantages such as low noise and almost insignificant electro-magnetic field interaction effect, whereby distortion in the output signal is eliminated. The piezorestive sensing accelerometers, in other way, do not need such a sophisticated circuit as of capacitive sensing devices, but noise problem cannot be eliminated up to the negligible levels because of
heating effect of piezoresistance for long duration operation of the device. This can be minimized by proper piesoresistive material selection and then its deposition with the adequate precaution.
Considering the simplicity in structure of piezoresistive micro-accelerometer and ease in fabrication besides simple packaging technology, the objective of the present work is to design and model the proposed structure of the device. Aiming towards the efficient design concept, the modelling of the present design is carried out. The simple expressions of provided suspension springs are presented. Besides, the differential equation governing the dynamics of accelerometer is also reported keeping in mind the performance analysis of the same. Apart from these, the design concepts derived from analytical formulations are verified by using FEM based COMSOL Software.
II. ACCELEROMETER STRUCTURE AND WORKING PRINCIPLE
III. DYNAMICS OF ACCELEROMETER
With a view to studying the output signal of the accelerometer having multiple suspension system, the analysis of its dynamical behaviour is extremely important. The kinetics representing the eight spring suspension might give rise to different modes of oscillations. Possibly, it has three oscillation modes: the first is in the direction perpendicular to the surface of proof mass, second and third are shear oscillations showing tilt motion of proof mass. Governing these respective modes of oscillation, the lumped differential equations are written as [11],
𝑚𝑑 2𝑧
𝑑𝑡2+ 𝑏𝑧 𝑑𝑧
𝑑𝑡+ 𝑘𝑧𝑧 = −𝑚𝑎𝑧 , (1)
𝐼𝜃𝑥𝑑 2𝜃
𝑥 𝑑𝑡2 + 𝑏𝜃𝑥
𝑑𝜃𝑥
𝑑𝑡 + 𝑘𝜃𝑥𝜃𝑥 = −𝑚𝑎𝑦𝑧𝑐 , (2)
𝐼𝜃𝑦 𝑑2𝜃
𝑦 𝑑𝑡2 + 𝑏𝜃𝑦
𝑑𝜃𝑦
𝑑𝑡 + 𝑘𝜃𝑦 𝜃𝑦= −𝑚𝑎𝑥𝑧𝑐 , (3)
where 𝑎𝑥, 𝑎𝑦 and 𝑎𝑧 are the external accelerations along their respective axis exerted on the proof mass; 𝑚 is the proof mass value, 𝑏𝑧 is the squeeze film damping coefficient, 𝑏𝜃𝑥 is the shear damping coefficient in x-direction, and 𝑏𝜃𝑦 is the shear damping coefficient in y-direction. The spring constants representing different modes are denoted by 𝑘𝑧, 𝑘𝜃𝑥 and 𝑘𝜃𝑦. The notations 𝐼𝜃𝑥 and 𝐼𝜃𝑦 are the moments of inertia of proof mass about x- and y-axis respectively. 𝑧𝑐 is the distance of center of mass of proof mass. In order to analyze the device based on the Eqs. (1)-(3), the derivations of various parameters such as proof mass value, spring constants and damping coefficients included in these equations are necessary which are presented in subsequent subsections.
A. Suspension elements
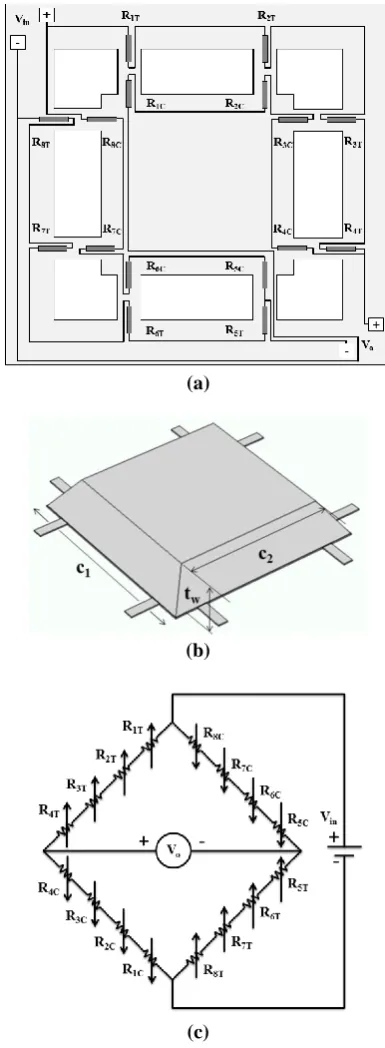
The present accelerometer structure has eight-spring suspension system of proof mass interconnected with frame as shown by Fig. 1(a, b). The both ends of the springs are guided type as one end is fixed at the frame and other end is connected to proof mass. The spring constant is defined as the force applied per unit deflection of the spring. Keeping in view the definition of spring constant, we follow the strain energy method to derive stiffness of suspension beam. The strain energy, 𝑈, stored due to bending of the beam is given as [12],
𝑈 =1 2𝐸𝐼 ∫ (
𝑑2𝑧 𝑑𝑥2)
2 𝑙𝐵
0
𝑑𝑥. (4)
Here, 𝐼 is the cross sectional area moment of inertia of the spring and 𝑧 is the vertical displacement of spring, 𝑙𝐵 is the length of the beam and 𝐸 is the Young’s modulus of the
material. When external force is applied, the bending of the springs occurs, which is governed by equation,
𝐸𝐼𝑑 2𝑧
𝑑𝑥2= 𝑀𝑜− 𝑥𝐹𝑧, (5)
the solution of which is expressed by,
𝑧 = 1 𝐸𝐼[
1 2𝑀𝑜𝑥
2−1
6𝐹𝑧𝑥
3+ 𝑁
1𝑥 + 𝑁2]. (6)
Now applying the boundary conditions at the end point (𝑥 = 0) where beam is connected to the frame i.e. 𝑧 = 0 and 𝑑𝑧 𝑑𝑥⁄ = 0, whereby
𝑧 = 1 𝐸𝐼[
1 2𝑀𝑜𝑥
2−1
6𝐹𝑧𝑥
3]. (7)
Similarly, we apply the boundary condition, 𝑑𝑧 𝑑𝑥⁄ = 0, at the point (𝑥 = 𝑙𝐵) where the spring is connected to the proof mass, thereby leading to relation between 𝑀𝑜 and 𝐹𝑧, written as,
𝑀𝑜=1
2𝑙𝐵𝐹𝑧. (8)
After substituting the value of 𝑀𝑜 from (8) to (7), the latter gets converted to
𝑧 = 𝐹𝑧𝑥 2
12𝐸𝐼[3𝑙𝐵− 2𝑥]. (9)
We now substitute Eq. (9) in (5) and then integrate the latter from 𝑥 = 0 to 𝑥 = 𝑙𝐵 to yield,
𝑈 = 𝑙𝐵 3
24𝐸𝐼𝐹𝑧
2. (10)
The Eq. (10) is differentiated with respect to force, 𝐹𝑧, to result in
𝜕𝑈 𝜕𝐹𝑧
= 𝑙𝐵 3𝐹
𝑧 12𝐸𝐼= 𝛿𝑧,
which is rearranged as
𝐹𝑧= 12𝐸𝐼
𝑙𝐵3
𝛿𝑧. (11)
By substituting, 𝐼 = 𝑤𝐵𝑡𝐵3⁄12, Eq. (11) gives the value of spring constant, 𝑘𝑧 as
𝑘𝑧=𝐸𝑤𝐵𝑡𝐵 3
𝑙𝐵3 .
𝑘𝑧=
8𝐸𝑤𝐵𝑡𝐵3 𝑙𝐵3
. (12)
Here, 𝑤𝐵 and 𝑡𝐵 are the width and thickness of the flexure beam respectively. Likewise, the tilt motion spring constants for eight beam suspension can be written as [6],
𝑘𝜃𝑥=1 6[𝑙𝐵
2+ 3𝑎1𝑙𝐵+ 3𝑎12+ 3𝑎22]𝑘𝑧, (13)
𝑘𝜃𝑦=1 6[𝑙𝐵
2+ 3𝑎1𝑙𝐵+ 3𝑎
12+ 3𝑎22]𝑘𝑧, (14)
where 𝑎1 and 𝑎2 denote the positions of springs with respect to the center of upper surface of proof mass [6,11].
B. Seismic mass calculation
The mass of truncated pyramid shape proof mass is calculated by simply integrating over the volume of the same. That is given by [11],
𝑚 = ∭ 𝜌 𝑑𝑥𝑑𝑦𝑑𝑧 =1 3𝜌𝑡𝑤
(𝑐13− 𝑐23)
(𝑐1− 𝑐2). (15)
Here, 𝜌 is the density of material, 𝑐1 is the dimension of upper portion of proof mass and 𝑐2 is that of lower face of proof mass whereas 𝑡𝑤 is the thickness of wafer (Fig. 1(b)).
C. Center of gravity of seismic mass
Since the center of gravity of proof mass is beneath the top surface of the same at 𝑧𝑐, that can be evaluated by [11]
𝑧𝑐 =∭ 𝜌 𝑧 𝑑𝑥𝑑𝑦𝑑𝑧 ∭ 𝜌 𝑑𝑥𝑑𝑦𝑑𝑧,
𝑧𝑐 =
𝑡𝑤(3𝑐12− 4√2𝑐1𝑡𝑤+ 3𝑡𝑤2) 2(3𝑐12− 3√2𝑐1𝑡𝑤+ 2𝑡𝑤2)
. (16)
D. Moments of inertia
The moments of inertial incorporated in Eqs. (2) and (3) are calculated by following expression. Both the moments of inertia 𝐼𝜃𝑥 and 𝐼𝜃𝑦 about the axes x and y are equal. These are expressed as [6]
𝐼𝜃𝑥= 𝐼𝜃𝑦 = 1
60𝜌𝑡𝑤(5𝑐1
4− 10√2𝑐
13𝑡𝑤+ 40𝑐12𝑡𝑤2 − 40√2𝑐1𝑡𝑤3 + 28𝑡𝑤4). (17)
E. Frequency modes
In the eight spring suspended proof mass, there may be number of oscillation modes. There are, however, three modes of vibrations that are dominants as are incorporated in Eqs.
(1)-(3). The resonance frequencies corresponding to these modes are written as,
𝑓𝑧= 1 2𝜋√
𝑘𝑧
𝑚, (18)
𝑓𝑥= 1 2𝜋√
𝑘𝜃𝑥 𝐼𝜃𝑥
, (19)
𝑓𝑦= 1 2𝜋√
𝑘𝜃𝑦
𝐼𝜃𝑦. (20)
F. Damping estimation
Within the encapsulated accelerometer device, if the air is present, the motion of proof mass is hindered as a result of viscous force experienced by mass. In the bottom surface of proof mass, when it moves downwards, the gap between the mass and lower encapsulation surfaces reduces, thereby causing squeeze film damping. At the same time upper encapsulated gap increases resulting in rarefaction of air. Consequently, the pressure gradient within the encapsulation space is generated. Such a rarefaction and compression mechanism of air, introduces the viscous force, whereby the device characteristics is influenced. Therefore, the estimation of squeeze film damping is very essential for accurate analysis and design of accelerometer. For this purpose, the damping is calculated by the following expressions [6] of damping force, moments and corresponding spring actions as a result of direct and tilt motions of seismic mass.
𝐹𝑜=
64𝑃𝑎𝑎𝑏𝜎 𝜋6
𝛿ℎ ℎ𝑜
∑
𝑚2+ (𝛽𝑛) 2
(𝑚𝑛)2{[𝑚2+ (𝑛 𝛽)
2 ]
2 +𝜎𝜋24} 𝑚,𝑛 𝑜𝑑𝑑
,
(21)
𝐹1=
64𝑃𝑎𝑎𝑏𝜎2 𝜋8
𝛿ℎ ℎ𝑜
∑ 1
(𝑚𝑛)2{[𝑚2+ (𝑛 𝛽)
2 ]
2 +𝜋𝜎24} 𝑚,𝑛 𝑜𝑑𝑑
,
(22)
𝑀𝑜,𝜃𝑥=
16𝑃𝑎𝑎𝑏3𝜎 𝜋6
𝜃𝑥 ℎ𝑜 ∑
𝑚2+ (𝑛 𝛽)
2
(𝑚𝑛)2{[𝑚2+ (𝑛 𝛽)
2 ]
2 +𝜎2
𝜋4} 𝑚 𝑜𝑑𝑑,
𝑛 𝑒𝑣𝑒𝑛
,
(23)
𝑀1,𝜃𝑥=16𝑃𝑎𝑎𝑏 3𝜎2
𝜋8 𝜃𝑥 ℎ𝑜 ∑
1
(𝑚𝑛)2{[𝑚2+ (𝑛 𝛽)
2 ]
2 +𝜎2
𝜋4} 𝑚 𝑒𝑣𝑒𝑛,
𝑛 𝑜𝑑𝑑
,
(24)
𝑀𝑜,𝜃𝑦=
16𝑃𝑎𝑎3𝑏𝜎 𝜋6
𝜃𝑦 ℎ𝑜
∑
𝑚2+ (𝑛 𝛽)
2
(𝑚𝑛)2{[𝑚2+ (𝑛 𝛽)
2 ]
2 +𝜎𝜋24} 𝑚 𝑜𝑑𝑑,
𝑛 𝑒𝑣𝑒𝑛
,
(25)
𝑀1,𝜃𝑦 =
16𝑃𝑎𝑎3𝑏𝜎2 𝜋8
𝜃𝑦 ℎ𝑜
∑ 1
(𝑚𝑛)2{[𝑚2+ (𝑛 𝛽)
2 ]
2 +𝜎𝜋24} 𝑚 𝑒𝑣𝑒𝑛,
𝑛 𝑜𝑑𝑑
.
(26)
Here the squeeze number, 𝜎, is defined by
𝜎 = 12𝜇𝑎 2ω
𝑃𝑎ℎ𝑜2
. (27)
Other notations included in Eqs. (21)-(27) are: 𝑃𝑎−pressure at which the device is sealed, 𝑎 −length of plate, 𝑏 −width of plate, ℎ𝑜−initial spacing between stator and moving plates, 𝛽 −aspect ratio, 𝑏/𝑎, ω − frequency of moving plate responding electrical signal and 𝜇 −viscosity of gas medium.
IV. PIEZORESISTIVE SENSING ELEMENT
There are several ways of sensing mechanisms of acceleration such as piezoelectric, capacitive, tunneling current besides piezoresistive one. Out of these, the application of piezoresistive sensing element is the easiest way for this purpose. Therefore, we describe latter sensing mechanism keeping in view the change in resistance at the event of external acceleration. If the piezoresister is placed at the springs and external acceleration is exerted on the seismic mass, the springs bend thereby causing the generation of stress on the springs. Because of stress generation on the springs, the piezoresister placed on changes that change in resistance is the function of external acceleration. This is being discussed in detail as follows. The piezoresister can be related with the stresses generated on the spring as [10, 11],
∆𝑅
𝑅 = 𝜋𝑙𝜎𝑙+ 𝜋𝑡𝜎𝑡+ 𝜋𝑠𝜎𝑠 , (28)
(a)
(b)
(c)
Fig. 1 (a) Wheatstone bridge placement of piezoresistors on the eight springs, (b) the truncated pyramid shape proof mass structure of accelerometer and (c) Wheatstone bridge configuration of piezoresistors placed on springs and biasing scheme
In the present design of accelerometer, eight beams are located in <110> direction and sixteen resisters are placed in the same diction. Therefore, piezo-coefficients, 𝜋𝑙, 𝜋𝑡 and 𝜋𝑠 in <110> directions can be written in terms of more fundamental piezo-coefficients, 𝜋11, 𝜋12 and 𝜋44, as,
𝜋𝑙< 110 > = 1
2[𝜋11+ 𝜋12+ 𝜋44], (28𝑎)
𝜋𝑡< 110 > = 1
2[𝜋11+ 𝜋12− 𝜋44], (28𝑏)
𝜋𝑠< 110 > = 0, (28𝑐)
Since the coefficients 𝜋11 and 𝜋12, are small enough in comparison with 𝜋44, the former coefficients may be ignored, whereby Eqs. (28a-b) are approximated as,
𝜋𝑙< 110 > =1
2𝜋44, (28𝑑)
𝜋𝑡< 110 > = − 1
2𝜋44. (28𝑒)
As a result, (28) takes the form as,
∆𝑅 𝑅 =
1
2𝜋44[𝜎𝑙− 𝜎𝑡]. (29)
Since, the deflections of the springs are assumed to be along the z-direction, the transverse stress, 𝜎𝑡= 0, Considering this, Eq. (29) is again simplified as,
∆𝑅 𝑅 =
1
2𝜋44𝜎𝑙. (30)
In Eq. (30), 𝜎𝑙 has to be derived as a function of external acceleration for calculating the change in the resistance. The stress distribution along the beam length can be determined by the formula [12],
𝜎𝑙= 𝜎𝑥= 𝑡𝐵𝐸 2(1 − 𝜈2)(
𝑑2𝑧
𝑑𝑥2). (31)
Now differentiating the Eq. (9) twice with respect to 𝑥 and then putting its value in Eq. (31) to have
𝜎𝑙= 3𝑚𝑎𝑧 8𝑡𝐵2𝑤𝑏
(𝑙𝐵− 2𝑥). (32)
Here we have assumed that the Poisson’s ratio, 𝜈, is very less than unity. The sensitivity in wheat stone bridge configuration of the resistances is defined as.
𝑆 =3𝜋44𝑚𝑙𝐵 8𝑡𝐵2𝑤𝑏
𝑉𝑖𝑛. (32𝑎)
which is static sensitivity.
V. VON MISSES STRESS
von-Mises stress is normally studied to estimate the failure/yield of structural parts. This criterion states that failure occurs when the energy of distortion of structure reaches the same energy for yield/failure in uniaxial tension. Mathematically, Mises stress is expressed by [10]
1
2√(𝜎𝑥𝑥− 𝜎𝑦𝑦) 2
+ (𝜎𝑥𝑥− 𝜎𝑧𝑧)2+ (𝜎𝑦𝑦− 𝜎𝑧𝑧)2 ≥ 𝜎𝑚.
Here 𝜎𝑚 is the fracture strength.
VI. EQUIVALENT CIRCUIT MODEL OF ACCELEROMETER
In order to facilitate the steady state analysis of the accelerometer by inducting the damping and spring action arising due to environmental effect, we represent the Eq, (1) in terms of equivalent circuit elements as [11],
𝐶𝑑 2𝜑
𝑑𝑡2+ 1 𝑅𝑧
𝑑𝜑 𝑑𝑡 +
1
𝐿𝜑 = 𝐼 = −𝑚𝑎𝑧, (33)
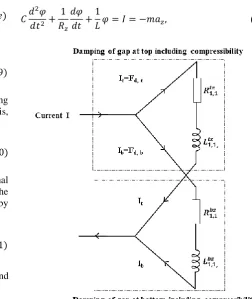
Fig. 2 Equivalent circuit model representing squeeze-film damping that includes the compressibility effect of the gas films at top and bottom of the proof mass
configuration with the help of damping expressions (21) and (22) by truncating the series up to the first order terms as illustrated by Fig.2. As per Fig. 2, the resistance component due to squeeze film damping and inductance as a result of spring action owing to squeezing of air column for the top surface of seismic mass are written as,
𝑅1,1𝑡𝑧 =𝜔ℎ𝑜𝜋
2(4𝜋4+ 𝜎2)
128𝑃𝑎𝑐12𝜎
, (34)
and
𝐿1,1𝑡𝑧 =
ℎ𝑜𝜋4(4𝜋4+ 𝜎2) 64𝑃𝑎𝑐12𝜎2
, (35)
respectively and for the bottom surface of seismic the parameters 𝑅1,1𝑏𝑧 and 𝐿1,1𝑏𝑧 can be obtained merely by replacing 𝑐1 by 𝑐2 in respective equations (34) and (35). We, now, take Laplace transform of (1) by considering elemental configuration shown in Fig. 2, the same equation is expressed by
𝑧(𝑠) = − 𝑚𝑎𝑧
[𝑚𝑠2+ ( 𝑠 𝑅1,1𝑡𝑧 + 𝑠𝐿𝑡𝑧1,1
+ 𝑠
𝑅1,1𝑏𝑧 + 𝑠𝐿1,1𝑏𝑧 ) + 𝑘𝑧]
,
(36)
where, 𝑅1,1𝑏 and 𝐿𝑏1,1 belong to bottom portion of proof mass of accelerometer. By replacing the Laplace parameter 𝑠 by 𝑗𝜔, the Eq. (36) is expressed in phase and amplitude forms as,
𝑧(𝑗𝜔) = −𝐴𝑇𝑧(𝜔) exp [𝑗𝜑𝑇𝑧(𝜔)], (37)
Here, amplitude 𝐴𝑇(𝜔) is defined as
𝐴𝑧𝑇(𝜔) = −
𝑎𝑧
√(𝐷𝑅𝑧)2+ (𝐷𝐼𝑧)2
, (38)
and the phase is expressed by
𝜑𝑇𝑧(𝜔) = − tan−1( 𝐷𝐼𝑧 𝐷𝑅𝑧
). (39)
The remaining notations are defined as follows,
𝐷𝑅𝑧= [(𝜔𝑧2− 𝜔2)
−𝜔 𝑚{𝐴𝑡
𝑧(𝜔) sin 𝜙 𝑡𝑧(𝜔)
+ 𝐴𝑏𝑧(𝜔) sin 𝜙𝑏𝑧(𝜔)}],
𝐷𝐼𝑧= [𝜔 𝑚{𝐴𝑡
𝑧(𝜔) cos 𝜙
𝑡𝑧(𝜔) + 𝐴𝑏𝑧(𝜔) cos 𝜙𝑏𝑧(𝜔)}],
𝐴𝑡𝑧(𝜔) =
1
√(𝑅1,1𝑡𝑧)2+ 𝜔2(𝐿1,1𝑡𝑧)2 ,
𝜙𝑡𝑧(𝜔) = − tan−1(𝜔𝐿1,1𝑡𝑧 𝑅1,1𝑡𝑧
),
𝐴𝑏𝑧(𝜔) =
1
√(𝑅1,1𝑏𝑧)2+ 𝜔2(𝐿𝑏𝑧1,1)2 ,
𝜙𝑏𝑧(𝜔) = − tan−1( 𝜔𝐿1,1𝑏𝑧
𝑅1,1𝑏𝑧 ),
Following the similar procedure, the frequency response considering Eq. (2) is expressed by the equation,
𝜃𝑥(𝑗𝜔) = −𝐴𝑇𝑥(𝜔) exp [𝑗𝜑 𝑇
𝑥(𝜔)]. (40)
Here, the amplitude and phase components are defined as,
𝐴𝑇𝑥(𝜔) = − 𝑚𝑎𝑦𝑧𝑐/𝐼𝜃𝑥 √(𝐷𝑅𝑥)2+ (𝐷𝐼𝑥)2
, (41)
and
𝜑𝑇𝑥(𝜔) = − tan−1(𝐷𝐼 𝑥
𝐷𝑅𝑥
) , (42)
respectively. The remaining notations are expressed by
𝐷𝑅𝑥= [(𝜔𝑥2− 𝜔2)
− 𝜔 𝐼𝜃𝑥
{𝐴𝑡𝑥(𝜔) sin 𝜙𝑡𝑥(𝜔)
+ 𝐴𝑏𝑥(𝜔) sin 𝜙𝑏𝑥(𝜔)}],
𝐷𝐼𝑥= [ 𝜔 𝐼𝜃𝑥{𝐴𝑡
𝑥(𝜔) cos 𝜙
𝑡𝑥(𝜔) + 𝐴𝑏𝑥(𝜔) cos 𝜙𝑏𝑥(𝜔)}],
𝐴𝑡𝑥(𝜔) =
1
√(𝑅1,1𝑡𝑥)2+ 𝜔2(𝐿𝑡𝑥1,1)2 ,
𝜙𝑡𝑥(𝜔) = − tan−1( 𝜔𝐿𝑡𝑥1,1
𝑅1,1𝑡𝑥 ),
𝐴𝑏𝑥(𝜔) =
1
𝜙𝑏𝑥(𝜔) = − tan−1( 𝜔𝐿𝑏𝑥1,1
𝑅1,1𝑏𝑥 ).
𝑅1,1𝑡𝑥 = 𝜋2ℎ
𝑜(25𝜋4+ 𝜎2)𝜔 20𝑃𝑎𝑐14𝜎
, (43)
𝐿1,1𝑡𝑥 = 𝜋4ℎ
𝑜(25𝜋4+ 𝜎2) 4𝑃𝑎𝑐14𝜎2
. (44)
Here, 𝑅1,1𝑏𝑥 and 𝐿1,1𝑏𝑥 parameters for back surface of proof mass can be obtained after replacing 𝑐1 by 𝑐2 in Eqs. (43) and (44) respectively.
It is now appropriate to derive the formula of sensitivity at the steady state. As per Fig. xx and equations (30) and (32) the sensitivity, 𝑆, of accelerometer in z-direction is written as,
𝑆 =𝑉𝑜 𝑎𝑧= 2
∆𝑅 𝑅𝑎𝑧𝑉𝑖𝑛 ,
which is rewritten more explicitly as
𝑆 = 3𝜋44( 𝐸𝑡𝐵
𝑙𝐵2 𝛿𝑧 𝑎𝑧
) 𝑉𝑖𝑛. (45)
Here, 𝛿𝑧 is deflection of proof mass in z-direction and can be replaced by the magnitude of 𝑧(𝑗𝜔). For static deflection, i.e. for 𝜔 = 0, Eq. (45) gets converted to (32a). With a view to validating the aforementioned model, we use COMSOL software to simulate the proposed structure of the accelerometer by FEM, the results of which are discussed in the subsequent section.
VII. FEM SIMULATION
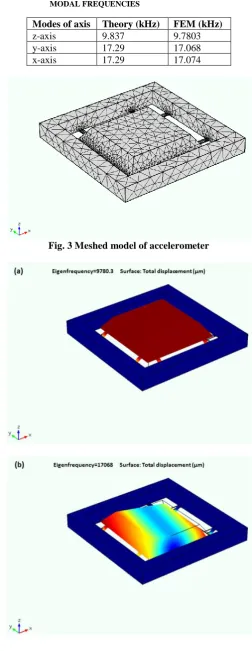
For FEM simulation, we used COMSOL software wherein the proposed structure was messed. The messing was performed sector wise (Fig. 3). The outer fixed frame of the device was messed by free tetrahedral elements with a normal size and the springs are meshed by free triangular with a fine element size. Similarly, the truncated pyramid shape of proof mass structure was also meshed with a tetrahedral element with normal size. The boundary conditions were applied to fix the frame part of the structure. Next to this the software was run for modal analysis. Three main resonance modes were depicted as shown by Fig. 4. Fig. 4(a) exhibits the vibration mode along the z-axis having frequency 9.78 kHz which is very close to the analytically calculated frequency 9.837 kHz. This is the frequency of primary mode. Others two oscillation modes (Fig. 4(b, c)) have larger frequencies i.e. 17.068 kHz which are very close to those calculated analytically for both the modes about the x- and y-axes as shown in Table-1.
TABLE-1 COMPARISON OF THEORY AND FEM SIMULATION MODAL FREQUENCIES
Modes of axis Theory (kHz) FEM (kHz)
z-axis 9.837 9.7803
y-axis 17.29 17.068
x-axis 17.29 17.074
Fig. 4
FEM
simulated modes of oscillations: (a) along z-axis frequency, 9.78 kHz (b) about y-z-axis frequency,17.068 kHzand (c) about x-axis frequency, 17.074 kHz
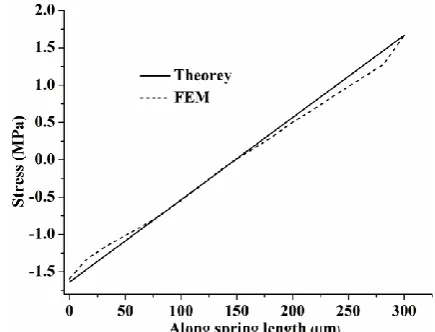
Besides, we also calculated the stress and von Misses stress distribution on the flexure spring. The same is given in Figs. 5(a) and 5(b) respectively Normal stress distribution obtained by FEM simulation is graphically illustrated in Fig. 6. The theoretical results of stress are also shown in this figure. From this figure it is evident that the analytical results match well simulated one. Similarly, the von Misses stress results calculated by analytical formulation and those obtained by software are shown in Fig. 7. The figure exhibits that both the results match well with each other.
The detail analysis of the proposed architecture of accelerometer reveals that the other modes of vibrations are for away from the principal mode of operation. The analytical modal frequencies are very close to those obtained by FEM simulation. This validates the present mathematical model. Based on these analyses, optimized design parameters of the device are listed in Table-II. Considering these parameters, the accelerometer characteristics are calculated.
(a)
(b)
Fig. 5 FEM simulated stress distribution along the surface of the springs due deflection of proof mass along the z-axis: (a) normal stress distribution and (b) von Misses stress distribution
Fig. 6 Stress distribution along the length of springs
TABLE-II DESIGN PARAMETERS OF ACCELEROMETER
Parameters Theoretical Values
Sensitivity 0.0128 mV/g/V
Numbers of axis Single axis (z-axis) Natural frequency, 𝑓 ~10 kHz
Thickness of mass, 𝑡𝑤 350 μm
𝑐1 2020 μm
𝑐2 1505.02 μm
Proof mass, 𝑚 2.58x10⁻⁶ kg Spring constant, 𝑘𝑧 9837.96 Young’s modulus, 𝐸 1.69x10¹¹ Pa
𝜈 0.0625
Silicon resistivity, 𝜌 2329 kg/m3 Flexural length, 𝑙𝐵 300 µm Flexural width, 𝑤𝐵 100 µm
Thickness, 𝑡𝐵 12.5 µm
Poly-Si sheet resistance, 𝜌𝑠 40 Ω/
Resistance, 𝑅 500 Ω
Resistor length, 𝑙𝑟 150 µm Resistor width, 𝑤𝑟 12 µm Resistor thickness, 𝑡𝑟 0.5 µm Input voltage, 𝑉𝑖𝑛 1 volt
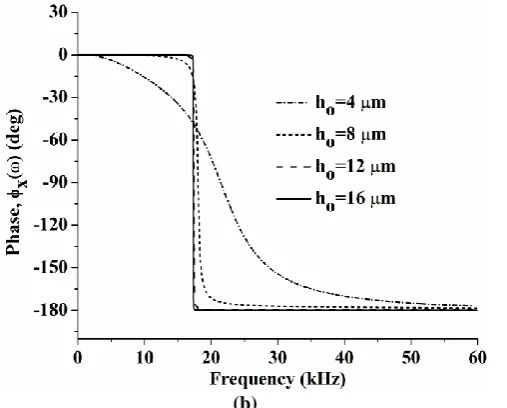
Fig. 8(a) exhibits the amplitude plot of the accelerometer considering the gap ℎ𝑜 between the proof mass and electrode as a parameter. This shows that as ℎ𝑜 increases the amplitude vs frequency plot approaches to ideal characteristic. This is due to the fact that the damping reduces with increase of ℎ𝑜, thereby increasing the amplitude at the resonance. The effect is more pronounces at the resonance. At the same time, the corresponding phase spectral response (Fig. 8(b)), reveals that the effect of ℎ𝑜 is more pronounced around the resonance. The Phase at the resonance is −𝜋/2 and about this the phase is seriously affected by, ℎ𝑜.
(a)
(b)
Fig. 8 Amplitude and phase frequency responses of accelerometer along the z-axis for different values of 𝒉𝒐: (a) amplitude and (b) phase
Since other two modes of oscillations have equal frequencies, we have calculated spectral response of only one mode i.e, around x-axis. The angular amplitude is graphically illustrated by Fig. 9(a). This figure is also calculated for different values of ℎ𝑜. From this figure it is evident that as ℎ𝑜 increase, the amplitude at resonance increases. This is because the damping reduces with increase of ℎ𝑜. The corresponding phase plot (Fig. 9(b)) also shows the expected results where the contribution of ℎ𝑜 is around the resonance.
Fig.10 has been calculated for sensitivity variation with frequency for different values of gap separation, ℎ𝑜
. This
figure
shows that the sensitivity is the maximum at the resonance frequency. The sensitivity increases as we increase, ℎ𝑜. This is due to the reason that with increase of
ℎ𝑜damping decreases thereby leading to increase in
sensitivity.
(b)
Fig. 9 Amplitude and phase variations with frequency considering 𝒉𝒐 as a parameter (about x-axis): (a)
amplitude and (b) phase
Fig. 10 Sensitivity variation with frequency (along z-axis) at different values of 𝒉𝒐
VIII. CONCLUSIONS
The proposed structure of accelerometer having multiple suspensions has been designed by performing analytical modeling. The compact formulations reported have been verified FEM analysis. The modal analyses of the accelerometer architecture shows that theory based frequencies are appreciably close to those obtained by FEM. The Von Misses stresses and normal stresses calculated from formulations and FEM based evaluation are in close agreement with each other. This verifies the present formulation. The offers the maximum sensitivity if it is
operated at resonance frequency. The device having narrow gap between the proof mass and the adjacent electrode causes the device to experience higher damping force, whereby the device becomes less sensitive.
ACKNOWLEDGMENT
One of the authors, (M. A.) is thankful to Dr. J. Akhtar, Chief Scientist, Group Head, Flexible and Non-Silicon Electronics, CSIR-CEERI Pilani, India for valuable discussion regarding the work.
REFERENCES
[1] Heikki Kuisma, Tapani Ryhanen, Juha Lahdenpera, Eero Punkka, Sami Ruotsalainen, Teuvo Sillanpaa, Heikki Sepp, A bulk micromachined silicon angular rate sensor, in Proceedings of IEEE International Conference on Solid-State Sensors and Actuators, 1997. TRANSDUCERS’97 Chicago, Vol. 2, pp. 875-878, June 16-19, 1997. [2] Eric Peeters, Stef Vergote, Bob Puers and Willy Sansen, A highly
symmetrical capacitive micro-accelerometer with single degree-of-freedom response, Journal of Micromachanics and Microengineering, Vol. 2, pp. 104-112, 1992.
[3] J W Berenschott, R E Oosterbroek, T S J Lammerink and M C Elwenspoek, Micromachining of {111} plates in <001> oriented silicon, Journal of Micromachanics and Microengineering, Vol. 8, pp. 104-106, 1998.
[4] Junseok Chae, Haluk Kulah and Khalil Najafi, A CMOS-compatible high aspect ratio silicon-on-glass in-plane micro-accelerometer, Journal of Micromachanics and Microengineering, Vol. 15, pp. 336-345, 2005. [5] Navid Yazdi, Farrokh Ayazi and Khalil Najafi, Micromachined inertial
sensors, in Proceedings of IEEE, Vol. 86, No. 8, pp. 1640-1659, August 1998.
[6] R P van Kampen, Bulk-micromachined capacitive servo-accelerometer, PhD thesis, Delft University Press/1995.
[7] Hongwei Qu, Deyou Fang, Huikai Xie, A single-crystal silicon 3-axis CMOS-MEMS accelerometer, in Proceedings of IEEE Conference on Sensors 2004, Vol. 2, pp. 661-664, Oct. 24-27, 2004.
[8] Junseok Chae, Haluk Kulah, and Khalil Najafi, A monolithic three-axis micro-g micromachined silicon capacitive accelerometer, IEEE Journal of Microelectromechanical Systems, Vol. 14, pp. 235-242, April 2, 2005.
[9] Serdar Tez, Ulas Aykutlu, Mustafa Mert Torunbalci, and Tayfun Akin, A bulk-micromachined three-axis capacitive MEMS accelerometer on a single die, IEEE Journal of Microelectromechanical Systems, Vol. 24, No. 5, pp. 1264-1274, Oct. 2015.
[10] R. Mukhiya, Ram Gopal, B. D. Pant, V. K. Khanna, T. K. Bhattacharyya, Design modeling and FEM-based simulation of a 1-DoF MEMS bulk micromachined piezoresistive accelerometer, Microsystem Technologies, DOI 10.1007/s00542-014-2361-y, (2014). [11] R.P. van Kampen, R.F. Wolffenbuttel, Modeling the mechanical behavior of bulk-micromachined silicon accelerometers, Sensoras and Actuators A, Vol. 64, pp. 137-150, 1998.