THE VIEW OF THE TECHNICAL AND COMPUTER SCIENCE SPECIALIZATION
IN THE SURVEY OF THEIR STUDENTS
Mirosław Malec1, Tomasz Cieplak2, Magdalena Huskowska3
1 Fundamentals of Technology Department, Lublin University of Technology, e-mail: [email protected]
2 Company Organization Department, Lublin University of Technology, e-mail: [email protected]
3 Technical and Computer Science Specialization graduate, Lublin University of Technology.
The study presents selected results of rep-resentative surveys conducted by Lublin Uni-versity of Technology students from Techni-cal and Computer Studies Education (TCSE) programme with a use of a questionnaire. The research group included graduating students in
order to define their attitudes to the university programme they are completing as well as
first-year students in order to recognise their expec-tations in this area. The questionnaires for both groups included 30 questions.
They covered such issues as:
• respondent’s interests and preferences; • former experience (job);
• factors that influence the decisions about the
chosen programme;
• expectations and evaluation of academic teachers and university classes;
• attitudes towards professional job;
• level of satisfaction from the chosen univer-sity programme;
• demographics: sex, age, place of residence, high school, A-level subjects, siblings.
The questionnaire was composed of closed, half-open and open questions. It included also
scaled questions and filtering questions with the
access rule. Following the design of the ques-tionnaire, pilot test was conducted in order to eliminate errors and inaccuracies in the ques-tions. The survey was conducted among students in subsequent years from 2008 to 2012. The questionnaire was completed by 368
respon-dents from the first year and 316 responrespon-dents
from the last year. The analysis was conducted with specialist software – SPSS.
Technical and Computer Studies Education enjoys good interest among students (Fig. 1).
However, 5 years ago, in 2007 significant de -crease of the number of candidates and accepted students were noted. The situation was probably caused by opening similar programmes at two other Lublin universities: University of Life Sci-ences and Catholic University of Lublin.
Considering lower number of accepted stu-dents the teaching programmes and programme schedule was planned to be changed, what allows the graduates to obtain the title of engineer. The realization of the teaching process was facilitated
and information activities were intensified in the
following manner: Research Journal
Volume 6, No. 16, Dec. 2012, pp. 24–30
DOI: 10.5604/20804075.1024717 Research Article
ABSTRACT
The article presents the results of the chosen research of Institute of Technology Stu-dents of Technical and Computer Science Specialization with use of questionnaire.
For the research were chosen students from the last and the first year of study so that we can define the attitude to specialization and university of students who are finish
-ing the study but also we can define expectations of people who had just begin their
studies. Collected data were analyzed with the use of SPSS programme.
Keywords: motives of study, sources of information about studies, compliance with the faculty student’s interests.
Fig. 1. The number of candidates and accepted students at Technical and Computer Studies
Education programme in 2001–2012
Year
• Internet (a movie about the Technical and Computer Studies Education, information ser-vice);
• meeting between vice-deans, university teach-ers, representatives of student association with high school students and teachers;
• distributing information leaflets, bulletins and
posters by students competing their appren-ticeship in schools and in their environments; • advertisements in press, radio and television; • publications and participation in scientific and
teaching conferences.
The effects of these activities were noticed two years later – in 2009 when 182 students were
accepted to the first year. It should be emphasised
that the trend was maintained also in the present
year with the number of first year students reach -ing 151 students. TCSE programme is the pro-gramme dominated by men, what is illustrated in Fig. 2. The highest number of women were ac-cepted in 2001, i.e. 45 women, what made c.a. 33% of the total number of accepted students, whereas the lowest number of female students was accepted in 2003 and constituted as few as 10% of the total number.
Fig. 2. Total number of students and female students accepted in Technical and Computer Studies
Educa-tion in 2001–2012
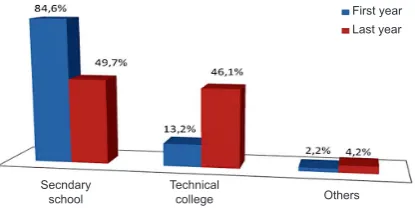
Technical and Computer Studies Education programme is chosen by students of different ages, with different experience and preferences. The largest number of people who take up this programme are between 19 and 20 years of age and, as the survey among former students shows, they are graduates of both high schools and (49.7%) and vocational schools (46.1%). The re-search conducted among the youngest students
from the first year show that the programme was
most popular among people with a high school
graduation certificate (84.6%) and only 13.2%
with vocational school diploma – Fig. 3.
Fig. 3. The percentage share from first and last years
of programme, with regards to the type of secondary
school they finished
The survey shows that the most popular mat-ura exam subject among future TCSE students is
mathematics (first year students – 95.43%, last year students – 84.83%) and English (first year
– 86.87, last year – 55.60%). Another subject
popular among first years’ students is geography – 18.2% (fig. 4).
Year
Total candidates Accepted students
Female students Accepted students
First year Last year
Others Technical
college Secndary
school
First year Last year Informatics
Community
Chemistry
Maths.
Russian
English
Fig. 4. Percentage share of subjects chosen for matura exam
Fig. 5. The distribution of first- and last-year students
with regards to their place of residence
78.7% of the students who started the pro-gramme declare that they were interested in the technique subjects even before. More than 68% of the group admit that they had already performed the activities presented in Fig. 6 such as:
solder-ing, fixing a power point, assembling furniture, helping to fix a car, fixing a computer. The largest
numbers of respondents have experience with
as-sembling furniture (88%) and fixing a computer
(84%).
Fig. 6. The share of students with experience of doing simple technical operations
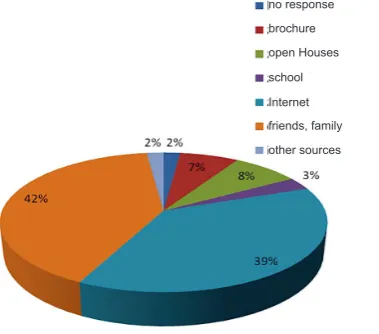
The interviewed students (42%) who have elder brothers or sisters obtained the information about the programme from their siblings. Those who do not have brothers or sisters use the In-ternet (39%) and University open days (8%) to obtain information about the studies (Fig. 7).
The interviewed had different motivations to start studying. First year students declared that they chose this programme because it is in line with their interests. Around 30% of the
in-terviewed from both first and last year students
chose the programme because they consider it easy to complete. They might have obtained this information from TCSE graduates. It is worth to
note that only 9% of the respondents from the first
year chose the programme because it prepares to work at school and a graduate obtains all the
ped-agogical qualifications. It should be emphasised that the share of students who are satisfied with this
opportunity increases with each year of studies.
Fig. 8. The distribution of factors that influence stu -dents decisions to enrol for Technical and Computer
Studies Education programme
First year students declare that they are inter-ested the topics related to computer studies (46%).
Significant numbers of students (37%) were also interested in technique as a field of knowledge
(Fig. 9). The same students considered their in-terests while making decisions about their studies programme and pointed to Technical and Com-puter Studies Education as the programme that meets their preferences.
Fig. 9. Scientific disciplines that first year students
are interested in
Fig. 7. The sources of information about Technical and Computer Studies Education
Country City
to 25 thous. 25–100 thous.City over100 thous.City
computer repair
furniture assembly help with car repairs
screw outlet soldering
no response brochure open Houses school Internet friends, family other sources
First year Last year no response
others
solicitation friends
qualifications
according to my interests easy to study
I got on here by chance
The survey showed that 97% of students did not have any problems with being accepted to Technical and Computer Studies Education. Only small number of candidates had problems with being accepted. They were the candidate who did not chose mathematics or physics as a matura exam subject. Over half of the inter-viewed students declare that within the last year of the programme they obtained a mark aver-age above 4.0. The rest of respondents declare to have obtained an average mark above 3.0 or that they do not know their marks. Students were also asked if they receive scholarship for their results. 475 of the students did receive they. The survey shows that most female students receive scholarships for good exam results. The
respon-dents from the first year were interviewed about
the exam results that would be satisfactory for them. As Fig. 10 shows, over 60% of women and
30% of men would be satisfied with the average
around 4.5. Unfortunately these are some
stu-dents, c.a. 13%, who will be satisfied with the marks that are sufficient to be promoted to the
next year of the programme.
Fig. 10. The distribution of average marks
satisfac-tory for first- and last-year students
Studying at Lublin University of Technology allows participating in various students’ organi-zations. Unfortunately extracurricular activities were not popular among the interviewed students. Only 13% of the respondents took part in sports sections’ meetings, a few people students danced in the folk dance group and a few more were ac-tive in students’ unions. These additional activi-ties are positively perceived by future employers. In their opinions, they teach scheduling works, give opportunities to be challenged in additional situations and are good preparation to
profession-al job. Last year students defined what they want to do after finishing the studies. The answers are
illustrated in Fig. 11. Only small number of re-spondents (15%) plan to work as teachers. Most of the interviewed, i.e. 33.2% prefer other
occu-pations in Poland. Many students have not made
final decisions concerning their future careers.
Fig. 11. The jobs preferred by last-year students after graduation
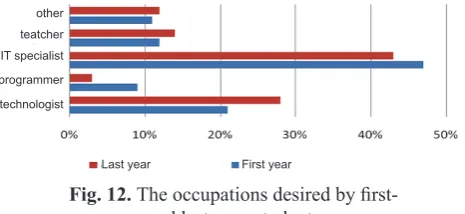
The interviews show that more than 43% of
the first and last-year students declare to be willing
to work as an IT specialist (Fig. 12). Few students declare that they choose this programme to obtain
pedagogical qualifications necessary to work as a
teacher. Many of them (92%) consider the
oppor-tunity to obtain the qualifications as an important
supplementary element that may be useful in the future. In their opinions these competences broad-en their chances in the job market and constitute an additional motivator to study this programme.
Fig. 12. The occupations desired by first-
and last-year students
An academic teacher is a sort of mentor that prepares an adult to professional career. The job he does, contacts with students and the methods of teaching are crucial for the evaluation of the programme by the graduates. Thus, the academic teachers should do their jobs in the beast way they can and meet the requirement of both university authorities and students.
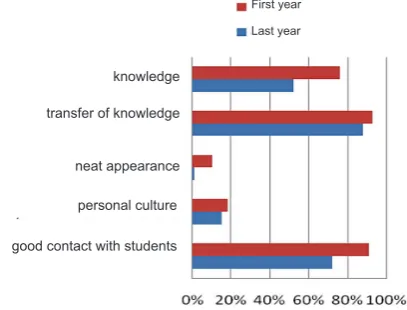
In the survey the interviewees were asked about the features of character of a good
academ-ic teacher. Students could tacadem-ick three most signifi -cant traits. The result were presented in Fig. 12.
They suggest that respondents from both the first
and the last year consider the ability to pass on the knowledge and good contact with students as the most important skills. The third most frequent answer considered teacher’s knowledge. In the two-option question about the teachers’ features of character the most frequently ticked answers were that the teacher must be understanding for students and have good sense of humour.
Woman Man whatever
average 3.5 average 4.5 pass for next year
I don’t know profession of teacher other work in the country
continue to educate
other work abroad
other teatcher IT specialist programmer technologist
Fig. 13. Features of good teacher’s character,
according to first- and last-year students
Apart from the person of the teacher, the teaching methodology is of great importance. The respondents were asked about important elements of a good lecture. Students could choose two an-swers. The results were presented in Fig. 14. The survey shows that in order to gain students’ inter-ests they should use real life examples, present the information in a form of multimedia presenta-tions and do shows and experiments.
Fig. 14. The features of an interesting lecture
In the survey, the expectations from
academ-ic teachers were verified by average marks they
were given by Technical and Computer Studies Education students. The respondents form the last year evaluated individual categories at the scale from 2 to 5 (Fig. 15). The highest rank, over 4 was given to the proposed category – easiness to obtain positive marks at tests and exams. Such an attitude to the fact does not necessarily bring
notable benefits to future graduates but enjoys
recognition from present students. The discussed programme can enjoy high marks in terms of good contact with students, appearance, and
help-fulness in writing diploma papers or the evalu-ation of teachers. It is worth to mention that all categories were marked higher than 3.8 and the average was 4.03.
Fig. 15. Average marks given to Technical and Com-puter Studies Education teachers by last year students
The respondents from the first year were asked
to evaluate the criteria concerning Technical and Computer Studies Education from the
perspec-tive of the first months of studying. The highest
marks were given to colleagues from the pro-gramme (c.a. 4.78 in 1-5 scale). Other categories obtained lower marks, e.g. 4.3 for the lecture time table. Similar average mark was given to academ-ic teachers’ work. The lowest result was recorded for the university infrastructure (3.85). Students from the last year were also asked to evaluate the technical equipment of the programme. 76% of the students said that the technical background of the university is good but not always most mod-ern. Only 8% of the students think that they are taught with very good and modern equipment. The interviewed made suggestions about the equipment that is needed in the department: • new computers;
• new and modern research devices; • numeric lathe;
• 3D printer;
• modern Internet cafe and faster wireless ac-cess to the Internet.
Fig. 16. Opinions about technical equipment avail-able at university in the opinions of last-year students
First year Last year
knowledge
transfer of knowledge
neat appearance
personal culture
good contact with students
First year Last year
substantive posts
interesting lecture
real-life examples
rest breaks
lecture in a foreign language
neat appearance contact with students substantive preparation the conduct of the lecture
ease credits way to assess assistance in writing
good and modern
good but not modern
In the framework of the programme students had to learn different subjects. Some of them were
more difficult for the students, what is presented in fig. 17 (respondents could give 3 answers). Among the most difficult subjects students
mentioned physics (78%), mathematics (48%), technical drawing (34%). The least problematic subjects included the ones that require manual skills (8%).
Fig. 17. The most difficult subjects, according
to students
The programme of Technical and Computer Studies Education prepares both engineers and future teachers. Therefore, students were asked to evaluate in what extent they will use the knowl-edge as teachers. The answers suggest that c.a. 23% of the respondents claim that only a few subjects will be useful for them in their work at schools. 42% of the interviewees claim that most of the subjects are useful in 50%. Such a result may be interpreted in two ways. First, if the pro-gramme is aimed at preparing new teachers, the number of subjects that are useful for teaching should be higher; however, if the programme is to provide comprehensive knowledge, the obtained results are more optimistic.
In the survey there was also a question for
first- and last-year students concerning the level
of advancement of the knowledge on certain
top-ics discussed in the framework of the programme. The analysis of Table 1 shows that the
expecta-tions towards the knowledge on specific subjects differ significantly form the marks given by TCSE
graduates. In the scale from 0 – meant zero level of knowledge, 1 – a basic level, 2 – intermediate level, 3 – advanced level, the largest number of points were given to the subject related to prepar-ing visual presentations. This subject has also the smallest differences between the expectations and
the final marks (the was 0.29 ).
Students were also asked if they would make the same choice, from the perspective, and choose
TCSE programme. The answers were diversified.
68% of the respondents would make the same de-cision but as many as 14% of the graduates would not make the same decision. Many students can-not decide whether the programme they are com-pleting is/is not satisfying for their expectations.
CONCLUSION
As the results of the research show, Techni-cal and Computer Studies Education at Lublin University of Technology meets students’ ex-pectations. One should also emphasise that the academic teachers who conduct their classes at TCSE are also highly appreciated among students (including their preparation and contacts with stu-dents). In the region there are many higher educa-tion schools, both private and public that offer a wide range of teaching programmes. It is certain that only those that meet students requirements to largest extent will be chosen. Therefore, each university and its programmes must face the chal-lenge of adapting to the situation to be positively perceived in both higher education market and labour market. Graduates and employers posi-tive opinions will certainly win the programme
Table 1. The comparison of expectations and performance concerning the subjects taught at Technical and Com-puter Studies Education
Subject I year students’ expectations (marks) Graduating students’ evaluation of specific subjects
Building WWW websites 2.14 1.72
Programming 2.16 1.22
Data base building 2.11 1.58
Building Internet networks 2.25 1.36
AutoCad 2.45 2.05
Creating multimedia presentations 2.84 2.55
Creating construction presentations 2.21 1.87
technical drawing electronic lessons manual physics didacticts others maths.
a horde of new candidates. The obtained results of the survey may be used to form a strategy that will adapt the offer of the programme to systemic requirements related to the implementation of the
national framework of reference for qualifications
and the requirements of the labour markets and potential students.
REFERENCES
1. Babbie E. Badania społeczne w praktce. Wydawnic
-two Naukowe PWN, Warszawa 2006.