Open Access
Software review
Permutation – based statistical tests for multiple hypotheses
Anyela Camargo
1, Francisco Azuaje
2, Haiying Wang*
3and Huiru Zheng
3Address: 1University of East Anglia, School of Computing, Norwich, NR4 7TJ, England, UK, 2Laboratory of Cardiovascular Research, CRP-Santé,
L-1150, Luxembourg and 3University of Ulster at Jordanstown, School of Computing and Mathematics, Shore Road, Newtownabbey, Co. Antrim,
BT37 0QB, Northern Ireland, UK
Email: Anyela Camargo - [email protected]; Francisco Azuaje - [email protected]; Haiying Wang* - [email protected]; Huiru Zheng - [email protected]
* Corresponding author
Abstract
Background: Genomics and proteomics analyses regularly involve the simultaneous test of hundreds of hypotheses, either on numerical or categorical data. To correct for the occurrence of false positives, validation tests based on multiple testing correction, such as Bonferroni and Benjamini and Hochberg, and re-sampling, such as permutation tests, are frequently used. Despite the known power of permutation-based tests, most available tools offer such tests for either t-test or ANOVA only. Less attention has been given to tests for categorical data, such as the Chi-square. This project takes a first step by developing an open-source software tool, Ptest, that addresses the need to offer public software tools incorporating these and other statistical tests with options for correcting for multiple hypotheses.
Results: This study developed a public-domain, user-friendly software whose purpose was twofold: first, to estimate test statistics for categorical and numerical data; and second, to validate the significance of the test statistics via Bonferroni, Benjamini and Hochberg, and a permutation test of numerical and categorical data. The tool allows the calculation of Chi-square test for categorical data, and ANOVA test, Bartlett's test and t-test for paired and unpaired data. Once a test statistic is calculated, Bonferroni, Benjamini and Hochberg, and a permutation tests are implemented, independently, to control for Type I errors. An evaluation of the software using different public data sets is reported, which illustrates the power of permutation tests for multiple hypotheses assessment and for controlling the rate of Type I errors.
Conclusion: The analytical options offered by the software can be applied to support a significant spectrum of hypothesis testing tasks in functional genomics, using both numerical and categorical data.
Background
Current statistical inference problems in areas such as genomics and proteomics regularly involve the simultane-ous test of hundreds of null hypotheses. This strategy has allowed scientists to unveil important cues on the mecha-nisms involved in the development of deadly diseases. For
example, Barth et al. (2006) [1] analysed gene expression patterns related to dilated cardiomyopathy (DCM) and identified specific gene regulatory relationships relevant to this disease condition. By means of Significant Analysis of Microarray (SAM) and Nearest Shrunken Centroid (NSC), 27 genes, whose expression profiles were sufficient
Published: 21 October 2008
Source Code for Biology and Medicine 2008, 3:15 doi:10.1186/1751-0473-3-15
Received: 30 July 2008 Accepted: 21 October 2008
This article is available from: http://www.scfbm.org/content/3/1/15
© 2008 Camargo et al; licensee BioMed Central Ltd.
[3]. Therefore, it is important to define an appropriate Type I error threshold, as well as selecting an effective multiple testing procedure to control this error rate and account for the joint distribution of the test statistics.
To correct for the occurrence of false positives, validation tests based on multiple testing corrections and re-sam-pling techniques (i.e. permutation-based test) are fre-quently used. Although both strategies aim to control Type I error, these techniques implement different approaches to estimating errors and rejecting null hypoth-eses. Traditional multiple-testing corrections, such as Bon-ferroni and variations, adjust P-values derived from multiple statistical tests to correct for the occurrence of false positives [4]. The Benjamini and Hochberg (B&H) ranks P-values in an ascending order, multiplies them by the number of features, and divides them by their corre-sponding rank [5]. The permutation test re-samples N times the total number of observations, in a population sample, to build an empirical estimate of the null distri-bution from which the test statistic has been drawn [6]. In the end, the application of these methods leads to either the rejection or acceptance of the null hypothesis. The Bonferroni correction is known to be extremely conserva-tive. It can lead to Type II (i.e. false negative) errors of unacceptable levels, which may contribute to publication bias and the exclusion of potentially relevant hypotheses (e.g. significant differential expression between patient groups or genotype-phenotype associations) [7]. In con-trast, B&H is less stringent, which may lead to the selec-tion of more false positives [5]. Unlike Bonferroni and B&H, permutation tests do not use individual association scores based on family-wise corrections [8]. Instead, per-mutation-based tests estimate statistical significance directly from the data being analysed. More importantly, irregularities of the observed data are maintained in the permuted data sets and are included in the estimation of the permutation probability [9].
To date, permutation tests have become widely accepted and recommended in studies that involved multiple sta-tistical testing [3,6,7]. Despite its power, current available tools, such TIGR MeV [10], offer permutation tests to esti-mate P-values for either t-test or ANOVA only. Another example is GeneSpring [11] that offers a permutation test
data dispersion differences across groups. Moreover, the Bartlett test should also be used before attempting the cal-culation of either ANOVA or t-test, as they assume that variances are equal across groups or samples.
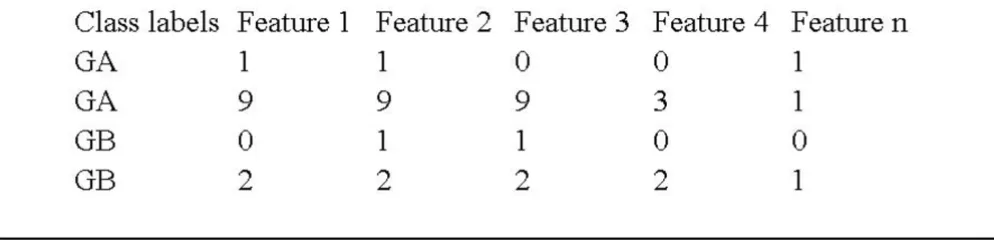
Given the evident need to offer software tools incorporat-ing such statistical tests with options for correctincorporat-ing for multiple tests, this study takes a first step by developing a public-domain, user-friendly software with the following functionality. The tool allows the calculation of Chi-square test for categorical data, ANOVA test, Bartlett's test and t-test for paired and unpaired data. Once a test statis-tic is calculated, Bonferroni, B&H and a permutation tests are implemented, independently, to control for Type I errors. P-values from the permutation test were estimated as follow, using the data encoding format shown in Figure 1:
First, test statistic and corresponding P-value are calcu-lated on the original data set. Data are permuted at ran-dom B times and test statistics are calculated on each permuted data set. Third, permuted distribution is calcu-lated by: counting the times (K) the statistic value obtained in the original data set was smaller than the sta-tistic value obtained from the permuted data sets, and dividing that value by the number of random permuta-tions i.e. K/B. Results are stored in a text file for subse-quent analyses. Table 1 offers guidelines for the selection of the most appropriate statistical test under this system.
Implementation
Statistical tests
The tool has at the user's disposal the following statistic tests: Student's test for numerical data, two classes; Bar-tlett's test for numerical data, two classes; ANOVA test for numerical data, more than three classes; and Chi-square for categorical data, two or more classes. For detailed information about each test, please refer to National Insti-tute of Standards and Technology/Semiconductor Manu-facturing Technology e-Handbook of Statistical Methods [12].
Multiple hypotheses testing procedures
Given (N) number of samples, (C) number of classes, (F) number of features, (S) significance level, (B) number of permutations, and (T(obs)) test statistic, validation meth-ods are as described bellow:
Multiple testing correction: P-values, according to test sta-tistic and degrees of freedom (N-2), were obtained and adjusted under Bonferroni and B&H multiple testing cor-rections B[5]. Permutation test: test statistic is estimated from original data set T(obs); sample's labels are shuffled B times and T(obs)s' are obtained; if T(obs) <T(obs)' a counter T(per) is increased by 1. The probability that T(obs) occurred by chance alone is: T(per)/B.
Software usage
Typical usage involves a user providing the following information: file name containing the data to be analysed,
the name of new file where results are to be stored, the selection of test statistic to be calculated, the significance level at which the null hypothesis is to be rejected, and the number permutated data sets to be created for the estima-tion of the null-hypothesis distribuestima-tion (Figure 2) [see Additional file 3]. Depending on the test statistic to be cal-culated, the user may need to provide additional informa-tion in a few steps. For example, if the t-test is selected, the user should indicate whether samples (i.e. groups being compared) are independent or not (paired). The user is also allowed to specify which type of distribution should be used: one- or two-tailed distribution. Once the required information is provided, the tool performs the analysis and displays those features whose raw P-values are below the significance level, their corrected P-value after Bonferroni correction, their corrected P-value after B&H correction, and their corrected P-values after per-forming the permutation test.
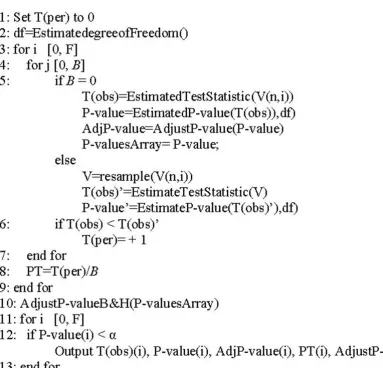
Figure 3 is a pseudo-code representation of the multiple testing correction procedure implemented.
Results
To illustrate some of the advantages of using the permuta-tion-based test for multiple hypotheses validation, this section summarises examples of analyses using publicly available data. This includes a comparison with results obtained when Bonferroni correction was applied (Table 2).
Format specifications of the input data
Figure 1
Format specifications of the input data. Format specifications of the input data. Rows represent samples and columns represent features.
Table 1: Statistical tests provided by the Ptest software.
Goal Measure Data type Test
To compare two unpaired groups Mean Numerical unpaired t-test
To compare two paired groups Mean Numerical paired t-test
To compare two or more unmatched groups Proportions Categorical Chi-square test
To compare two groups Variance Numerical Bartlett
To compare three or more unmatched group Mean Numerical ANOVA
obtained from the Single Nucleotide Polymorphism data-base (SNPdb) [14]. This data set was composed of 34 sam-ples, 10 from African-American people, 12 from European-American people and 11 from Han-Chinese people.
3) A microarray data set, oligo array, generated by a study in heart failure was obtained from the GEO, accession number GDS1362, was composed of 37 samples: 7, 20 and 10 samples were obtained from non-failing hearts, DCM heart, and Ischemic cardiomyopathy (ICM) patients respectively.
Data pre-processing
Microarray data: probe sets with absent calls in more than 50% of their transcripts were discarded. Transcripts of probe sets corresponding to similar gene symbols were averaged. Data were normalised per chip and then per gene. Values were transformed using the mean and stand-ard deviation of the row (per gene) or column (per chip). Genotype data did not require pre-processing.
Statistical analyses
The first analysis calculated Bartlett's test statistic to deter-mine whether the variances of two experimental groups, from a microarray data set [see Additional file 4], were equal. The null hypothesis of this analysis was that there was no significant difference between the variances of the two groups, and the significance level to reject the null hypothesis was set to 0.05. Data set was composed of 12 samples: 5 and 7 samples were obtained from non-failing hearts and DCM patients respectively. Out of 8068 genes, 526 genes were found to be statistically significant (P < 0.05, before correction for multiple-testing), one gene was under the significance level after correcting with Bonfer-roni, and one gene was under the significance level after correcting with B&H. However, after performing the per-mutation test, 327 genes were found significantly differ-entially expressed (P < 0.05). That is, the two group samples being compared exhibit equal variances, which is commonly expected in typical microarray data analyses.
The second analysis implemented the t-test (type: two sample equal variances; number of distribution tails: two-tailed): equal variances and two tailed) to estimate the
Permutation test tool usage flowchart
Figure 2
Algorithm for multiple testing correction based on permutation test
Figure 3
Algorithm for multiple testing correction based on permutation test. Algorithm for multiple testing correction based on permutation test. Significance level (α), number of permutations(B), counter (T(per)), number of features (F), test sta-tistic original data (T(obs)), test stasta-tistic permutated dataset (T(obs)').
Table 2: Results of analyses of statistical tests.
Test Data description Groups Features Samples Feature selection according to
raw P-value Multiple test correction
Bonferroni B&H PT
Bartlett Microarray Numerical 2 8068 12 526 1 1 327
t-test Microarray Numerical 2 8068 12 1413 2 39 1398
Chi-square Single nucleotide polymorphisms (SNP) Categorical 3 334 33 153 8 131 153
ANOVA Microarray Numerical 3 14976 37 6371 9 3331 6262
level after correcting with Bonferroni. In this case, results were consistent with our expectations: B&H identified more genes than Bonferroni did, which shows that the former tends to be less stringent. After performing the per-mutation test, 1398 genes were found significantly differ-entially expressed (P < 0.05). In addition, we noted that the raw P-values of some of the genes filtered out by Bon-ferroni were well below the significance level, i.e. they were potentially significant under a less conservative cor-rection approach. For example, raw P-values of ACVR1 and CFHR1 were 0.0004 and 0.004, respectively, and their P-values after Bonferroni correction were above 0.9. How-ever, based on the permutation-based test, these two genes fall below the significance threshold (corrected P values: 0.0001 and 0.001 for ACVR1 and CFHR1, respec-tively). This, as expected, shows the statistical power of permutation-based procedures for multiple testing.
The third analysis implemented the Chi-square test on categorical data derived from a genetic variation data set (SNPs) [see Additional file 6]. The problem was to deter-mine statistically significant genetic variations among the SNPs of three ethnic groups: African-American, European-American and Chinese. The data encode genotype values for each SNP under each group [15]. This data set was composed of 34 samples: 10 from African-Americans, 12 from European-Americans and 11 from Han-Chinese people. The null hypothesis of this analysis was that there were no genetic differential variations among the three groups, and the significance level to reject the null hypothesis was set to 0.05. In this case the raw P-values of 153 SNPs, out of 334, were under the significance level (P < 0.05). Bonferroni correction identified only eight SNPs, whose P-values were below significance level, and B&H correction identified 131 SNPs, whose P-values were below significance level. In contrast, the permutation test identified more features than B&H: 153 SNPs with signif-icant P-values. These results are consistent with the results reported by Carlson, et al. (2003) [16], which found that only 48% of the SNPs were shared by African-Americans and European-Americans. In our study, the permutation-based adjustment found that 55% of SNPs showed no sig-nificant differences among the three populations been analysed. These results again confirm the statistical power of permutation-based procedures for multiple testing.
of this ANOVA analysis was that there were no differences between the means of the three groups, and the signifi-cance level to reject the null hypothesis was set to 0.05. In this case, the raw P-values of 6371 genes were under the significance level (P < 0.05), 3331 genes were under the significance level after correcting with B&H, and only nine genes were under the significance level after correcting with Bonferroni. After performing the permutation test, 6262 genes were found significantly differentially expressed (P < 0.05). The genes reported as significantly differentially after correcting via Bonferroni were not included in the set of potentially significant genes detected by the permutation test. In addition, we com-pared our results against those previously reported by Kit-tleson, et al. (2005) [17] and found that most genes reported by them as significantly differentially expressed were also below significant level when our permutation test was performed, or when P-values were corrected via the B&H method. In contrast, only one of the genes reported by Kittleson's was also below significant level after we corrected with Bonferroni. Perhaps this analysis showed the real strength that the permutation test has to identify potential biomarkers of disease.
Conclusion
dif-ferences on the basis of SNPs. In this area multiple-testing procedures have traditionally relied on very stringent adjustment approaches (e.g. Bonferroni).
Despite its simplicity, in terms of usability, this tool in comparison with others, such as GeneSpring and TIGR MeV, offers the following advantages: Freely-available, as TIGR MeV does, no computational installation cost, easy to use, computationally inexpensive. Moreover it allows the calculation of traditional statistical tests and multiple testing with categorical data, as well as test- and distribu-tion-independent permutation-based tests.
We expect to continue expanding the tool with alternative statistical significance measures, such as Fisher's exact test, Z or Wald scores. We will welcome additional user's feed-back after the publication of this article.
Availability and requirements
Project name: Permutation-based statistical tests for mul-tiple hypotheses
Project home page: http://rosalind.infj.ulst.ac.uk/CWB/ Ptest.html
Operating system(s): Platform independent
Programming language: Java
Other requirements: Java 1.5.1 or higher
License: None
Any restrictions to use by non-academics: None
Abbreviations
ANOVA: Analysis of variance; DCM: Dilated CardioMy-opathy; SAM: Significant Analysis of Microarray; NSC: Nearest Shrunken Centroid; SNP: Single nucleotide poly-morphisms
Competing interests
The authors declare that they have no competing interests.
Authors' contributions
AC co-designed the software, wrote and implemented all source code, co-evaluated their outcomes and co-wrote the manuscript. FA conceived the original study, contrib-uted to the testing and evaluation phases, and co-wrote the manuscript. HW co-designed the software, evalu-ated their outcomes and wrote the manuscript. HZ co-designed the software, co-evaluated their outcomes and co-wrote the manuscript. All authors read and approved the final manuscript.
Additional material
Acknowledgements
We thank the two anonymous reviewers for their comments, which allowed us to improve the quality of the manuscript and software. This work was supported in part by a grant from EU-FP6, CARDIOWORK-BENCH project http://www.medinfo.dist.unige.it/CWB1/, to FA.
Additional file 1
Ptest software. Execute from command line like this\java Ptest. Click here for file
[http://www.biomedcentral.com/content/supplementary/1751-0473-3-15-S1.zip]
Additional file 2
EasyInput library. Used by Ptest. Click here for file[http://www.biomedcentral.com/content/supplementary/1751-0473-3-15-S2.zip]
Additional file 3
README. Microsoft word file, it should be open with Microsoft word because it contains mathematical equations.
Click here for file
[http://www.biomedcentral.com/content/supplementary/1751-0473-3-15-S3.rtf]
Additional file 4
Example data set for Bartlett's test. 2 classes, 12 samples, 5 and 17 respectively, 8068 features. Plain text file can be open with any word proc-essor.
Click here for file
[http://www.biomedcentral.com/content/supplementary/1751-0473-3-15-S4.txt]
Additional file 5
Example data set for t-Test – unpaired samples. 2 classes, 12 samples – 5 and 17 respectively – 8068 features. Plain text file can be open with any word processor.
Click here for file
[http://www.biomedcentral.com/content/supplementary/1751-0473-3-15-S5.txt]
Additional file 6
Example data set for Chi-square test – categorical data. 3 classes, 33 samples – 10, 12, 11 samples respectively – 334 features. Plain text file can be open with any word processor.
Click here for file
[http://www.biomedcentral.com/content/supplementary/1751-0473-3-15-S6.txt]
Additional file 7
Example data set for ANOVA test. 3 classes, 37 samples – 7, 20 and 10 respectively – 14976 features. Plain text file can be open with any word processor.
Click here for file
Publish with BioMed Central and every scientist can read your work free of charge "BioMed Central will be the most significant development for disseminating the results of biomedical researc h in our lifetime."
Sir Paul Nurse, Cancer Research UK
Your research papers will be:
available free of charge to the entire biomedical community
peer reviewed and published immediately upon acceptance
cited in PubMed and archived on PubMed Central
yours — you keep the copyright
Submit your manuscript here:
http://www.biomedcentral.com/info/publishing_adv.asp
BioMedcentral 5. Multiple Testing Corrections [http://www.chem.agilent.com/
cag/bsp/sig/downloads/pdf/mtc.pdf]
6. Belmonte M, Yurgelun-Todd D: Permutation testing made prac-tical for functional magnetic resonance image analysis. IEEE Trans Med Imaging 2001, 20(3):243-8.
7. Nakagawa S: A farewell to Bonferroni: the problems of low statistical power and publication bias. Behav Ecol 2004, 15:1044-1045.
8. Kimmel G, Jordan MI, Halperin E, Shamir R, Karp RM: A randomi-zation test for controlling population stratification in whole-genome association studies. Am J Hum Genet 2007, 81(5):895-905.
9. Cheverud JM: A simple correction for multiple comparisons in interval mapping genome scans. Heredity 2001, 87:52-58. 10. Saeed AI, Sharov V, White J, Li J, Liang W, Bhagabati N, Braisted J,
Klapa M, Currier T, Thiagarajan M, Sturn A, Snuffin M, Rezantsev A, Popov D, Ryltsov A, Kostukovich E, Borisovsky I, Liu Z, Vinsavich A, Trush V, Quackenbush J: TM4: a free, open-source system for microarray data management and analysis. Biotechniques 2003, 34(2):374-8.
11. GeneSpring GX Software [http://www.chem.agilent.com/Scripts/ PDS.asp?lPage=27881]
12. NIST/SEMATECH e-Handbook of Statistical Methods [http://www.itl.nist.gov/div898/handbook]
13. Gene Expression Omnibus (GEO) [http:// www.ncbi.nlm.nih.gov/geo]
14. Single Nucleotide Polymorphism database (SNPdb) [http:// www.ncbi.nlm.nih.gov/projects/SNP/index.html]
15. Hinds DA, Stuve LL, Nilsen GB, Halperin E, Eskin E, Ballinger DG, Frazer KA, Cox DR: Whole-genome patterns of common DNA variation in three human populations. Science 2005, 307(5712):1052-3.
16. Carlson CS, Eberle MA, Rieder MJ, Smith JD, Kruglyak L, Nickerson DA: Additional SNPs and linkage-disequilibrium analyses are necessary for whole-genome association studies in humans. Nat Genet 2003, 33(4):518-21.