Identification of Genetic Networks
Momiao Xiong,
1Jun Li and Xiangzhong Fang
Human Genetics Center, University of Texas, Houston Health Science Center, Houston, Texas 77030
Manuscript received February 12, 2003 Accepted for publication October 15, 2003
ABSTRACT
In this report, we propose the use of structural equations as a tool for identifying and modeling genetic networks and genetic algorithms for searching the most likely genetic networks that best fit the data. After genetic networks are identified, it is fundamental to identify those networks influencing cell phenotypes. To accomplish this task we extend the concept of differential expression of the genes, widely used in gene expression data analysis, to genetic networks. We propose a definition for the differential expression of a genetic network and use the generalized T2 statistic to measure the ability of genetic networks to
distinguish different phenotypes. However, describing the differential expression of genetic networks is not enough for understanding biological systems because differences in the expression of genetic networks do not directly reflect regulatory strength between gene activities. Therefore, in this report we also introduce the concept of differentially regulated genetic networks, which has the potential to assess changes of gene regulation in response to perturbation in the environment and may provide new insights into the mechanism of diseases and biological processes. We propose five novel statistics to measure the differences in regulation of genetic networks. To illustrate the concepts and methods for reconstruction of genetic networks and identification of association of genetic networks with function, we applied the proposed models and algorithms to three data sets.
R
ECENT advances in genome sequencing and high- explore their applications to biomedical research, sev-eral issues must be addressed. First, the development throughput technologies, such as DNA andpro-of dynamic models pro-of genetic networks is severely com-tein chips, allow us to measure the spatio-temporal
ex-promised by the lack of experimental techniques to pression levels of thousands of genes or proteins (Brown
measure the dynamic quantities of such networks. andBotstein 1999;Lipschutz et al. 1999;Lockhart
Therefore, revealing information from steady states of and Winzeler 2000; Young 2000; Figeysand Pinto
genetic networks using gene expression profiles is of 2001;HughesandShoemaker2001;Housemanet al.
great interest. 2002; Jong 2002). Mass spectrometry (Mann 1999;
Second, to identify physically connected genetic net-McLuckey andWells 2001) provides further
experi-works using gene expression profiles, which describe mental tools to acquire knowledge of the genetic
net-how genes directly activate or inhibit others, may be too works (Arnoldet al. 2004). In the past several years, a
ambitious to be accomplished at the current stage due number of statistical and computational methods for
to incomplete information on the structure of genetic reconstructing genetic networks have been developed,
networks. However, instead of reconstructing physically such as Boolean networks (Liang et al. 1998; Akutsu
connected genetic networks, it may be feasible to model
et al. 2000; Ideker et al. 2001), probabilistic Boolean
quasi-genetic networks, defined as a network that de-networks (Shmulevich et al. 2002), differential
equa-scribes most likely functional relations between the tions (Chenet al. 1999; D’Haeseleeret al. 1999; Von
genes in the network. The quasi-genetic network may Dassow et al. 2000), neural networks (Wahde and
not represent physical connection of the genes in the Hertz2000), fuzzy logic (WoolfandWang2000), and
network, but represents the best fit of the network Bayesian networks (Friedman et al. 2000; Hartemink
model to gene expression data.
et al. 2001;Imotoet al. 2002).
Third, many current computational methods for the Although a great advance in both experimental
tech-reconstruction of genetic networks have focused on the nology and computational methods for reconstructing
network structure. However, structure provides only par-genetic networks has been made, we still face significant
tial information on genetic networks. To measure quan-challenges in understanding such networks. To
accom-titatively the relationship between genes in the network plish the goal of identifying genetic networks and to
is indispensable for studying regulatory properties of genetic networks (Ronenet al. 2002).
To model quantitatively genetic networks, we propose 1Corresponding author:Human Genetics Center, University of Texas,
the use of structural equations (Bollen 1989) as a 1200 Herman Pressler, Houston, TX 77225.
E-mail: [email protected] framework for modeling genetic networks. Structural
equation models were first introduced into genetics where R is a diagonal matrix and G(Z) is a vector of nonlinear functions. The right-hand side of Equation (Wright1921), econometrics (Haavelmo1943), and
social science (Duncan 1975). Since then, structural 1 has two terms: the first one is the production of mole-cules, and the second is the degradation of existing equations as a tool for causal inference have been widely
explored in social science and engineering (Pearl molecules. The system of nonlinear differential equa-tions (1) can be approximated to the first order by a 2000). However, to our knowledge, structural equation
models have not been used for reconstruction of gene- linear system of equations near a steady state of the system
tic networks. Although structural equations can be used to model both equilibrium and disequilibrium states of
genetic networks, we focus on equilibrium states for the dY
dt ⫽AY⫺ RY,
reasons described above. We provide (1) a mathematic representation of genetic networks based on structural
where Y is a vector of the deviation of variables in Z
equations, (2) statistical methods for estimating and
from their means andAis a Jacobian matrix ofG(Z), testing model parameters, (3) probabilistic criteria for
i.e.,A⫽G(Z)/Z, measuring the strength of regulatory assessing how well models of the genetic networks
ex-interactions between genes in the network. When the plain the observed data, and (4) optimization
proce-system reaches a steady state, which is equivalent to dures for searching the most likely structure of the
ge-setting the time derivative ofYto zero, we have netic network.
Once a genetic network is identified, it is crucial to RY⫽AY. associate genetic networks with cell phenotypes.
Differ-The above equations show that the Jacobian matrix in-ential expression of genes is a widely used concept for
volves feedback loops of a dynamic biological system identifying genes that are able to discriminate cell
phe-and gene or protein expressions in cells or tissues are notypes. To associate genetic networks with cell
pheno-jointly or simultaneously determined. Gene expression types, we generalize the notion of differentially
ex-data that are generated by biological systems must be pressed genetic networks and develop a statistic to test
described as a system of joint relations among the gene for the differential expression of such networks.
expression variables. Coefficient parameters in the structural equations
The naı¨ve differential equation approach assumes measure the regulatory effects of one gene on others or
that the genetic network is fully connected, ignoring the strength of the gene-gene interactions. Functional
the structural relations between genes in the network mutations in the genes will often cause changes in
regu-(D’Haeseleer et al. 1999). This assumption results in latory effects. Thus, we expect that due to the
accumula-a laccumula-arge number of paccumula-araccumula-ameters in the differentiaccumula-al equaccumula-a- equa-tion of mutaequa-tions in abnormal cells, the regulaequa-tion of
tions. Due to a limited number of samples, it is difficult some genetic networks in abnormal cells will be
signifi-to develop any meaningful statistical methods for esti-cantly different from that in normal cells. Uncovering
mation of the parameters. However, most genetic net-such differences may help us to identify the causes of
works are not fully connected (Gardneret al. 2003). disease. To accomplish this task, we provide five statistics
The networks’ relations contain structural or causal in-to measure the differences in regulation between the
formation on the gene expression variables. The matrix genetic networks in normal and abnormal cells. We
Ais a sparse matrix and most elements of the matrixA
hope that by identifying differentially regulated genetic
are zero. Therefore, gene expression variables in ge-networks we are likely to discover a set of genes and
netic networks are modeled by structural equations, genetic networks that influence the development of the
which consider both simultaneous and structural rela-diseases.
tions among the gene expression variables. Structural equations can simultaneously include all endogenous
METHODS variables in one side of equations, which allows us to
consider bidirectional causality. Unlike ordinary
regres-Linear structural equation model: Linear structural
sion techniques that cannot deal with directed cyclic equations can be used for construction of a first-order
graphs, structural equation models allow bidirectional approximation model of a genetic network using
steady-causality/feedback loops (which are referred to as non-state gene expression measurements (Datta 2001).
recursive models; Maruyama 1998). This remarkable Rate equations expressing the rate of production of
feature makes structural equations a useful causal infer-components in the system are often used to model the
ence tool for reconstruction of genetic networks be-concentrations of mRNA, protein, and other molecules.
cause many genetic networks contain feedback loops. Rate equations in a simplified form are given byJong
We begin to describe structural equations for model-(2002),
ing genetic networks by introducing a path diagram (Bollen1989;Shipley 2000). A path diagram (or
di-dZ
structural equations and is used to describe graphically hence genetic networks with feedback loops (Bollen 1989).
genetic networks as shown in Figure 1. The path
dia-In Figure 1 we assume that the expression levels of gram consists of nodes, represented by letters, and
the genesCDC28,CLB1, and CLB3, denoted by x1, x2, edges, represented by lines. The nodes of the path
dia-and x3, respectively, are exogenous variables and the gram correspond to variables. The directed edges
be-expression levels of the genes MCM1, MCM2, SWI4, tween nodes denote the direction of the regulatory
rela-CLN3,CDC47, andCDC6, denoted byy1,y2,y3,y4,y5, and tionship between the nodes (variables) connected by
y6, respectively, are endogenous variables. The struc-the edges and indicate a directed regulatory influence of
tural equations for the genetic network are written as one gene on another. The directed edges can represent
either activation (positive control) or inhibition
(nega-y1⫽1.19x1⫹e1 tive control).
y2⫽0.16x1⫹0.28x2⫺0.34x3⫹ e2 Variables in path diagrams can be classified into two
basic types of variables, observed variables that can be
y3⫽0.06y1⫹0.19y2⫹e3 measured and residual error variables that cannot be
y4⫽4y3⫹ e4 measured and represent all other unmodeled causes of
the variables. Most observed variables (e.g., gene
expres-y5⫽0.19y4⫹e5 sion levels) are random. Some observed variables may
y6⫽0.2y5⫹e6. be nonrandom or control variables (e.g., drug doses)
whose values remain the same in repeated random
sam-We assume that the influence of the genes in the pling or might be manipulated by the experimenter.
network is in one direction and that the errors in the The observed variables will be further classified into
equations are independent and uncorrelated with exog-exogenous variables, which lie outside the model, and
enous variables. Under these assumptions, if the genetic endogenous variables, whose values are determined
networks do not contain feedback loops, theBmatrix through joint interaction with other variables within the
can be made lower triangular by arranging the order system. All nonrandom variables and some of the gene
of endogenous variables and the variance-covariance (or protein) expression data (e.g., initiators of pathway)
matrix of the errors is diagonal. Therefore, the struc-can be viewed as exogenous variables. Most of the gene
tural equations for the genetic networks without feed-(or protein) expression data are viewed as endogenous back loops are recursive models, which ensure that variables. The terms exogenous and endogenous are parameters in the recursive model are identifiable (
Bol-model specific. It may be that an exogenous variable in
len1989).
one model is endogenous in another. The observed Parameter estimation:To estimate the parameters of variables are enclosed in boxes and the error variables the structural equations, we assume that the structure are not enclosed at all. of the network is known. How to identify network struc-Let Ybe a vector of thependogenous variables and ture is discussed in theModel selectionsection. It is well
Xbe a vector of q exogenous variables. Occasionally, documented that the ordinary least-squares estimator one or more of the X’s are nonrandom. We denote is biased and inconsistent for parameters in structural the errors bye. We assume thatE[e]⫽ 0 and thateis equations (Bollen1989). To ensure that estimators are uncorrelated with the exogenous variables inX. We also consistent and unbiased, we use the estimation proce-assume thateiis homoscedastic and nonautocorrelated dures based on covariance analysis, which assumes that
(Bollen1989). Then, the structural equations for
mod-兺
⫽兺
(), eling gene expressions in the genetic network are givenby
where兺is the population covariance matrix of the vari-ablesYandX, and兺() is the covariance matrix written
Y⫽ BY⫹ ⌫X⫹e, (2)
as a function of the free model parameters in the mod-whereBis ap⫻pmatrix and⌫is ap⫻qmatrix. The els, which we denote by . Let ⌽ and denote the covariance matrices ofXande, respectively. The matrix elements of the coefficient matricesBand ⌫describe
兺() consists of three parts: (1) the covariance matrix the regulatory effects of one gene on another or of
ofY, (2) the covariance matrix ofXwithY, and (3) the a nonrandom variable on the gene, which is a direct
covariance matrix of X. First we consider 兺YY(), the
regulatory influence of one variable on the other.
implied covariance matrix ofY. From the Equation 2, Therefore, throughout the article, the matricesBand
we haveY⫽(I⫺B)⫺1(⌫X⫹e). Hence,兺YY()⫽(I⫺
⌫ are referred to as the regulatory matrices. Since the
B)⫺1(⌫⌽⌫⬘ ⫹ ⌿)(I ⫺ B)⫺1⬘. The implied covariance
genetic networks are not fully connected, many
ele-matrix ofYandXis given by ments in the matricesBand⌫will be zero. The matrices
Band⌫ are, in general, sparse. The matrixB can
de-兺
YX⫽E{(I⫺B)⫺1(⌫X⫹e)X}⫽ (I⫺B)⫺1⌫⌽.scribe feedback relations in the path diagram. The
tween the covariance matrix predicted by the model
兺()⫽
(I⫺B)⫺ 1(⌫⌽⌫⬘ ⫹ ⌿)(I⫺B)⫺1⬘ (I⫺B)⫺1⌫⌽
⌽⌫⬘(I⫺B)⫺1⬘ ⌽
and the sample covariance matrix from the observed data. Those differences measure how similar the hypoth-(Bollen1989). The above equation implies that each esized genetic network model is. The model fit measure element of the covariance matrix is a function of model allows us to rank genetic networks according to their parameters. The unknown parameters in B,⌫,, and ability to fit the observed data. A widely used model⌽are estimated so that the implied covariance matrix
fit measure is the Akaike information criterion (AIC;
兺() is as close to the sample covariance matrixS, the
Bollen1989;Maruyama1998), which is defined as estimator of the matrix兺, as possible. To know when
our estimates are as “close” as possible, we must define (N⫺1)FML ⫺2d, close, that is, we require a fitting function that is
mini-where N is the number of samples, FML is the fitting mized. The most widely used fitting function is based
function, d ⫽ 1⁄2(p ⫹ q)(p ⫹ q⫹ 1) ⫺ tis degrees of on the method of maximum likelihood (ML) defined
freedom, andtis the number of free parameters in the by maximizing the likelihood function or its log,
model. The AIC value provides a relative ordering of
FML⫽ log|
兺
()| ⫹Tr(S兺
⫺1())⫺ log|S|⫺ (p⫹q), different models fitting the data. The smaller the AIC value, the better the model fits the data.where p and q are the number of endogenous and
However, AIC information cannot be employed to exogenous variables, and Tr denotes the trace of a
ma-test whether the identified genetic network is valid. For-trix. The fitting function FML compares the difference
tunately, the statistic (N⫺1)FMLis asymptotically distrib-between the observed and predicted covariance
matri-uted as a2
(d)distribution under the null hypothesis H0: ces. In general,FMLis a complicated nonlinear function
兺⫽ 兺(). It should be noted that the null hypothesis of the structural parameters, and explicit solutions are
means that the constraints on兺imposed by the genetic not always found. Instead, a Newton unconstrained
opti-network model are valid. In contrast to ordinary tests mization procedure is employed to find solutions (
Bert-where the probability of obtaining a2value larger than sekas1995).
a prespecified value is the probability of committing It is well known that the ML estimators are consistent
error for the rejection of the null hypothesis, in the and asymptotically unbiased. Large sample theory
en-model selection test here, the probability of obtaining sures that (N⫺1)FMLis asymptotically distributed as2
a2value larger than a prespecified value is the proba-distribution with1⁄
2(p⫹ q)(p ⫹q⫹1)⫺ td.f., where
bility of ensuring that the fitted model is correct and
tis the number of free parameters, and the distribution
is referred to as the fitting probability. Therefore, the of the estimator is asymptotically normal. Hence, the
higher the probability of the2, the closer is the fitted ratio of the estimated parameter to its standard error
model for the genetic network to the true genetic net-approximates aZ-distribution for large samples and can
work. be used to test the parameters. The standard errors can
Genetic algorithms:Searching the genetic network is be obtained from the following asymptotical covariance
a very difficult problem because of the large number matrix for the ML estimators,
of possible networks. To exhaustively search all possible networks is infeasible, in practice, even with
high-perfor-冢
2N⫺ 1
冣 冦
E冤
2FML
⬘
冥冧
⫺1 ,
mance computers. Genetic algorithms (GAs) can be used for searching networks (Larranagaet al. 1996). whereN is the number of samples.
Network search consists of two parts. First, we need to
Model selection: Learning about genetic networks
search a set of genes that are included in the network. consists of two parts: parameter learning and structure
Then, for the fixed set of genes we search the structures learning. For parameter learning, in the previous
sec-of the network that specify how the genes in the network tion we assume that the network structure is known.
are connected. We developed a new type of GA that However, in most cases, the network structure is
un-accomplishes these two tasks simultaneously. known and needs to be identified. To learn network
We use ak⫻kconnective matrixCto represent the structure from genome-wide gene expression profiles
structure of a network withkgenes. The elements ofC
consists of two steps. The first step is to select the set
are given by of genes whose reconstructed network best fits the gene
expression data. The second step is to learn the
struc-cij⫽
冦
1 if nodejis directed to nodei
0 otherwise. ture of the networks for a set of selected genes, which
provides the best fit to the gene expression data.
GAs begin with a population that consists of a large To identify the structure of the network, an overall
number of individuals. In our genetic algorithm, indi-model fit measure is needed to assess how well a genetic
viduals of the population represent selected genes and network fits the data and to compare the merits of
network structures. This type of individual is denoted alternative network structure (Jordan1999). The
g1g2. . .gkc11c21. . .ck1. . . c1kc2k. . . ckk, tions is significant and the genetic network is
differen-tially expressed.
which is usually referred to as a chromosome in the GA Index for measuring difference in regulation of ge-literature (as opposed to a real chromosome). The first netic networks:LetA⫽[B⌫] be a coefficient matrix of part of the chromosome g1g2 . . . gk is a set of integer structural equations for modeling a genetic network.
numbers representing genes selected in the network. LetA
1andA2be its corresponding coefficient matrices The second partc11c21. . .ck1. . .c1kc2k. . .ckkis a binary in the normal and abnormal tissue samples. LetW⫽
string indicating the network structure. GAs attempt to A
1 ⫺ A2 andwij be an element of the matrixW. Since
find individuals from the search space with the best w
ijis a parameter in the network, its asymptotic standard
fitness (e.g., smallest AIC value). The searching proce- deviation can be calculated from the square root of the dure of GAs can be briefly described as follows. First, main diagonal of the asymptotic covariance matrix of the initial population is generated randomly, and the the estimated parameters in the network and denoted fitness of each individual is calculated. Second, individu- byS
Wij. We define the test statisticTGas als with good fitness are selected as parents. These
par-ents produce children by the operations of crossover
TG⫽
Wij
SWij
.
and mutation. A crossover operation in a GA algorithm produces two children by an exchange of chromosome
Although the exact distribution ofTG is unknown, its segments between two parents. The mutation operation
asymptotical distribution can be approximated by a t
creates children by changing parents’ chromosomes.
distribution withN ⫺ 2 d.f. This statistic can be used All new produced children are added to the population.
to test the difference of the regulatory effect of one Some individuals with worse fitness (e.g., higher AIC
gene on another between normal and abnormal tissues. values) are removed from the extended population
(in-The difference of the regulatory effect of one gene cluding both parents and children) to generate a new
on another cannot measure the difference in the global population with its initial size, but with better fitness.
behavior of the genetic networks between normal and Crossover and mutation play different roles in the
ge-abnormal tissues. A simple quantity to measure the dif-netic algorithm. Crossover increases the average fitness
ference in global behavior of genetic networks between of the population. Mutation can help the algorithm to
the normal and abnormal tissues is the largest absolute avoid local optima by exploring new states. After many
value of the difference of the regulatory effect of one iterations of GAs most likely or near most likely networks
gene on another in the network between the normal to fit the data can be found. When the difference
be-and abnormal tissues,i.e.,w0⫽ maxi,j|wij|⫽ |wi0j0|. The
tween AIC values of two successive iterations is less than
a prespecified threshold, the iteration of GAs is stopped. statisticTGfor testing the difference of individual regula-tory effect can be used to test the difference in global
The generalizedT2statistic for testing the differential
behavior of genetic networks. Specifically, the statistic
expression of genetic networks:Let X1 and X2 be the
for testing the differential regulation of the genetic net-mean value of expression of all the genes in the network
works is given by from normal and abnormal tissues, respectively. LetSpool
be the pooled estimate of common covariance matrix
between gene expressions. It can be shown that T G0 ⫽
wi0j0 Swi
0j0
.
T2⫽
n1 ⫹n2⫺ p⫺1(n1 ⫹n2 ⫺2)p
n1n2
n1⫹ n2
D2
The P value is calculated by a permutation test. The gene expression profile matrix is randomly permuted, and the structural equation model and genetic algo-(Anderson1984) follows anF-distribution withv1⫽p rithms are applied to randomly permutated gene ex-andv2 ⫽n1 ⫹n2⫺ p⫺1 d.f., where pression data to reconstruct the genetic network
hun-dreds or thousands of times. Then, we calculateTG0and D2⫽ (X
1⫺X2)TS⫺1pool(X1⫺X2),
obtain an empirical distribution ofTG0. TheP value of n1andn2are the sample sizes of normal and abnormal the test is then defined as the probability thatTG0 ex-tissues, respectively, and p is the number of genes se- ceeds its observed value. The statisticTG0 can be used lected in the test statistic. Consequently,T2can be used to measure the difference in regulation of the genetic to test whether the population means,1and2, differ network.
significantly and to test for the significance of separa- The difference in global behavior of genetic networks tion of two populations (normal and abnormal tissues). between the normal and abnormal tissues depends on Formally, the null hypothesis H0:1⫽ 2vs.the alterna- the whole regulatory coefficient matrix. A scalar associ-tive hypothesis Ha:1⬆2is assumed. If H0is rejected ated with a matrix W is a norm of the matrixW that on the basis of a T2 test, we can conclude that the denotes a real valued function ofW (of the elements
wijofW). The norm is relevant with all elements of the
popula-Figure1.—Path diagram for a genetic net-work of nine genes reconstructed from yeast cell cycle data.
matrix and hence can be used to measure the difference are time course data, their dynamics are stable. When in regulation of the whole genetic networks. Four met- the time intervals at which gene expressions are mea-rics borrowed from the norms of the matrix for measur- sured are not small, the observed expression can be ing the difference in regulation of the genetic networks viewed as being sampled from near steady state of the are defined as follows (Graybill1976): yeast cell cycle dynamic system. Therefore, it is possible to use ordinary structural equations to model such sys-1. ||W||1⫽maxj(
兺
pi⫽1⫹q|wij|)⫽maximum of sums ofabso-tems. This example also serves to investigate how well lute value of column elements of the matrix.
ordinary structural equations are used to approximate 2. ||W||∞⫽maxi(
兺
p⫹q
j⫽1|wij|)⫽maximum of sums of
abso-stable dynamic systems. lute values of row elements of the matrix.
The genetic network shown in Figure 1 was recon-3. ||W||2⫽square root of the maximum eigenvalues of
structed by applying the proposed structural equation the matrixWTW, a spectral norm.
model to the expression profiles of the genesCDC28, 4. ||W||E⫽ [兺i 兺j(|wij|)2]1/2, a Euclidean norm.
CLB1,CLB3,MCM1,MCM2,SWI4,CLN3,CDC47, and
CDC6, which play an important role in the M/G1 phase
RESULTS of the cell cycle. The regulatory relations between the
genes in the network can be confirmed by the
experi-Illustration of structural equations for modeling
ge-ments (Koch and Nasmyth 1994; McInerny et al.
netic networks:To illustrate the use of structural
equa-1997).Zhang(1999) investigated transcriptional regu-tions for modeling genetic networks, we first analyze the
lation of the M/G1 phase in budding yeast using the expression profiles of 6220 genes using oligonucleotide
same gene expression data and found that the genes arrays in synchronized yeast cells during the cell cycle
CLB1, CLB2, CLB3, and CDC28 regulated the expres-(Choet al. 1998). Data were collected at 17 points that
sions of the genesCLN3,SWI4,CDC6, andCDC47. How-included nearly two full cell cycles. Genetic expression
ever, he could not further infer the regulatory relations profiles of the yeast cell cycle are time course data. The
either among the genesCLB1,CLB2,CLB3, andCDC28
ideal method for reconstruction of genetic networks
or among the genes CLN3, SWI4, Cdc6, and CDC47. for time course data is dynamic (rather than ordinary)
Therefore, our results gave a more detailed structure structural equations. Here, we use gene expression data
of the network than did those ofZhang(1999). of the yeast cell cycle as an example for illustration
A common approach for identifying networks is to of genetic network modeling by structural equations.
high-Figure2.—The fully connected genetic network with the smallest AIC value (AIC⫽
⫺64.02, fitting probability⫽1.0000) among the 129 fully connected genetic networks with 10 genes for yeast cell cycle gene ex-pression data.
scoring models and we use both AIC values and fitting fortunately, the currently proposed method cannot un-tangle direct and indirect effects of the genes. The ge-probability to score the model. AIC values, which have
a close relationship with the likelihood function, are netic network in Figure 2 has 10 genes: cell cycle gene
SWI4; a glycosyltransferase gene,ALG2, involved in the widely used model selection criteria. However, AIC
val-ues measure only the relative goodness of fit. On the dolichol pathway and regulated at two critical control points in the G1 phase of the cell cycle (G0/G1 and other hand, the fitting probability quantifies how well
the model explains the observed data. Therefore, we START;Lennonet al. 1995); an essential gene of Saccha-romyces cerevisiae affecting pre-tRNA processing, PTA1
use AIC values to select the model, but we also report
the fitting probability of the selected models to indicate (O’Connorand Peebles 1992); a pseudouridine syn-thetase gene, PUS1, which catalyzes the formation of how reliable the selected models are.
The gene SWI4plays an important role in cell cycle pseudouridines in tRNAs (Arluisonet al. 1999); a ser-ine and threonser-ine catabolism gene,CHA1(Bornaeset
progression (McInerny et al. 1997; Zhang 1999). As
an example, we searched for genetic networks with 10 al. 1992); and five other unknown genes.
To investigate the effect of removing a gene from the genes, including SWI4. We use genetic algorithms to
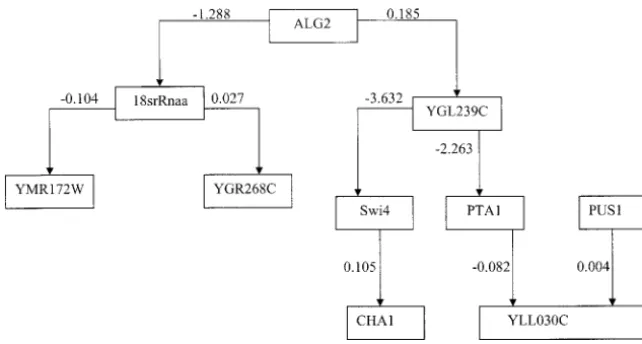
search for optimal subsets of genetic networks with the genetic network, we plotted Figure 3, in which the gene
SWI4was removed from the genetic network shown in smallest AIC values or the largest-fitting probability. Due
to the high cost of microarray experiments, the number Figure 2. It was interesting to note that most of the regulatory effects in the genetic network were not of tissue samples is often small relative to the number
of genes in the data set. In this case, the number of changed except for the regulatory effect of YGL239C onCHA1. This had an important implication: removing genetic networks with a high score is usually large.
Therefore, in searching for genetic networks withSWI4 a gene will influence only the effects of the genes that were directly connected with the removed gene, but it and the other 9 genes, we applied genetic algorithms
to the data set 500 times, which yielded 500 genetic did not have a significant impact on other parts of the genetic network.
networks with AIC values ranging from ⫺70.50 to
⫺55.02 and fitting probabilities ranging from 1 to 0.997. As the number of genes in genome-wide gene expres-sion profiles increases, the total number of all possible It was interesting to observe that of these 500, 371
ge-netic networks were partitioned into more than two genetic networks exponentially increases. This number of possible genetic networks is too large to be exhaus-disconnected networks, while the remaining 129 genetic
networks were fully connected. We ranked the fully con- tively searched. There are two approaches to treat this problem. One approach is an ensemble method for nected genetic networks according to their AIC values.
The highest-scoring fully connected genetic network identifying genetic networks that are consistent with existing gene expression profiling data (Battogtokh with the smallest AIC value was plotted in Figure 2.
Since the coefficients in the equations measure the mag- et al. 2002). The second, which we proposed, is to use genetic algorithms for searching genetic networks with nitude of influence of one gene on the expression of
another gene, they were referred to as the regulatory smallest AIC values. We hope that when we run a large number of iterations we can search and identify the effects of the genes. Since the connected genes in a
reconstructed network may or may not be physically most likely genetic network model with the smallest AIC value and the largest fitting probability. The AIC value connected in reality, the regulatory effect may be a
direct effect that is unmediated by other genes or may and fitting probability are referred to as the score of the genetic networks. To investigate whether genetic be an indirect effect that is mediated by other genes
Figure 3.—The genetic network in which the geneSWI4was removed from the genetic network shown in Figure 2.
score and how many iterations are required to achieve to search for networks with the fixed number of genes. In this way, for each fixed number of genes in the the highest score, genetic algorithms were applied to
yeast cell cycle data (Choet al. 1998) to search networks network we can obtain the largest fitting probability. We can see from Figure 6 that when the number of with 12 genes. Figures 4 and 5 plot the AIC value and
the fitting probability against the number of iterations, genes in the network was ⬎14 the fitting probability became small, which implied that the genetic network respectively. From Figure 4 we can see fluctuations in
AIC values, but we still can observe the decreasing trend did not fit the data well. The size of the genetic network (i.e., the number of genes in the network) is limited by of AIC values. From Figure 5 we can see that, after 80
iterations, these runs reach a fitting probability of 1. the number of tissue samples.
To further evaluate the performance of the proposed The largest fitting probability that we can reach after
a number of iterations is a function of the number of model for reconstructing genetic networks, we take 85 regulators of yeast listed inLeeet al. (2002), where the genes in the network. The fitting probability will
de-crease when the number of genes in the network in- remaining 21 of 106 regulators in Leeet al. cannot be found in theChoet al. (1998) data set, as the primary creases. To demonstrate this, we first fix the number of
genes in the network and run 100 genetic algorithms genes for reconstruction of genetic networks with six
Figure 5.—The fitting probability of 200 genetic networks with 12 genes as a function of the number of running genetic algorithms that were applied to yeast cell cycle gene expression data.
genes. For each regulator that was used as an exogenous ulator-regulated gene interactions were compiled in Table S1 (http://www.genetics.org/supplemental/), where P
variable in the structural equations or a primary gene
of the genetic network being reconstructed, genetic al- values were given by location analysis inLeeet al.(2002). From Table S1 we can see that those regulator-regulated gorithms were applied 300 times to the yeast cell cycle
data for searching genetic networks with six genes. From gene interactions predicted by the proposed structural equation model had smallPvalues in genome-wide loca-the reconstructed genetic networks with loca-the regulators as
primary genes of the genetic networks we can find pairs tion analysis (Leeet al.2002), which indicated that those predicted regulator-regulated gene interactions were of the regulator-regulated target gene. The identified
samples and 31 normal tissue samples (Zhanet al. 2002). These data were transformed by a natural logarithm and normalized by subtracting the mean of each gene and then dividing by its standard deviation. Genetic algorithms were applied to the data set 200 times to search for the most likely genetic networks with 10 genes that best fit the data. The AIC values for the resulting 200 genetic networks ranged from ⫺56.31 to ⫺67.55 and the fitting probability ranged from 0.9982 to 1. For each resulting network we calculated the test statistic
T2andPvalues for testing the difference in expression of the genetic network between normal and abnormal samples. A specific AIC value was taken as a threshold and all genetic networks whose AIC values were larger than the threshold were discarded. We then ranked the genetic networks according to theirT2values. The genetic network representing the most significant differ-ence in theT2 test had aPvalue⬍10⫺16and is shown in Figure 7. This network consisted of two subnetworks. ThePvalue of one subnetwork was⬍10⫺16and another subnetwork had a P value of 0.043. Several features emerged from Figure 6. First, the geneHG4462-HT4736
(immunoglobulin heavy chain) that was most signifi-cantly differentially expressed in the set of total genes (Pvalue⬍10⫺16) was included in the subnetwork with a significantly differentially expressed subnetwork. Sec-ond, in the network we observed another differentially expressed gene,DRIL1(Pvalue⫽0.000817), which was directly linked to the geneHG4462-HT4736. The gene
DRIL1is a dead-ringer transcription regulator and was recently identified as an oncogene (Peeperet al.2002). Third, the remaining genes in the network were not significantly differentially expressed. This demonstrated that the differential expression of the genetic network is a systems property, which does not imply that all genes Figure7.—The most significantly differentially expressed in the network are differentially expressed.
genetic network among the 200 genetic networks with 10 The differential expression of the genetic network genes for the MM data set where AIC⫽ ⫺65.70 and the fitting may be largely due to the differential expression of some probability⫽1.000. The numbers in parentheses below the
genes in the network. However, this need not always be
name of the gene denote thePvalue of evidence of showing
the case. For example, it is possible that all genes in a
differential expression of the individual gene, the numbers
along the edge denote the gene regulatory effect in the tumor genetic network are not highly differentially expressed,
tissues, and the numbers in parentheses along the edge denote but the network as a whole is highly differentially ex-the gene regulatory effect in ex-the normal tissues. pressed. To show this, we analyzed the expression
pro-files for 12,531 genes using an Affymatrix oligonucleo-tide array in 50 normal and 52 tumor prostate tissues confirmed by results of genome-wide location analysis (Singhet al. 2002). Again, genetic algorithms were ap-experiments. plied to this data set 200 times to search for the most
Figure 8.—The second-most significantly differentially expressed genetic network among the 200 genetic networks with 10 genes for the prostate data set where AIC⫽ ⫺52.93 and the fitting probability⫽0.9953. The num-bers in parentheses below the name of the gene denote thePvalue of evidence of show-ing differential expression of the individual gene, the numbers along the edge denote the gene regulatory effect in the normal tissues, and the numbers in parentheses along the edge denote the gene regulatory effect in the tumor tissues.
in the network (CAV1) was equal to 3.047⫻10⫺6and was 0.00062), which was associated with the regulation of the geneDF(D component of complement adipsin) on much larger than that of the genetic network as a whole.
In addition, although 2 genes, GNMSLL (P value ⫽ AX1, where thePvalue was obtained by a permutation test. From Figure 9, we could also observe that other 0.001308) andKIAA0610(Pvalue⫽0.0003191), showed
mild evidence of significance of difference expressions, regulatory effects in the network for the tumor and normal samples were not significantly different. It was the remaining 7 genes in the network did not show
any evidence of differential expression. This example interesting to note that the geneDF(P value⫽6.77⫻ 10⫺9) and the receptorAX1 (P value⫽ 4.78 ⫻ 10⫺10) demonstrated that the genetic network as a whole might
be more significantly differentially expressed than the as well as the network (P value ⫽ 3.87 ⫻ 10⫺14) were differentially expressed. The expression of the genes individual genes in the network. It was reported that
the geneCAV1was involved in breast cancer (Fiucciet AX1andDF and the fitted structural equation line of the expression of geneDFas a function of the expression
al. 2002; Lee et al. 2002) and ovarian carcinoma
(Wiechenet al. 2001). of the geneAX1in tumor and normal samples are shown
in Figure 10. The slope of the line represented the
Differentially regulated genetic networks:
Identifica-tion of differentially regulated genetic networks consists regulatory effect of the geneDF on the geneAX1. We could clearly see the different regulatory effects in the of three steps. First, we reconstruct genetic networks
using structural equations and gene expression data in tumor and normal samples from Figure 10. It was re-ported that the gene DF was a novel serine protease all available samples. Second, we fix the structure of the
genetic networks and then estimate network parameters (VolanakisandNarayana1996) and was involved in myeloid cell differentiation (Wong et al. 1999). The by using gene expression data of normal and abnormal
samples. Third, we rank the genetic networks according geneAX1was a tyrosine kinase receptor and was recently found downregulated in mature bone marrow-derived to some statistics, which measure the extent of the
differ-ence in regulatory effects of the genetic networks be- dendritic cells (Chenet al. 2002).
The secondmost differentially regulated genetic net-tween normal and abnormal tissue samples.
There are three important cases: (i) the genetic net- work for the MM data set with 10 genes that had an AIC value of⫺63.17 and a fitting probability of 0.9999 work is differentially regulated but not differentially
ex-pressed; (ii) the genetic network is differentially ex- is shown in Figure 11. Again, the network was parti-tioned into two subnetworks: one subnetwork with 4 pressed but not differentially regulated; or (iii) the
genetic network is both differentially regulated and ex- genes and one subnetwork with 6 genes. The largest difference in the regulatory effect was 2.523 (TG0⫽21.99, pressed. We first use the largest difference of the gene
regulatory effect in the network between normal and Pvalue⫽0.001), which was associated with the regula-tion of the gene ABCA2 on the gene GABA-A. It was abnormal samples as a measure to quantify the
differ-ence in regulation of the network. Then we compare all interesting that theP value for testing the differential expression of this subnetwork (with 6 genes) was equal five measures. The most differentially regulated genetic
network for the MM data set that had an AIC value of to P ⫽ 0.2672. Also we can see from Figure 11 that neitherABCA2norGABA-Awas differentially expressed.
⫺65.45 and a fitting probability of 1 is plotted in Figure
9. The network with 10 genes was partitioned into two This demonstrated that differentially regulated genetic networks may not be differentially expressed. Expres-subnetworks: one subnetwork with 8 genes and one
Figure9.—The most significantly differen-tially regulated genetic network among the 200 genetic networks with 10 genes for the MM data set where AIC⫽ ⫺65.45 and the fitting probability⫽1.0000. The numbers in paren-theses below the name of the gene denote the
P value of evidence of showing differen-tial expression of the individual gene, the num-bers along the edge denote the gene regu-latory effect in the tumor tissues, and the numbers in parentheses along the edge denote the gene regulatory effect in the normal tissues.
the expression ofABCA2in tumor and normal samples of the structural equation lines of GABA-A on ABCA2
in tumor and normal samples can be significantly differ-are shown in Figure 12. We can see from Figure 12 that
tumor and normal samples cannot be separated by the ent. It was reported thatABCA2was a regulator of neural transmembrane lipid transport (SchmitzandKaminski expression ofGABA-A andABCA2; however, the slope
Figure10.—Fitted structural equa-tion line of the expression of the gene
Figure 11.—The second-most significantly differentially regulated genetic network among the 200 genetic networks
Figure13.—The most significantly differentially expressed with 10 genes for the MM data set where AIC⫽ ⫺63.17 and
genetic network among the 200 genetic networks with 10 the fitting probability⫽0.9999. The numbers in parentheses
genes for the prostate data set where AIC ⫽ ⫺51.56 and below the name of the gene denote thePvalue of evidence
the fitting probability⫽0.9827. The numbers in parentheses of showing differential expression of the individual gene,
num-below the name of the gene denote thePvalue of evidence bers along the edge denote the gene regulatory effect in the
of showing differential expression of the individual gene, the tumor tissues, and the numbers in parentheses along the edge
numbers along the edge denote the gene regulatory effect in denote the gene regulatory effect in the normal tissues.
the normal tissues, and the numbers in parentheses along the edge denote the gene regulatory effect in the tumor tissues.
2002) and played a role during myelination (Zhouet
al. 2002). The GABA-A receptor gene was a neurotrans- tion of SW 480 colon carcinoma cells (Joseph et al. 2002) and played a role in breast cancer (Garibet al.
mitter receptor gene (IwamaandGojobori2002)
asso-ciated with epilepsy (Bowseret al. 2002) bipolar disor- 2002), renal carcinoma (Dotanet al. 2000), and hepato-cellular carcinoma (Zhanget al. 2000).
der (Papadimitriou et al. 2001). It was also reported
that GABA-A was an inhibitory regulator for the migra- The most significantly differentially expressed genetic
Figure 12.—Fitted structural equa-tion line of the expression of the gene
TABLE 1 the past decades, several causal inference tools have been developed. Pearl (2000), who coined the term
Correlation coefficients between rankings of the genetic
“Bayesian networks in 1985, expressed his preference
networks for prostate normal and tumor tissue sample
for functional causal models in his bookCausality:
Mod-gene expression profiles made by the five metrics
els, Reasoning, and Inference. His reasoning is as follows.
maxi,j|wi j| ||W||1 ||W||∞ ||W||2 ||W||E First, the functional causal models are more general than Bayesian networks. Second, the functional causal
maxi,j|wi j| 1 0.9418 0.9864 0.9921 0.9839
models share more features with human intuition.
Fi-||W||1 1 0.9234 0.9676 0.9509
nally, some concepts that are ubiquitous in human
lan-||W||∞ 1 0.9841 0.9773
guage can be described only in functional causal
mod-||W||2 1 0.9885
||W||E 1 els. The general form of functional causal models is structural equations. In this report, we proposed struc-tural equations as a useful tool for quantitatively study-ing genetic networks.
network for the prostate data set, which is shown in Identification of genetic networks consists of two Figure 13, had an AIC value of⫺51.56, a fitting
prob-steps: parameter estimation and structure discovery. In ability of 0.9827, and aPvalue for testing the significance
the first step, we assume that the structure of the network of differential expression of 2.47 ⫻ 10⫺12. The gene
is known. A remarkable feature of the regulatory
rela-SLC25A6(Pvalue⫽1.96⫻10⫺11) and the geneANGPT1
tion among genes in the network is that the expression (P value⫽ 1.91⫻ 10⫺9) in the network showed
signifi-levels of the genes are determined by the simultaneous cant evidence of differential expressions. However, the
interaction of the regulatory relations in the network. rank of the genetic network in the differentially regulated
Using ordinary regression and the least-squares method genetic network for the prostate data was 122. The largest
for estimation of the parameters will result in inconsis-difference in the gene regulatory effects of the network
tent estimates of the parameters in the network. The was 0.877 (TG ⫽ 8.5253,P value⫽ 0.15). This demon- proposed structural equation models and estimation strated that although this genetic network was highly
procedures based on covariance analysis can avoid this differentially expressed, it was not differentially
regu-problem and lead to consistent estimates of the
parame-lated. ters in the networks.
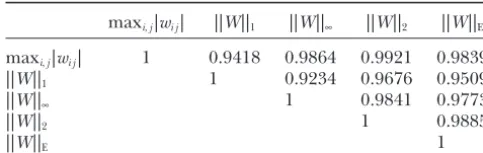
To compare the five metrics for characterizing the The second step is to identify the structure of the difference in regulation of the genetic networks under networks when it is unknown. The genetic networks that different conditions, we present Table 1, which shows best fit the data may not be truly physically connected, the correlation coefficients between rankings of the
ge-but can reveal causal relations between variables in the netic networks made by the five metrics. We can see
network and predict the behavior of biological systems. that the correlation coefficients between rankings of
We used model selection to accomplish this task. Since the five metrics were very high. This suggested that
searching optimal models from an extremely large num-the five metrics can provide similar evidence showing
ber of potential networks is computationally expensive, differential regulation of the genetic networks in
nor-we proposed using genetic algorithms to search the mal and abnormal tissues.
most likely genetic networks fitting the data.
Structure discovery is, essentially, to identify causal relations between variables in the model. The definition
DISCUSSION
of cause has three crucial components: isolation, associ-Genetic networks have two aspects: structure of the ation, and direction of influence (Bollen1989). Much networks and strength of the interaction between the of the debate about causal relations comes from inability genes in the networks. To understand comprehensively to completely isolate the variables. Although structural genetic networks, in addition to studying the nature of equation models make various assumptions to approxi-structure, we also need to quantify the strength of the mate isolation, it is impossible to achieve perfect isola-interaction between the genes. Due to the large varia- tion in practice. Therefore, the limitation of structural tion in observed gene expression profiles, quantitative equation models for genetic networks is that they may models for genetic networks may not be accurate, but not reveal true causal relations of the variables in the they will still be a useful tool for guiding experiments models, which will affect their precision in predicting and understanding complex biological systems, particu- the behavior of biological systems.
notypes is to characterize genetic networks in terms of LITERATURE CITED
cell phenotypes. It is known that the generalized T2
Akutsu, T., S. MiyanoandS. Kuhara, 2000 Algorithms for identi-fying Boolean networks and related biological networks based statistic has a close relationship with discriminant
analy-on matrix multiplicatianaly-on and fingerprint functianaly-on. J. Comput. sis. The highly differentially expressed genetic networks
Biol.7:331–343.
can discriminate the phenotypes of the cell. Therefore, Anderson, T. W., 1984 An Introduction to Multivariate Statistical Analy-sis, Ed. 2. John Wiley & Sons, New York.
differentially expressed genetic networks can provide
Arluison, V., G. Batelier, M. Ries-KauttandH. Grosjean, 1999 information on linking genetic networks to function of
RNA:pseudouridine synthetase Pus1 from Saccharomyces cerevis-cells. Here, we also need to point out that the general- iae: oligomerization property and stoichiometry of the complex
with yeast tRNA(Phe). Biochimie81:751–756. ized T2 test statistic uses only information from the
Arnold, J., H.-B.Schuttler, D.Logan, J.Griffith, B.Arpinaret al., expression levels of the genes in the networks, and does 2004 Metabolomics, inHandbook of Industrial Mycology. Marcel not explicitly use information on structure of the net- Dekker, New York (in press).
Battogtokh, D., D. K.Asch, M. E.Case, J.Arnoldand H.-B. Schut-works although it includes the covariance between
ex-tler, 2002 An ensemble method for identifying regulatory cir-pression levels of the genes in the network. It will be cuits with special reference to theqagene cluster of Neurospora useful to develop test statistics to explore both structural crassa. Proc. Natl. Acad. Sci. USA99:16904–16909.
Bertsekas, D. P., 1995 Nonlinear Programming. Athena Scientific, information and expression profiles of the genes in the
Belmont, MA.
network in the future. Bollen, K. A., 1989 Structural Equations With Latent Variables. John Wiley & Sons, New York.
Knowing differential expressions of the genetic
net-Bornaes, C., J. G. PetersenandS. Holmberg, 1992 Serine and works is not enough for understanding complex
biolog-threonine catabolism inSaccharomyces cerevisiae: the CHA1 poly-ical systems. Differences in gene expressions do not peptide is homologous with other serine and threonine
dehydra-tases. Genetics131:531–539. directly reflect strength between gene activities. The
Bowser, D. N., D. A. Wagner, C. Czajkowski, B. A. Cromer, M. W. differentially expressed genes may not be the cause of
Parkeret al., 2002 Altered kinetics and benzodiazepine sensitiv-diseases. To overcome this problem, we proposed the ity of a GABAA receptor subunit mutation [gamma 2(R43Q)] found in human epilepsy. Proc. Natl. Acad. Sci. USA99:15170– concept of differentially regulated genetic networks.
15175.
Therefore, to investigate how the activities of the genetic Brown, P. O., andD. Botstein, 1999 Exploring the new world of networks influence the phenotypes of cells, we need the genome with DNA microarrays. Nat. Genet.21:33–37.
Chen, T., H. L.Heand G. M.Church, 1999 Modeling gene expres-not only to discover the structure of genetic networks,
sion with differential equations. Pac. Symp. Biocomput.4:29–40. which specify the interaction of genes in the networks, Chen, Z., J. R. Gordon, X. ZhangandJ. Xiang, 2002 Analysis of but also to quantify the strength of the interaction and the gene expression profiles of immature versus mature bone marrow-derived dendritic cells using DNA arrays. Biochem. Bio-to measure the effect of induction and repression of
phys. Res. Commun.290:66–72.
target genes on other genes. Identification of differen- Cho, R. J., M. J. Campbell, E. A. Winzeler, L. Steinmetz, A. Conway tially regulated genetic networks may help us to discover et al., 1998 A genome-wide transcriptional analysis of the mitotic
cell cycle. Mol. Cell2:65–73. the cause of diseases. We proposed five statistics to
mea-Datta, S., 2001 Exploring relationships: a partial least square ap-sure the differences in regulation of the genetic net- proach. Gene Exp.9:257–264.
D’Haeseleer, P., X. Wen, S. FuhrmanandR. Somogyi, 1999 Linear works, some of which quantify the differences in
regula-modeling of mRNA expression levels during CNS development tory effects of the individual pair of the regulator and
and injury. Pac. Symp. Biocomput.4:41–52.
regulated genes, while others take differences in regula- Dotan, Z. A., T. Litmanovitch, Y. Ravia, N. Oniashvili, L. Leibov-itchet al., 2000 Modification in the inherent mode of allelic tory effects of all genes in the network into account.
replication in lymphocytes of patients suffering from renal cell We showed that in one important application these five carcinoma: a novel genetic alteration associated with malignancy. measures will identify a common set of differentially Genes Chromosomes Cancer27:270–277.
Duncan, O. D., 1975 Introduction to Structural Equation Models. Aca-regulated genetic networks.
demic Press, New York.
The expression level of each gene is a nonlinear func- Figeys, D., andD. Pinto, 2001 Proteomics on a chip: promising tion of its regulatory input. Linear tools for reconstruc- developments. Electrophoresis22:208–216.
Fiucci, G., D. Ravid, R. ReichandM. Liscovotch, 2002 Caveolin-1 tion of genetic networks can only approximately model
inhibits anchorage-independent growth, anoikis and invasiveness the response of the gene to the regulatory input. There- in MCF-7 human breast cancer cells. Oncogene21:2365–2375. fore, in some cases, the identified genetic networks Friedman, N., M.Linial, L.Nachmanand D.Pe’ere´, 2000 Using Bayesian networks to analyze expression data. J. Comput. Biol. based on the linear structural equations may not
repre-7:601–620.
sent the true biological systems. To overcome this prob- Gardner, T. S., D. di Bernardo, D. Lorenzand J. J. Collins, 2003 Inferring genetic networks and identifying compound lem, we need to develop nonlinear structural equation
mode of action via expression profiling. Science301:102–105. models for genetic networks in the future.
Garib, V., B. Niggemann, K. S. Zanker, L. BrandtandB. S. Kubens, 2002 Influence of non-volatile anesthetics on the migration be-The authors thank Joshua M. Akey for his helpful comments on
havior of the human breast cancer cell line MDA-MB-468. Acta this article, which helped to improve its presentation. We also thank
Anaesthesiol. Scand.46:836–844. the associate editor, Bruce Walsh, and two anonymous reviewers for
Graybill, A. A., 1976 Matrices With Applications in Statistics, Ed. 2. helpful comments on the manuscript, which led to much
improve-Wadsworth International Group, Belmont, CA.
ment of the article. M. M. Xiong and L. Jun are supported by National Haavelmo, T., 1943 The statistical implications of a system of simul-Institutes of Health-National Institute of Arthritis and Musculoskeletal taneous equations. Econometrica11:1–12.
statistically validate models of genetic regulatory networks. Pac. O’Connor, J. P., and C. L.Peebles, 1992 PTA1, an essential gene of Saccharomyces cerevisiae affecting pre-tRNA processing. Mol. Symp. Biocomput., 422–433.
Cell. Biol.12:3843–3856. Hasty, J., D. McmillenandJ. J. Collins, 2002 Engineered gene
Papadimitriou, G. N., D. G. Dikeos, G. Karadima, D. Aaramo-circuits. Nature420:224–230.
poulos, E. G. Daskalopoulouet al., 2001 GABA-A receptor Houseman, B. T., J. H. Huh, S. J. KronandM. Mrksich, 2002
Pep-beta3 and alpha5 subunit gene cluster on chromosome 15q11-tide chips for the quantitative evaluation of protein kinase activity.
q13 and bipolar disorder: a genetic association study. Am. J. Med. Nat. Biotechnol.20:270–274.
Genet.105:317–320. Hughes, T. R., andD. D. Shoemaker, 2001 DNA microarrays for
Pearl, J., 2000 Causality: Models, Reasoning, and Inference. Cambridge expression profiling. Curr. Opin. Chem. Biol.5:21–25.
University Press, Cambridge, UK/London/New York. Ideker, T., V.Thorsson, J. A.Ranish, R. Christmas, J. Buhler
Peeper, D. S., A. Shvarts, T. Brummelkamp, S. Douma, E. Y. Koh
et al., 2001 Integrated genomic and proteomic analyses of a
et al., 2002 A functional screen identifies hDRIL1 as an onco-systematically perturbed metabolic network. Science292: 929–
gene that rescues RAS-induced senescence. Nat. Cell Biol. 4:
934.
148–153. Imoto, S., T. Goto andS. Miyano, 2002 Estimation of genetic
Ronen, M., R.Rosenberg, B. L.Shraimanand U.Alon, 2002 As-networks and functional structures between genes by using
Bayes-signing numbers to the arrows: parameterizing a gene regulation ian networks and nonparametric regression. Pac. Symp.
Biocom-network by using accurate expression kinetics. Proc. Natl. Acad. put., 175–186.
Sci. USA99:10555–10560. Iwama, H., andT. Gojobori, 2002 Identification of
neurotransmit-Schmitz, G., andW. E. Kaminski, 2002 ABCA2: a candidate regula-ter receptor genes under significantly relaxed selective constraint
tor of neural transmembrane lipid transport. Cell. Mol. Life Sci. by orthologous gene comparisons between humans and rodents.
59:1285–1295. Mol. Biol. Evol.19:1891–1901.
Shipley, B., 2000 Cause and Correlation in Biology: A User’s Guide to
Jong, H. D., 2002 Modeling and simulation of genetic regulatory
Path Analysis, Structural Equations and Causal Inference. Cambridge systems: a literature review. J. Comput. Biol.9:67–103.
University Press, Cambridge, UK/London/New York.
Jordan, M. I., 1999 Learning in Graphical Models. MIT Press, Cam- Shmulevich, I., E. R. DoughertyandW. Zhang, 2002 Gene pertur-bridge, MA. bation and intervention in probabilistic Boolean networks. Bio-Joseph, J., B. Niggemann, K. S. ZaenkerandF. Entschladen, 2002 informatics18:1319–1331.
The neurotransmitter gamma-aminobutyric acid is an inhibitory Singh, D., P. G. Febbo, K. Ross, D. G. Jackson, J. Manolaet al., 2002 regulator for the migration of SW 480 colon carcinoma cells. Gene expression correlates of clinical prostate cancer behavior. Cancer Res.62:6467–6469. Cancer Cell1:203–209.
Koch, C., andK. Nasmyth, 1994 Cell cycle regulated transcription Volanakis, J. E., andS. V. Narayana, 1996 Complement factor D, in yeast. Curr. Opin. Cell Biol.6:451–459. a novel serine protease. Protein Sci.5:553–564.
Larranaga, P., M. Poza, Y. Yurramendi, R. H. MargaandC. M. H. Von Dassow, G., E. Meir, E. M. MunroandG. M. Odell, 2000 The Kuijpers, 1996 Structure learning of Bayesian networks by ge- segment polarity network is a robust developmental module. netic algorithms: a performance analysis of control parameters. Nature406:188–192.
IEEE Trans. Patt. Anal. Mach. Intell.18:912–926. Wahde, M., andJ. Hertz, 2000 Coarse-grained reverse engineering Lee, H., D. S. Park, B. Razani, R. G. Russell, R. G. Pestellet al., of genetic regulatory networks. Biosystems55:129–136.
2002 Caveolin-1 mutations (P132L and null) and the pathogen- Wiechen, K., L. Diatchenko, A. Agoulnik, K. M. Scharff, H. esis of breast cancer: caveolin-1 (P132L) behaves in a dominant- Schober et al., 2001 Caveolin-1 is down-regulated in human negative manner and caveolin-1 (⫺/⫺) null mice show mammary ovarian carcinoma and acts as a candidate tumor suppressor gene. epithelial cell hyperplasia. Am. J. Pathol.161:1357–1369. Am. J. Pathol.159:1635–1643.
Lee, T. I., N. J. Rinaldi, F. Robert, D. T. Odom, Z. Barjosephet Wong, E. T., D. E. Jenne, M. Zimmer, S. D. PorterandC. B. Gilks, 1999 Changes in chromatin organization at the neutrophil
elas-al., 2002 Transcriptional regulatory networks in Saccharomyces
tase locus associated with myeloid cell differentiation. Blood94: cerevisiae.Science298:799–804.
3730–3736. Lennon, K., R.Pretel, J.Kesselheim, S.Heesenand M. A.
Kukuru-Woolf, P. J., andY. Wang, 2000 A fuzzy logic approach to analyzing zinska, 1995 Proliferation-dependent differential regulation of
gene expression data. Physiol. Genomics3:9–15. the dolichol pathway genes in Saccharomyces cerevisiae.
Glycobi-Wright,S., 1921 Correlation and causation. J. Agric. Res.10:557– ology5:633–642.
585. Liang, S., S. Fuhrman andR. Somogyi, 1998 Reveal, a general
Young, R. A., 2000 Biomedical discovery with DNA arrays. Cell102:
reverse engineering algorithm for inference of genetic network
9–15. architectures. Pac. Symp. Biocomput.3:18–29.
Zhan, F., J. Hardin, B. Kordsmeier, K. Bumm, M. Zhenget al., 2002 Lipschutz, R. J., S. P. A. Fodor, T. R. GingerasandD. J. Lockhardt,
Global gene expression profiling of multiple myeloma, mono-1999 High density synthetic oligonucleotide arrays. Nat. Genet.
clonal gammopathy of undetermined significance, and normal
21(Suppl.): 20–24.
bone marrow plasma cells. Blood99:1745–1757. Lockhart, D. J., andE. A. Winzeler, 2000 Genomics, gene
expres-Zhang, M. Q., 1999 Large-scale gene expression data analysis: a new sion and DNA arrays. Nature405:827–836.
challenge to computational biologists. Genome Res.9:681–688. Mann, M., 1999 Quantitative proteomics. Nat. Biotechnol.17:954–
Zhang, M., Y. Gong, N. Assyand G. Y. Minuk, 2000 Increased
955. GABAergic activity inhibits alpha-fetoprotein mRNA expression
Maruyama, G. M., 1998 Basics of Structural Equation Modeling. SAGE and the proliferative activity of the HepG2 human hepatocellular Publications, Thousand Oaks, CA. carcinoma cell line. J. Hepatol.32:85–91.
McInerny, C. J., J. F. Partridge, G. E. Mikesell, D. P. Creemer Zhou, C. J., N. Inagaki, S. J. Pleasure, L. X. Zhao, S. Kikuyama andL. L. Breeden, 1997 A novel Mcm1-dependent element in et al., 2002 ATP-binding cassette transporter ABCA2 (ABC2) the SWI4, CLN3, CDC6, and CDC47 promoters activates M/G1- expression in the developing spinal cord and PNS during myelina-specific transcription. Genes Dev.11:1277–1288. tion. J. Comp. Neurol.451:334–345.
McLuckey, S. A., andJ. M. Wells, 2001 Mass analysis at the advent