R E S E A R C H A R T I C L E
Open Access
Estimation of an inter-rater intra-class
correlation coefficient that overcomes
common assumption violations in the
assessment of health measurement scales
Carly A. Bobak
1†, Paul J. Barr
2and A. James O’Malley
1,2*†Abstract
Background: Intraclass correlation coefficients (ICC) are recommended for the assessment of the reliability of measurement scales. However, the ICC is subject to a variety of statistical assumptions such as normality and stable variance, which are rarely considered in health applications.
Methods: A Bayesian approach using hierarchical regression and variance-function modeling is proposed to estimate the ICC with emphasis on accounting for heterogeneous variances across a measurement scale. As an application, we review the implementation of using an ICC to evaluate the reliability of Observer OPTION5, an
instrument which used trained raters to evaluate the level of Shared Decision Making between clinicians and patients. The study used two raters to evaluate recordings of 311 clinical encounters across three studies to evaluate the impact of using a Personal Decision Aid over usual care. We particularly focus on deriving an estimate for the ICC when multiple studies are being considered as part of the data.
Results: The results demonstrate that ICC varies substantially across studies and patient-physician encounters within studies. Using the new framework we developed, the study-specific ICCs were estimated to be 0.821, 0.295, and 0.644. If the within- and between-encounter variances were assumed to be the same across studies, the estimated
within-study ICC was 0.609. If heteroscedasticity is not properly adjusted for, the within-study ICC estimate was inflated to be as high as 0.640. Finally, if the data were pooled across studies without accounting for the variability between studies then ICC estimates were further inflated by approximately 0.02 while formerly allowing for between study variation in the ICC inflated its estimated value by approximately 0.066 to 0.072 depending on the model. Conclusion: We demonstrated that misuse of the ICC statistics under common assumption violations leads to misleading and likely inflated estimates of interrater reliability. A statistical analysis that overcomes these violations by expanding the standard statistical model to account for them leads to estimates that are a better reflection of a measurement scale’s reliability while maintaining ease of interpretation. Bayesian methods are particularly well suited to estimating the expanded statistical model.
Keywords: Bayesian analysis, Hierarchical regression, Variance function modelling, Reliability, ICC, Shared decision making, Observer OPTION5
*Correspondence:[email protected]
†Carly A. Bobak and A. James O’Malley contributed equally to this work.
1Department of Quantitative Biomedical Sciences, Geisel School of Medicine,
Dartmouth College, 1 Rope Ferry Road, 03755 Hanover, NH, USA
2The Dartmouth Institute, Geisel School of Medicine, Dartmouth College,
1 Rope Ferry Road, 03755 Hanover, NH, USA
Background
R. A. Fisher first introduced the concept of an intraclass correlation coefficient (ICC) in his 1921 paper examin-ing the familial resemblance between siblexamin-ings [1]. Since then, it has become an important measurement used in the fields of psychology, genetic linkage, heritability, sensitivity analysis, study design, DNA micro array anal-ysis, and health measurement scales [2–11]. The ICC is a measure of reliability, specifically the reliability of two different raters to measure subjects similarly [12, 13]. Inter-rater reliability is important as it demonstrates that a scale is robust to changes in raters. Hence, scales with high inter-rater reliability are less prone to mea-surement error such as caused by variation in human judgement [13].
In the area of health measurement scales, the ICC has been integrated into the Consensus-based Standards for the selection of the health status measurement instru-ments (COSMIN) check list. This checklist was devel-oped to assess the methodological quality of studies based on measurement attributes. One of the major boxes on the COSMIN check list is reliability, where it is rec-ommended that the ICC be used as a measurement of inter-rater reliability [9,10]. One of the driving factors of the uptake of the ICC in many fields is its ease of inter-pretation [9, 10]. The ICC is a value between 0 and 1, where values below 0.5 indicate poor reliability, between 0.5 and 0.75 moderate reliability, between 0.75 and 0.9 good reliability, and any value above 0.9 indicates excellent reliability [14].
However, it has been established that the ICC is sub-ject to a variety of methodological issues [1, 15–22]. These include a sensitivity to assumptions regarding normality and homogeneous variance, as well as hav-ing a negatively biased maximum likelihood estimator and least squares estimator [1, 18, 20–22]. A variety of methods have been proposed to address these con-cerns. Various variance-stabilizing transformations have been proposed [1, 19], as well as bias-corrected esti-mators [22, 23]. There are few factors which limit the uptake of such methods. First, guidance of how to prop-erly implement the ICC is not communicated clearly, particularly to non-statisticians. Secondly, ease of inter-pretation is of utmost importance with the ICC measure, and while transformations either pre-analysis or internal to a model can correct for heterogeneity in the vari-ance of the measurement across its true value or across other variables, they do so at the cost of interpretability. This has led to problematic misuses of ICCs in a vari-ety of disciplines, including the evaluation of health measurement scales. Herein we formulate solutions to these problems using the evaluation of an instru-ment for measuring shared decision making (SDM) for illustration.
Case study background: health measurement scales and observer OPTION5
Employing shared decision making between clinicians and patients has been linked to improvements in patient satis-faction, reduced decisional regret, and emerging evidence of improved treatment engagement [24]. Shared decision making (SDM) can be defined as a process by which patients and clinicians make decisions together, account-ing for patient preferences and values in light of the best available evidence for treatment options [25].
Measuring the quality of shared decision making imple-mentations in clinical settings is a challenging task [26]. Patient reported measures are common, but vary in length and quality of psychometric properties. They may also be prone to biases, such as “halo” effects leading to ceiling effects in measurement [27]. Observer measures, where trained raters evaluate shared decision making may be more accurate [28].
The Observer OPTION5 tool is a proposed improve-ment of the Observer OPTION12 tool [29, 30]. The Observer OPTION12 tool has been well-established for measuring shared decision making practices but has had mixed inter-rater reliability. It has been criticized for not placing enough emphasis on the patient’s role in the SDM process [29, 30]. The Observer OPTION5 instrument aims to ameliorate these shortcomings.
The Observer OPTION5tool is tightly focused on the idea of a collaborative deliberation model [29–31]. It’s a five item tool which produces a score between 0 and 20, which can be rescaled to 0 and 100 for interpretability. The patients rate the clinicians interactions in each of the five areas, giving a score between 0 and 4, where 0 is no effort and 4 is exemplary effort [29,30]. The five items are as follows:
1 The clinician indicates to the patient that there are treatment options,
2 The clinician aids in the informing and deliberating process for the patient,
3 The clinician explores the pros and cons of the treatment options with the patient,
4 The clinician attempts to ascertain the patient’s preferences in response to potential treatments discussed,
5 The clinician attempts to integrate the patient’s preferences in finalizing the treatment plan.
occur across various institutions and in a variety of set-tings. We argue that the traditional calculation of the ICC, which relies on the assumption that the variance between encounters is reasonably homogeneous, is too inflexible [1, 15–22]. As well, the common implementation of a bounded scale, or a scale bounded from below, in health measurement scales often leads to heteroscedasticity. We present a measure of ICC and method for estimating it that generalizes the incumbent approach to account for both heterogeneous data and heteroscedastic variances.
To allow an ICC that caters to multiple contexts to be estimated using a general strategy, we develop a Bayesian model and computational procedure. A desirable feature of Bayesian computations is that they avoid the reliance on analytic approximations when computing estimates. This is particularly pertinent in models that include vari-ance functions or other terms that introduce parame-ters in nonlinear forms, place constraints on parameparame-ters, or estimate nonlinear functions of parameters such as ICCs. It is known that Bayesian estimates can be more precise than their frequentist counterparts, especially when prior information is informative [32]. By illustrat-ing our approach on an evaluation of the increasillustrat-ingly popular Observer OPTION5 tool, we hope to catalyze the adoption of more meaningful and informative com-putations of ICC across all health measurement scale applications.
While we use OPTION5as a running example, the
pro-posed methodology applies to any data collected on a bounded response scale for which the agreement between raters is sought.
The remainder of this paper is organized as follows. We provide a brief background regarding the classical form of the ICC and illustrate how it can be over-estimated when between study variability is large in the “Methods” section. In the “Case study design” section we give an overview of the study conducted to assess the Observer OPTION5 tool and reveal the areas of statistical misuse that com-promise the measures of ICC that have been previously reported. In the “Bayesian framework” section we propose the Bayesian model that estimates an ICC which incor-porates data from heterogeneous populations and allows the variance of the measurements to be heteroscedastic. The “Evaluation of Bayesian Estimation” section details our process for computing our estimates, as well as three different scenarios we used to compare the estimates of our ICC. Our results from the original study, as well as our three scenarios are presented in the “Results” section. A brief discussion of these results and their impact on future research in health measurement scales is included in the “Discussion” section.
Methods
The ICC is mathematically defined as:
ICC= σ
2
b
σ2
b+σw2
=
1+ σ
2
w
σ2
b
−1
(1)
whereσb2is the variance between encounters, and σw2is the variance of the raters within encounters. Similarly, inter-rater reliability withkraters is denoted as:
R= σ
2
b
σ2
b +
σ2
w
k
=
1+ σ
2
w
kσb2 −1
(2)
Notice that (1) and (2) increase as σb2, the variance between encounters, increases. This can be a potential flaw in the calculation of the ICC, as the measure is artifi-cially inflated when the variance between different patient encounters is larger than will occur in the intended appli-cation of the instrument. For example, by pooling data from diverse study subjects, a measure will accurately discriminate between a greater proportion of subjects, inflating the ICC or reliability.
Bayesian framework
Leth = 1, ...,M, i = 1, ...,Nh, and j = 1,. . .,R be our
indices for the study, the patient-physician encounter, and the rater. In the OPTION5analysis the number of stud-ies isM= 3, the number of encounters within the three studies are (N1 = 201,N2 = 72,N3 = 38), and the
number of raters is R = 2 although the methodology applies to all values of these. LetYdenote the OPTION5 score divided by 100 (for ease of interpretation),θthe true amount of shared decision making, andXindicate the use of a PDA. Although the effect ofX is of interest to this field, our objective is to adjust for it’s effect so as to ensure that the evaluations of ICC are meaningful. Our statistical model is
Yhij|θhi,Xhi∼ Normal
μhij,v2hi
I(0, 1) (3)
where
I{yhij∈(0, 1)} (4)
restricts the probability distribution of the measured amount of SDM to the interval 0 to 1, and
μhij=θhi+β1(j−1.5)+β2(Xhi− ¯X) (5)
v2hi=σh2θhi(1−θhi) (6)
withX¯ denoting the sample mean value ofX. The depen-dence ofv2hi onθhi implies that the ICC depends on the
true amount of SDM in the encounter; its mathematical expression is referred to as a variance function.
θhi|study∼ Normal
γh,τh2
I(0, 1) (7)
where I, defined in (4), restricts the possible amount of SDM to be a proportion (0 to 1). The specification for
θhidepends on parameters which are indexed byh, giving
each study its own mean and variance. We set our prior distributions as follows:
γh∼ Normal
β0,ω2
βk ∼ Normal
b0I(k=0),B2, k=0, 1, 2 σ−2
h ∼ Gamma(v1,v1)
τ−2
h ∼ Gamma(v2,v2)
ω−2∼ Gamma(v 3,v3)
The choice of normal and gamma distributions for the regression (mean or location) and the variance (scale) parameters is common in practice as the conditional pos-terior distributions of each parameter conditional on the remaining parameters and the data are also normal and gamma distributions. This simplifies model estimation and computation.
The desire for the prior distribution to impart virtually no information onto the analysis is accomplished by speci-fying distributions with very large variances for the model parameters. As a consequence, the data are solely respon-sible for estimating the model. In this application we set b0 = 0.4,B2 = 10, andvl = 10−3forl = 1, 2, 3. Note
that parameters such as θhi that have restricted ranges
may be assigned prior distributions with almost no mass within the allowable range if the density is not truncated. If the allowed range is a region over which the unrestricted distribution is essentially flat, then the truncated distribu-tion will be close to uniform - essentially assuming that all allowable values of the parameter are equally likely. As well, parameters may have values such that the mean of the unrestricted distribution is outside the allowed range, and the truncated distribution will still be well-defined. Although the inverse-Gamma prior distributions assumed here for the variance parameters have been shown to yield undesirable results in some applications [33], we found that they were well suited to our case study in the sense that the results were quite robust to the prior distribution parameters. For example, the results withvl = 10−2for
l=1, 2, 3 were numerically almost identical to those with vl = 10−3 forl = 1, 2, 3. We attribute this result to the
fact that in our case study the scale of the data has a finite range, which prevents the tails of a prior distribution from having a substantial impact on the posterior.
Under the above model, the ICC for an encounter in studyhwith SDM ofθ∗is given by
ICCh(θ∗)=
τ2
h
τ2
h+σh2θ∗(1−θ∗)
(8)
Two salient features are evident in Eq. (8). Firstly, the within (σ2) and between (τ2) encounter variance and scale parameters depend on the index for study. Therefore, the ICC is study specific. Secondly, the within-encounter scale parameter is multiplied by θ∗(1 − θ∗), which crucially allows for the ability of raters to agree, or rate consistently, to depend on the actual amount of SDM. Because it is eas-ier to distinguish cases against a baseline level of a trait close to 0% or 100% than cases in which the trait is about 50% present (this is seen from the fact that the variability of a restricted scale is greatest around its middle point), the involvement of the binomial variance formθ∗(1−θ∗) makes intuitive sense.
In practice, one may choose a value ofθ∗that has par-ticular meaning or relevance to the application at which to compute the ICC. If multiple values ofθ∗ are impor-tant (e.g., the baseline levels for various population strata) a separate ICC can be reported for each of them. Alter-natively, or additionally, one may also choose to average over a population of values ofθ∗. For example, if we expect the population of patient-physician encounters on which the instrument will be applied to be described by the probability distribution,
θ∗∼π(θ∗)= Normalγh,τh2
I(0, 1),
it follows that the population average ICC, given by
ICCh=τh2
1
0
τ2
h +σh2θ∗(1−θ∗)
−1
π(θ∗) dθ∗, (9)
should be computed. The evaluation of multiple mea-sures of ICC yields a much more informative profile of an instrument’s performance than the presently used sin-gle number summary derived under overly restrictive assumptions. This function is designed in such a way that the user directly specifies a distribution forθ∗to maintain flexibility in the calculation of the ICC. This distribution can be specified with known parameters to avoid integra-tion over the hyper parameters γh andτh for simplicity.
Alternatively, the user could assume a hierarchical prior where integration over these parameters would also be necessary.
The ICC can also be defined for a scenario where encounters are pooled across studies. Assuming an equal probability of selecting an encounter from each study, the marginal variance across these encounters is ω2+ ¯τ2+
¯
σ2θ∗(1 − θ∗) (a more general expression may be
sub-stituted if the study selection probabilities are unequal). Hence, the corresponding measure of ICC is given by
ICCMarg(θ∗)= ω
2+ ¯τ2
ω2+ ¯τ2+ ¯σ2θ∗(1−θ∗) (10) Typically, one would see
Although the pooled or marginal ICC is well-defined under a specified model for sampling encounters from the individual studies, if the intended use of the instrument is to compare encounters across a homogeneous popula-tion of subjects (e.g., the reference populapopula-tion for a single study) then ICCMarg(θ∗)makes the instrument look better
in a meaningless way as it overstates the heterogene-ity between the subjects compared to the heterogeneheterogene-ity between the individuals in the population that the instru-ment will be used to compare or discriminate between in actual practice.
Summarizing the above, the three forms of ICC are seen to be components of a two-dimensional family of mea-sures of ICC defined under the full statistical model we developed to account for the intricacies of the data. The dimensions are: 1) whether or not the ICC is specific to a particular level of the quantity being studied versus aver-aging over a distribution of values of that quantity; 2) whether or not variability between studies is included in the between encounter variance (which corresponds to whether or not it is desired for the instrument to dis-criminate between encounters from different studies in practice). Combining these two dimensions, there are four general types of ICC that are available under the general approach we have proposed.
Evaluation of Bayesian Estimation
All analyses of the Observer OPTION5 data were con-ducted in R [34]. Markov Chain Monte-Carlo (MCMC) simulation for Bayesian estimation was implemented using Just Another Gibbs Sampler (JAGS) and integrated with pre- and post-processing using the R package ‘rjags’ [35, 36]. Three Bayesian models for three separate ICC scenarios are compared. The first is the full model, which separately calculates the posterior variance and ICC for each study. The second restricts the variances to be homogeneous across the three studies. The third ignores the issue of within-study heteroscedasticity in the vari-ability of raters’ assessments of the amount of SDM. Posterior distributions are summarized by their median and 95% symmetric credible interval (2.5th and 97.5th percentiles).
Case study design
Our main study of interest can be found in [30]. Data was collected from two previous studies, the Chest Pain Choice trial (Study 1) and the Osteroporosis Choice Ran-domized trial (Studies 2 and 3) [37, 38]. Both trials randomly assigned patients to either receive an interven-tion of use of a Personal Decision Aid (PDA), or receive usual care [37, 38]. The Osteoporosis Choice Random-ized trial contains a subgroup of participants who used the World Health Organization’s Fracture Risk Assess-ment Tool (FRAX®) [38]. For the purposes of our analysis,
we consider patients who used FRAX® as a separate study group (Study 3). The Chest Pain Choice trial recruited participants from St. Mary’s Hospital Mayo Clinic in Rochester, MN while the Osteoporosis Choice Random-ized trial recruited from 10 general care and primary care practices in the Rochester, MN area [37,38].
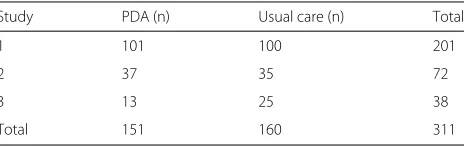
Audio-visual recordings of the patient-clinician encoun-ters took place and two-raencoun-ters independently assessed the recording of each patient-physician encounter across these three clinical studies of decision-aids using the Observer OPTION5 SDM tool. A total of 311 clinical encounters were included in the study Table1 summa-rizes these encounters across the three studies of interest. The overall Observer OPTION5score was calculated for
each encounter and rater [30]. The goal of the following analysis is to determine the concordance of the two raters despite the heterogeneity of the study groups and inherent heteroscedasticity.
In this particular case, the recorded encounters from all three studies were re-rated by the same two raters. Hence, we assume that the differences across the studies are due to the differences in populations and imposed interven-tions across each study. In many cases, there would also be heterogeneity across raters of studies, leading to even greater between-study heterogeneity than is observed in this case.
Results
The results from the rater’s independent assessment of SDM using Observer OPTION5 are shown in Fig. 1. In
general, Rater 1 consistently scored encounters higher than Rater 2.
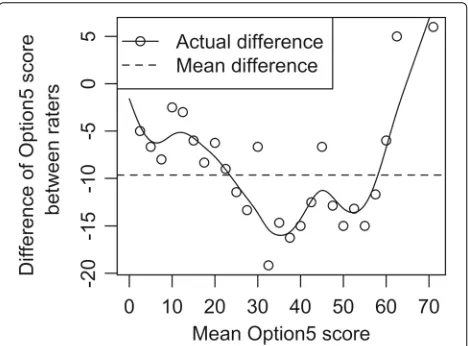
Figure 2 shows the actual difference of Observer OPTION5 scores as a function of the mean Observer OPTION5 score for each encounter. The mean differ-ence across the encounters is approximately 10 points, although over the range of 30–60 the sample differ-ences were consistently on the order of 12 to 16 and as high as 19.
Figure3 shows the empirical variance functions. The observed variance connected with a smoothing spline with 10 degrees-of-freedom is shown in the solid line, while the mean and binomial variance functions are shown in dashed lines. It is clearly demonstrated that the
Table 1Encounters from the three randomized studies which compared the impact of PDAs to standard care
Study PDA (n) Usual care (n) Total
1 101 100 201
2 37 35 72
3 13 25 38
Fig. 1Comparison of Observer OPTION5scores between raters. The
individual rater score is shown on the y-axis and the mean OPTION5
score is shown on the x-axis
variance is heteroscedastic and the sample mean variance across the encounters would yield a poor representation of the data. The binomial variance function performs bet-ter, suggesting that (6) may be an adequate model for the dependence of the variability of the raters’ scores on the amount of SDM in the encounter.
A virtue of the Bayesian approach is that it avoids analyt-ical approximations, even in complicated situations. The ICC is an example of a nonlinear function of parameters whose exact estimate and other inferences require vari-able transformation and high dimension integration to obtain the marginal posterior of the ICC. This happens
Fig. 2Actual difference of Observer OPTION5between raters over the
mean OPTION5score. While the average difference is slightly less
than 10, this difference varies greatly across the mean score, demonstrating non-constant variance
Fig. 3Empirical variance of scores Compares the mean variance, binomial variance, and the observed variance (using a smoothing spline with 10 degrees of freedom) of Observer OPTION5score.
Highlights the heteroscedasticity of the variance as a function of the mean
automatically when Monte Carlo averages are evaluated over draws of parameters from the joint posterior dis-tribution without requiring complicated mathematics to make accurate approximations. Hence, the joint posterior is used implicitly by the user.
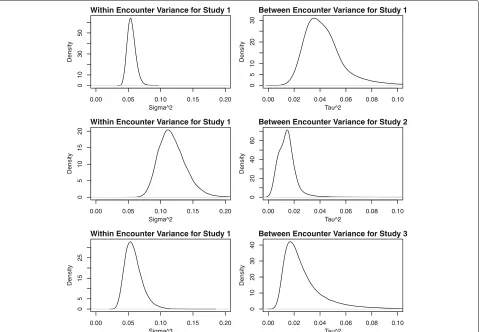
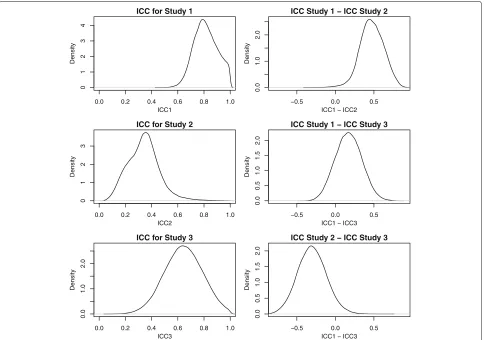
To further illustrate the utility of our approach, we have produced plots of the posterior distribution of the key parameters underlying the ICC, the within-encounter variance and the between-encounter (within study) vari-ance, for each study in Fig. 4. We also have made plots of the ICCs for each study and the difference in the ICC for each pair of studies in Fig.5. In addition, we have also summarized the differences in the ICC between studies in terms of the posterior mean, posterior median, the 2.5 and 97.5 quantiles, and the posterior probability that the difference exceeds 0 in Table 2. Together, these figures and summary statistics provide a detailed description of the heterogeneity in the reliability of the measurement properties for each study and the statistical significance of differences between them. Such inferences are exact (to the numerical precision of the number of iterations we ran the MCMC procedure) and are trivial to obtain using Bayesian computation whereas more laborious and specialized calculations would be needed with frequentist calculation.
Fig. 4A comparison of the posterior distribution of the key parameters underlying the ICC between the within-encounter variance and the between-encounter (but within study) variance across the three studies
3 were computed for a hypothetical new patient from the population of patients represented in each study (this corresponds to the population average ICC computed in Eq. 9). Note that the variance estimates are scaled to represent the rescaling of the OPTION5 score from
(0, 100)to(0, 1). The resulting posterior means of the ICC were 0.821, 0.295, and 0.644 respectively. The estimate for Study 2 is particularly low in comparison to Study 1 (the posterior probability that study 1 has a higher ICC than study 2= 0.995) and Study 3 (the posterior proba-bility that study 3 has a higher ICC than study 2=0.944), demonstrating the extent of the heterogeneity between each study and how the ICC appraises very different impressions of the performance of Observer OPTION5 across the studies due to differences in the variability of SDM in the encounters it is trying to discriminate between. The credible intervals associated with the ICC estimates are quite wide due to the relative small sam-ple sizes in two of the studies and the fact that there are only three studies to inform the between-study variance component,ω.
Fig. 5Posterior distributions of the ICCs for each study, and the difference in the ICC for each pair of studies
were further inflated by approximately 0.02 (model not presented) while incorporating between study variation in the ICC via Eq. (10) yields estimates 0.072 or 0.066 greater depending on whether heteroscedasticity was accounted (Table3) or ignored (Table4).
Figure6 illustrates the dependence of the ICC on the true amount of SDM in an encounter and the study in which the encountered occurred. The ICC trajectory lines for each study were constructed by evaluating the pos-terior mean of the ICC defined in (8) at 101 values of SDM (θ∗) evenly spaced from 0 to 1. Due to the concave shape of the variance function, encounters are easier to discriminate when the mean is closer to 0 or 100 than to 50 with the difference quite substantial. The contrasting
Table 2The differences in the ICC between studies in terms of the posterior mean, median, the 2.5 and 97.5 quantiles, and the posterior probability that the difference exceeds 0
Paired difference 2.50% Median Mean 97.50% p-value
Study 1 - Study 2 0.166 0.472 0.473 0.764 0.995
Study 1 - Study 3 -0.155 0.170 0.171 0.508 0.835
Study 2 - Study 3 -0.659 -0.306 -0.302 0.078 0.056
Table 3Full model results from Bayesian Framework*
Term Posterior summary
Median 2.5% 97.5%
β[0] 0.145 -0.087 0.490
β[Rater] -0.061 -0.073 -0.051
β[Decision-aid] 0.239 0.214 0.270
(σ/100)2[Study 1] 0.054 0.044 0.070
(σ/100)2[Study 2] 0.117 0.084 0.168
(σ/100)2[Study 3] 0.056 0.037 0.090
τ2[Study 1] 0.043 0.024 0.097
τ2[Study 2] 0.011 0.004 0.034
τ2[Study 3] 0.023 0.009 0.078
ω 0.029 0.003 0.717
ICC[Study 1] 0.821 0.655 0.985
ICCStudy 2] 0.295 0.119 0.628
ICC[Study 3] 0.644 0.359 0.919
Table 4Results for homogeneous variance using a Bernoulli variance function to capture heteroscedastic variance
Term Posterior summary
Median 2.5% 97.5%
β[0] 0.317 0.203 0.449
β[Rater] -0.088 -0.102 -0.074
β[Decision-aid] 0.250 0.217 0.281
(σ/100)2 0.041 0.035 0.048
τ 0.015 0.011 0.019
ω 0.004 0.001 0.092
ICC 0.609 0.520 0.745
ICCb∗ 0.681 0.568 0.935
*ICCb denotes the ICC for the case when encounters are pooled across studies (see
Eq.10) whereas ICC is the conventional within-study ICC (see8). In both cases the ICC is averaged over a population of encounters, as in9
level of ICC across the three studies further emphasizes their heterogeneity.
Discussion
According to the COSMIN checklists, assessing the inter-rater reliability of instruments is essential when proposing novel health measurement scales [9,10]. These guidelines recommend assessing the ICC to examine the reliability of proposed measures, but only briefly allude to the limita-tions of broadly applying ICC (or reliability) estimates. As a result, the mass use of the ICC in the field of health mea-surement has lead to a variety of studies which may have miss-stated the reliability of new instruments from ignor-ing heteroscedasticity. For instance, Scholl et al review a collection of instruments with restricted scales that cal-culate ICC or inter-rater reliability many of whom do not account for the dependence of the variability of measure-ments on the value of the quantity being measured [28].
Table 5Results for homogeneous variance using a constant variance function
Term Posterior summary
Median 2.5% 97.5%
β[0] 0.319 0.206 0.451
β[Rater] -0.097 -0.111 -0.083
β[Decision-aid] 0.278 0.248 0.309
(σ/100)2 0.008 0.007 0.009
τ 0.014 0.011 0.017
ω 0.004 0.001 0.091
ICC 0.640 0.568 0.702
ICCb∗ 0.706 0.614 0.930
*ICCb denotes the ICC for the case when encounters are pooled across studies (see
Eq.10) whereas ICC is the conventional within-study ICC (see8). In both cases the ICC is averaged over a population of encounters, as in9
Fig. 6Direct analysis of ICC as a function of level of agreement Relationship of ICC to the true amount of shared decision making (SDM) in an encounter and heterogeneity of reliability of measurements across studies. The ICC is higher at the ends of the scale than at the center where the variability under the binomial variance function of rater scores on the same encounter is greatest and the difference in the reliability of measurements across the studies is substantial
As well, there are many other studies of instruments with restricted scales which have given no indication that the assumption of homogenous variance has been met [39–41]. All of these studies are candidates for having miss-stated the ICC, and would benefit from implement-ing the framework proposed here. Furthermore, ICC estimates often have great implications in experimental design considerations, particularly in terms of properly powering studies. Hence, it is extremely important to have estimates that account for heteroscedasticity and apply to the context in which the instrument is planned to be used [22].
In a published guideline for selecting and reporting ICC measures, Koo and Li discuss 10 different forms of ICCs based on the model, type of measurement whether it be the mean of k-raters or a single-raters measurement, and whether or not absolute agreement or consistency is desired [14]. The measurement we’ve proposed here is an inter-rater, inter-case discriminatory ICC and hence applies for forms of the ICC considering multiple raters and emphasizing consistency of measurements.
and other non-statisticians. As well, the implementation of a Bayesian framework negates the issue of a biased estimate for the ICC, as Bayesian estimates do not rely on closed-form approximations and normal distribution asymptotic theory [32,42].
Because a wide variety of appraisals of Observer OPTION5are possible using these data, it is possible that overly optimistic assessments could have been published and erroneously influenced research using Observer OPTION5to measure SDM (e.g., studies may be under-powered) if assumptions were not clearly described. We hope that the methodology outlined in this paper will be adopted widely and lead to correctly calibrated estimates and descriptions of ICC and, therefore, more informa-tive profiles of instrument quality being used in important applications.
It should be noted, that while this approach will work for any case in which the measurement is bounded, it may be overkill when examining data from a single study where the outcome is tightly distributed around the mid-dle of the scale. In that particular situation, conventional approaches for calculating the ICC should be satisfactory. In the absence of these conditions, the approach we are proposing here should be utilized.
An advantage of the framework developed in this paper is that it applies to any number of studies, raters, and encounters within studies. However, as the ICC is often calculated by non-statisticians, a potential limita-tion of this framework is the perceived learning curve in applying a Bayesian approach for estimation. Frequen-tist approaches dominate the medical literature, although it has been argued that clinicians naturally use Bayesian thinking in their everyday decision making [43]. To aid in the easy implementation of our framework, we deposited the R code used to generate our estimates in GitHub (see
Availability of data and materials) along with the code we used to simulate data from the model described here to avoid potential patient data confidentiality issues.
While this paper mostly focused on the context of calcu-lating an ICC in terms of developing measurement scales for health practitioners, this framework naturally extends into many other fields. Future work will include extending the approach to other fields of study.
Conclusion
Despite its wide-spread use as an important measure of inter-rater reliability, there are a variety of established methodological issues that need to be considered in spec-ifying and estimating an ICC [1,15–22]. As it is a metric which is frequently applied by non-statisticians, there is concern that these issues are not properly being accounted for and, as a result, inflated ICC estimates are being pub-lished in the literature across a variety of fields. In this work, we propose a Bayesian framework for estimating
the ICC that accounts for heteroscedastic variances and avoids relying on an estimator’s normality for inferences to be correct. A particular strength of this approach is that it yields estimates which are robust to many com-mon errors in ICC calculation while maintaining straight-forward interpretation for researches across many fields of interest. Widespread adoption of this model-based ICC definition and allied estimation procedure would ulti-mately lead to more flexible and accurate representation of inter-rater reliability.
Abbreviations
COSMIN: Consensus-based standards for the selection of health status measurement instruments; ICC: Intraclass correlation coefficient; JAGS: Just another Gibbs sampler; MCMC: Markov chain Monte-Carlo; PDA: Personal decision aid; SDM: Shared decision making
Acknowledgements
The author’s acknowledge the support of the Knowledge and Evaluation Research (KER) Unit at the Mayo Clinic (Rochester, MN, USA) in supplying the data used for the illustrative analyses.
Funding
No external support was received for this work. Dartmouth College holds an Institutional Program Unifying Population and Laboratory Based Sciences award from the Burroughs Wellcome Fund, and C. Bobak was supported by this grant (Grant#1014106).
Availability of data and materials
A generated dataset that is structurally equivalent to the actual data as well as all code used to generate these analyses is available in the Bayesian Framework for InterRater ICC repository,https://github.com/CarlyBobak/ Bayesian-Framework-for-InterRater-ICC. The data that support the findings of this study are available from Victor M. Montori, M.D. upon reasonable request.
Authors’ contributions
CB contributed to the drafting of the manuscript and the implementation of the framework in R and JAGS. PJB contributed to the study design of the illustrative application and drafting of the manuscript. AJO contributed to the design of the framework, original implementation in R, and the drafting of the manuscript. All authors read and approved the final manuscript.
Ethics approval and consent to participate
N/A
Consent for publication
N/A
Competing interests
The authors declare that they have no competing interests.
Publisher’s Note
Springer Nature remains neutral with regard to jurisdictional claims in published maps and institutional affiliations.
Received: 23 November 2017 Accepted: 23 August 2018
References
1. Fisher RA. On the “probable error” of a coefficient of correlation deduced from a small sample. Metron. 1921;1:1–32.
2. Ebel RL. Estimation of the reliability of ratings. Psychometrika. 1951;16: 407–24.https://doi.org/10.1007/bf02288803.
3. Strah KM, Love SM. The in situ carcinomas of the breast. J Am Med Women’s Assoc (1972). 1992;47:165–8.
from genome-wide identity-by-descent sharing between full siblings. PLoS Genet. 2006;2:41.https://doi.org/10.1371/journal.pgen.0020041. 5. Bradley RA, Schumann DEW. The comparison of the sensitivities of similar
experiments: Applications. Int Biom Soc. 1957;13:496.https://doi.org/10. 2307/2527974.
6. Pellis L, Hal NLWF-v, Burema J, Keijer J. The intraclass correlation coefficient applied for evaluation of data correction, labeling methods, and rectal biopsy sampling in dna microarray experiments. Physiol Genomics. 2003;16:99–106.https://doi.org/10.1152/physiolgenomics. 00111.2003.
7. Killip S. What is an intracluster correlation coefficient? crucial concepts for primary care researchers. Ann Fam Med. 2004;2:204–8.https://doi.org/10. 1370/afm.141.
8. Ukoumunne OC, Davison AC, Gulliford MC, Chinn S. Non-parametric bootstrap confidence intervals for the intraclass correlation coefficient. Stat Med. 2003;22:3805–21.https://doi.org/10.1002/sim.1643. 9. Mokkink LB, Terwee CB, Patrick DL, Alonso J, Stratford PW, Knol DL,
Bouter LM, de Vet HC. COSMIN checklist manual. Amst Univ Med Cent. 2012.
10. Mokkink LB, Terwee CB, Patrick DL, Alonso J, Stratford PW, Knol DL, Bouter LM, de Vet HCW. The COSMIN checklist for assessing the methodological quality of studies on measurement properties of health status measurement instruments: an international delphi study. Qual Life Res. 2010;19:539–49.https://doi.org/10.1007/s11136-010-9606-8. 11. McGraw KO, Wong SP. Forming inferences about some intraclass
correlation coefficients. Psychol Methods. 1996;1(1):30–46.https://doi. org/10.1037/1082-989x.1.1.30.
12. Fisher RA. Statistical methods for research workers. In: Breakthroughs in statistics. Springer; 1992. p. 66–70.
13. Shrout PE, Fleiss JL. Intraclass correlations: uses in assessing rater reliability. Psychol Bull. 1979;86(2):420.
14. Koo TK, Li MY. A guideline of selecting and reporting intraclass correlation coefficients for reliability research. J Chiropr Med. 2016;15(2): 155–63.https://doi.org/10.1016/j.jcm.2016.02.012.
15. Altaye M, Dormer A, Klar N. Inference procedures for assessing interobserver agreement among multiple raters. Biometrics. 2001;57(2): 584–8.
16. Ghosh H, Das A. Optimal diallel cross designs for estimation of heritability. Stat Med. 2003;116:185–96. https://doi.org/10.1016/s0378-3758(02)00180-5.
17. Shoukri M, Donner A. Efficiency considerations in the analysis of inter-observer agreement. Biostatistics. 2001;2(3):323–36. 18. Konishi S. Normalizing and variance stabilizing transformations for
intraclass correlations. Ann Inst Stat Math. 1985;37(1):87–94. 19. Weinberg R, Patel YC. Simulated intraclass correlation coefficients and
their z transforms. J Stat Comput Simul. 1981;13(1):13–26.
20. Wang CS, Yandell BS, Rutledge JJ. Bias of maximum likelihood estimator of intraclass correlation. Theor Appl Genet. 1991;82:421–4.https://doi. org/10.1007/bf00588594.
21. Ponzoni R, James J. Possible biases in heritability estimates from intraclass correlation. Theor Appl Genet. 1978;53(1):25–7. 22. Atenafu EG, Hamid JS, To T, Willan AR, Feldman BM, Beyene J.
Bias-corrected estimator for intraclass correlation coefficient in the balanced one-way random effects model. BMC Med Res Methodol. 2012;12.https://doi.org/10.1186/1471-2288-12-126.
23. Olkin I, Pratt JW. Unbiased estimation of certain correlation coefficients. Ann Math Stat. 1958;29:201–11.https://doi.org/10.1214/aoms/ 1177706717.
24. Shay LA, Lafata JE. Where is the evidence? a systematic review of shared decision making and patient outcomes. Med Dec Making. 2014;35(1): 114–31.https://doi.org/10.1177/0272989x14551638.
25. Elwyn G, Frosch D, Thomson R, Joseph-Williams N, Lloyd A, Kinnersley P, Cording E, Tomson D, Dodd C, Rollnick S, Edwards A, Barry M. Shared decision making: A model for clinical practice. J Gen Intern Med. 2012;27(10):1361–7.https://doi.org/10.1007/s11606-012-2077-6. 26. Barr PJ, Elwyn G. Measurement challenges in shared decision making:
putting the ‘patient’ in patient-reported measures. Health Expect. 2015;19(5):993–1001.https://doi.org/10.1111/hex.12380. 27. Fitzpatrick R. Surveys of patients satisfaction: I–important general
considerations. Br Med J. 1991;302(6781):887.
28. Scholl I, Loon MK-v, Sepucha K, Elwyn G, Légaré F, Härter M, Dirmaier J. Zeitschrift für Evidenz, Fortbildung und Qualität im Gesundheitswesen. 2011;105(4):313–24.https://doi.org/10.1016/j.zefq.2011.04.012. 29. Dillon EC, Stults CD, Wilson C, Chuang J, Meehan A, Li M, Elwyn G,
Frosch DL, Yu E, Tai-Seale M. An evaluation of two interventions to enhance patient-physician communication using the observer OPTION5 measure of shared decision making. Patient Educ Couns. 2017;100(10): 1910–7.
30. Barr PJ, O’Malley AJ, Tsulukidze M, Gionfriddo MR, Montori V, Elwyn G. The psychometric properties of observer OPTION5, an observer measure of shared decision making. Patient Educ Couns. 2015;98(8):970–6.https:// doi.org/10.1016/j.pec.2015.04.010.
31. Elwyn G, Lloyd A, May C, van der Weijden T, Stiggelbout A, Edwards A, Frosch DL, Rapley T, Barr P, Walsh T, Grande SW, Montori V, Epstein R. Collaborative deliberation: A model for patient care. Patient Educ Couns. 2014;97(2):158–64.https://doi.org/10.1016/j.pec.2014.07.027.
32. Bartlett JW, Keogh RH. Bayesian correction for covariate measurement error: A frequentist evaluation and comparison with regression calibration. Stat Methods Med Res. 2014;0(0):0962280216667764.https:// doi.org/10.1177/0962280216667764.
33. Gelman A. Prior distributions for variance parameters in hierarchical models. Bayesian Anal. 2006;1:1–19.
34. R Core Team. R: A Language and Environment for Statistical Computing. Vienna, Austria: R Foundation for Statistical Computing; 2016.https:// www.R-project.org/.
35. Plummer M, et al. JAGS: A program for analysis of Bayesian graphical models using Gibbs sampling. In: Proceedings of the 3rd international workshop on distributed statistical computing, Vol. 124 no. 125.10. Vienna; 2003.
36. Plummer M. Rjags: Bayesian Graphical Models Using MCMC. 2016. R package version 4-6.https://CRAN.R-project.org/package=rjags. 37. Hess EP, Knoedler MA, Shah ND, Kline JA, Breslin M, Branda ME,
Pencille LJ, Asplin BR, Nestler DM, Sadosty AT, Stiell IG, Ting HH, Montori VM. The chest pain choice decision aid: A randomized trial. Circ Cardiovasc Qual Outcomes. 2012;5(3):251–9.https://doi.org/10.1161/ circoutcomes.111.964791.
38. Montori VM, Shah ND, Pencille LJ, Branda ME, Houten HKV, Swiglo BA, Kesman RL, Tulledge-Scheitel SM, Jaeger TM, Johnson RE, Bartel GA, Melton LJ, Wermers RA. Use of a decision aid to improve treatment decisions in osteoporosis: The osteoporosis choice randomized trial. Am J Med. 2011;124(6):549–56.https://doi.org/10.1016/j.amjmed.2011.01.013. 39. Revicki DA, Leidy NK, Brennan-Diemer F, Sorensen S, Togias A.
Integrating patient preferences into health outcomes assessment. Chest. 1998;114(4):998–1007.https://doi.org/10.1378/chest.114.4.998. 40. Fried TR, Bradley EH, Towle VR. J Gerontol Ser B Psychol Sci Soc Sci.
2002;57(6):348–54.
41. Munters LA, van Vollenhoven RF, Alexanderson H. Patient preference assessment reveals disease aspects not covered by recommended outcomes in polymyositis and dermatomyositis. ISRN Rheumatol. 2011;2011:1–5.https://doi.org/10.5402/2011/463124.
42. Giere RN. Bayesian statistics and biased procedures. Synthese. 1969;20(3): 371–87.