in the population sciences published by the Max Planck Institute for Demographic Research Konrad-Zuse Str. 1, D-18057 Rostock · GERMANY www.demographic-research.org
DEMOGRAPHIC RESEARCH
VOLUME 10, ARTICLE 1, PAGES 1-26
PUBLISHED 09 JANUARY 2004
www.demographic-research.org/Volumes/Vol10/1/
DOI: 10.4054/DemRes.2004.10.1
Descriptive Findings
Educational differentials in male
mortality in Russia and northern Europe.
A comparison of an epidemiological
cohort from Moscow and St. Petersburg
with the male populations of Helsinki and
Oslo
Vladimir M. Shkolnikov
Alexander D. Deev
Øystein Kravdal
Tapani Valkonen
1 Introduction 3
2 Data and methods 4
3 Results 11
4 Discussion 18
5 Acknowledgements 21
Notes 23
Descriptive Findings
Educational differentials in male mortality in Russia and northern
Europe. A comparison of an epidemiological cohort from Moscow
and St. Petersburg with the male populations of Helsinki and Oslo
Vladimir M. Shkolnikov1
Alexander D. Deev2
Øystein Kravdal3
Tapani Valkonen4
Abstract
Background
Prior estimates of the Russian mortality by socio-demographic group revealed significant differentials around the censuses of 1979 and 1989, but these studies were based on different sources of information on education for the deceased and the population at risk, leading to a potential numerator-denominator bias. To eliminate this problem, and to compare with the corresponding differentials in Nordic countries, an epidemiological cohort from Moscow and St. Petersburg is used for estimation of mortality in this study, along with similar register-based data from Helsinki and Oslo.
1
Corresponding author. Max Planck Institute for Demographic Research, Konrad-Zuse-Str. 1, Rostock D-18057, Germany. Email: [email protected]
2
State Centre for Preventive Medicine, Petroverigskiy per. 10, Moscow, 101990 Russian Federation 3
Cancer Registry of Norway and Department of Economics, University of Oslo, P.O. Box 1095, Blindern, N-0317 Oslo Norway. Email: [email protected]
4
Data and Methods
The Russian data include 7815 men from Moscow and St. Petersburg born in 1916-35 who participated in the Lipid Research Clinics (LRC) program, with a follow-up period from 1975 to 1997. Data with a similar structure, covering complete cohorts, were established for men born 1916-35 cohorts and living in Helsinki (1976-1995) and Oslo (1975-1991). Three educational categories were used: low (less than 10 years of schooling), middle (10 to 12 years) and high (13+ years).
Results
In the LRC cohort, mortality of men with high education is close to the city average for Helsinki and Oslo. Absolute inter-group differences are much greater in the Russian sample than in the two other populations. Differences in temporary life expectancies (40-74) between men with high and low education are 5.2, 3.5, and 3.2 years in the LRC cohort, Helsinki, and Oslo, respectively. Also relative differences are larger in the LRC cohort, although less markedly. Low/high education ratios of standardized death rates are 2.2, 2.0, and 1.9 in the three populations. Educational mortality differences measured by a relative index of inequality are 3.1, 2.7, and 2.6 (using the all-Russia educational distribution in the calculation for the LRC cohort) A similar pattern appears, of course, in Poisson regression models where it is controlled not only for age, but also calendar time. Consideration of causes of death shows that the larger relative difference between educational categories in the LRC cohort than in the Nordic capitals stems from particularly sharp gradients in mortality from cerebrovascular diseases and, more clearly, external causes. Whereas all-cause mortality has increased over time for men in the LRC cohort with low or middle education, there are indications that those with high education have not experienced an increase (i.e. differentials have increased). In contrast to this, the development in Oslo and Helsinki has been more favourable and more similar for the different educational groups.
Implications
1. Introduction
Mortality increased in Russia during most of the period after the mid-1960s (Shkolnikov, Meslé and Vallin, 1996). In the 1970s and 1980s, an upturn also took place in other countries of the former Soviet Union and, to a lesser extent, in the former communist countries of Central and Eastern Europe. A particularly steep decline was experienced in Russia after the disintegration of the Soviet Union and the beginning of market transformations in the 1990s. This unfavorable development contrasts markedly with the continuously decreasing mortality in western countries. In the early 1990s, it was especially the Russian men aged 20-65 who experienced very high death rates compared to previous years and compared to Western countries.
As in other countries, mortality in Russia is particularly high among people with low education, manual workers, and those who are not married (Shkolnikov et al., 1998; Shkolnikov, Andreev and Maleva, 2000). Specifically, the improvement in the mid-1980s seemed to be most pronounced for the better educated, who also experienced the weakest subsequent setback (Shkolnikov et al., 1998). This result is consistent with earlier findings by Carlson and colleagues (Carlson, 1989, Carlson and Tsvetarsky, 1992), which suggested that the mortality increase in Hungary and Bulgaria in the 1970s and 1980s was almost entirely restricted to the manual workers.
Knowledge on health inequalities, based on solid and internationally comparable evidence, is obviously of key importance for the understanding of the unprecedented health crisis faced by the Russian population. Unfortunately, existing estimates of educational and occupational differentials in Russian mortality are based on population structure data from the censuses of 1979 and 1989 (Note 1) and aggregate data from death certificates. Obviously, the self-reported information on social status given in a census may differ from that provided post mortem by a third party. In principle, this produces a so-called numerator-denominator bias (Vallin, 1979, Valkonen, 1993), although it is not necessarily large if fairly broad educational or occupational categories are used.
The objective of the present study is to compare educational differentials in male mortality in Russia with those in two western populations, the inhabitants of Helsinki (capital of Finland) and Oslo (capital of Norway). Individual follow-up data are used for all three populations to avoid the numerator-denominator bias. Such a comparison of Russian and western mortality based on individual data has never been carried out before.
contribute to producing social gradients in mortality (Dennis et al., 1993, Shestov et al., 1993, Shkolnikov, Andreev and Maleva, 2000). The Norwegian and Finnish data are from population registers linked with censuses, and cover roughly the same period. They include the entire male population in the relevant ages in the two capitals.
A few different techniques are used to assess the size of the educational differentials in the three populations, and check whether they have changed over time.
2. Data and methods
Data sources
Two Lipid Research Clinics were set up in Moscow and St. Petersburg (former Leningrad, renamed in 1991) as part of the US-USSR program for prevention of atherosclerosis in the 1970s. The goal was to measure blood concentrations of lipids and lipoproteins and check various other risk factors for cardiovascular diseases, as well as giving health advice to patients. A cohort of men born in 1916-35 (aged 40-59 in 1975) was randomly selected from the voting lists of 1974 for one supposedly typical residential district in each of the two cities (Oktyabrskiy district in Moscow and Petrogradsky district in St. Petersburg). This cohort closely resembles the populations in the two cities, in terms of age and socio-occupational structure. 7815 men (from 10034 pre-selected) were medically tested and interviewed in 1975-77 according to the North American LRC Prevalence Study Protocol (3908 in Moscow and 3907 in St Petersburg).
During the years 1975-1994 deaths were added to the data as part of the LRC research program (US-USSR Steering Committee, 1977), and in 1994-1997 deaths were added to the data as a part of the framework of the Global Health Equity Initiative (Evans et al., 2001). During this 22-year period, 3462 deaths (or 44% of the initial cohort size) were recorded and 361 subjects (3%) were lost from observation.
The structure of the LRC data under study is illustrated in a Lexis diagram (Figure 1). From these data, number of events (deaths of a few different main causes) and exposure time are calculated for each combination of year, age and education.
In Finland and Norway, each resident has a personal identification number that is used in censuses as well as various population registers. This makes it possible to establish individual biographies for complete national birth cohorts, including the date of death, if any (as well as information on births, marriages, educational careers, and migration).
monthly data on place of residence), it was possible to count only the exposure and deaths in the municipality of Oslo. The data cover the years 1975-1991, i.e. few years less than the LRC cohort. Educational level refers to the 1970 census (for the years 1975-79) or the 1980 census (for the years 1980-91). The Finnish data include all men born in 1916-35 who lived in Helsinki Metropolitan area in 1975 and cover the years up to 1995. Educational level refers to the 1975 census. Thus, the structure of the data from these two cities is as for the LRC cohort, except for a slightly shorter follow-up periods.
Figure 1: Region of observations of the LRC data set in the Lexis diagram. For the
Helsinki data set follow-up period lasts from 1976 to 1995, for the Oslo data set follow-up period lasts from 1975 to 1991.
Educational distribution
The number of years of completed education is important for the individual’s general health knowledge, wage potential, type of job (and thus occupational hazards) and the personal network. The latter could be especially important in Russia, where social capital has been shown to be important for many people for meeting their
84 83 82 81 80 79 78 77 76 75 74 73 72 71 70 69 68 67 66 65 64 63 62 61 60 59 58 57 56 55 54 53 52 51 50 49 48 47 46 45 44 43 42 41 40
personal needs for public and private services (Rose, 2000). These general factors are in turn determinants of various risk factors such as smoking, alcohol, diet, physical activity, and frequency of medical check-ups.
In all three populations, three categories of education are defined: low (less than secondary education with 9 or less years of schooling), middle (secondary education with 10 to 12 years of schooling) and high (tertiary or university education with 13 or more years of schooling).
Broadly speaking, the three categories of education determine in each country lower, medium, and upper part of the educational spectrum. Although the educational categories are similar in terms of years of schooling, one can not claim that they are exactly the same in the three countries in respect to content of educational programmes, amounts of knowledge gained, corresponding ranges of occupations, incomes, and social statuses. In the present study, we will use indices of inequality as a means to avoid major problems of inter-country incomparability of educational categories. In particular, regression-based indices of inequality, such as relative index of inequality and slope index of inequality, allow comparable measurements of the magnitudes of educational differentials even if the cut points in the educational scale are not the same among countries.
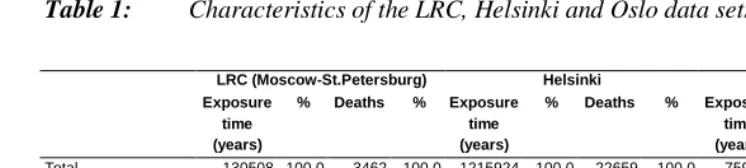
Table 1 provides brief information about the data. The Helsinki data include 1216 thousand person-years at risk and about 23 thousand deaths, the Oslo data include 760 thousand person-years at risk and 12 thousand deaths, and the LRC data include 131 thousand person-years at risk and about 3.5 thousand deaths.
Table 1: Characteristics of the LRC, Helsinki and Oslo data sets.
LRC (Moscow-St.Petersburg) Helsinki Oslo Exposure
time (years)
% Deaths % Exposure time (years)
% Deaths % Exposure time (years)
% Deaths %
Total 130508 100.0 3462 100.0 1215924 100.0 22659 100.0 759728 100.00 12276 100.0 Education
9 years or less (low) 50349 38.5 1797 51.9 701282 57.7 15341 67.7 349312 46.0 7043 57.4 10-12 years (middle) 33337 26.6 851 24.6 289508 23.8 4670 20.6 255625 33.6 3681 30.0 13+ (high) 46821 35.9 814 23.5 225134 18.5 2648 11.7 154790 20.4 1552 12.6
National mortality trends
As elaborated on below, both absolute and relative mortality differentials are estimated for the three data sets. As a backdrop for the discussion of these results, the trends in period life expectancy of men at birth, and within the age range 40- 74 (Note 2), are shown in Figure 2.
30 35 40 45 50 55 60 65 70 75 80
1950 1955 1960 1965 1970 1975 1980 1985 1990 1995 2000 Ye a r
L if e exp ec ta n c y , i n y ear s
Finland Norway Russ ia-rec ons tr. Rus sia e(0) 10 15 20 25 30 35 40
1950 1955 1960 1965 1970 1975 1980 1985 1990 1995 2000 Yea r L if e exp ec ta n c y , i n y ear s
Finland Norway Rus sia-rec ons tr. Rus sia e(40-74)
Figure 2: Trends in male life expectancies at birth and within the range of ages
40-74 in Russia, Finland and Norway in 1950-2000.
Sources. 1950-64: reconstructed data for Russia from Andreev, Kharkova and Darsky, 1992; 1965-2000: data for Russia was calculated by us from the Goskomstat’s original statistical tables “forma C51”; 1951(2)-1998: data for Finland and Norway was computed by us from the WHO, 2002.
National representativity
Mortality of middle-aged men in Moscow and St. Petersburg in 1975-1997 was somewhat lower than the national average, largely because of a lower mortality from accidents and violence (Shkolnikov, Andreev and Maleva, 2000). However, the trends for the capital cities do not differ considerably from those for national populations, except that the mortality decrease in the second half of the 1980s was less pronounced in Moscow and St. Petersburg than in other parts of Russia, while the subsequent deterioration in the 1990s was very significant (Shkolnikov and Cornia, 2000).
As an illustration of the difference between the mortality in the LRC cohort and that in the entire Russian population, death rates are estimated for men aged 65-69 in 1989-96. These rates are: 4892 per 100,000 for Russia as a whole, 4756 per 100,000 for the total population of Moscow and St. Petersburg, and 4734 (324) (Note 3) for the LRC cohort. In comparison, the corresponding death rate in Finland was 3100 per 100,000.
Although mortality in Moscow and St. Petersburg is somewhat lower than the national pattern, this difference is small compared with the great gap between Russia and the West.
mortality from ischeamic heart disease lower ( Koskinen and Martelin 1998). Mortality in Oslo in 1975-91 was somewhat higher than the country average (Statistics Norway 2002).
Methods
In the first part of the analysis, all-cause death rates grouped by age and education are used as building stones in the computation of life expectancies and age-standardized death rates (SDR). The computations are done separately for each of the three educational categories. The age- and education-specific death rates are estimated as the ratio of the number of deaths in the relevant age and education group to the corresponding exposure time (assuming a constant death rate within this interval). These events and exposure times are easily produced from the matrices described above by summing over year and (for the events) cause of death. In other words, when we suppress the educational dimension and consider only all-cause mortality, the death rates at age x are calculated as Dx / Ex where
å å
+= t i it
x d x x n
D ( , ), =
å å
+t i it
x x x n
E τ ( , ), (1)
and dit(x, x+n) = 1 if an individual i dies between exact ages x and x+n in calendar year
t and dit(x, x+n) = 0 otherwise;
τ
it(x, x+n) is the amount of time (in years) lived by anindividual i between exact ages x and x+n in the calendar year t (n=1 or 5 dependent on whether one- or five-year age groups are used). This is occasionally called the “person years” approach (Kahn and Sempos, 1989).
Of course, the rates at the oldest ages reflect mortality during the last years of the period under analysis, whereas the opposite is the case for the youngest ages. For example, deaths at ages 40-49 take place in 1975-84, and deaths at ages 70-74 in 1985-97. This means that the differences across age are confounded by period changes. Special techniques have been developed to take such confounding into account, but preliminary analyses showed that the use of such techniques have no influence on the estimates of educational differences in mortality. Therefore, life expectancies and age-standardized death rates (based on the European population standard) for ages 40-74 are computed in a conventional way.
educational differentials: relative and absolute indices of dissimilarity, and regression-based relative and absolute indices of inequality (Kunst and Mackenbach, 1994, Mackenbach and Kunst, 1997).
These indices of inequality express inter-group mortality differentials in a compact form and facilitate the comparison between countries.
The absolute index of dissimilarity can be interpreted as the amount of deaths that should be redistributed among groups in order to reach the equal mortality at the total population’s level. The relative index of dissimilarity is equal to the absolute ID divided by the total population’s mortality rate.
å
= ⋅ − = 3 1 | | k k kabs SDR SDR
ID θ , (2a)
SDR ID
IDrel= abs/ , (2b)
where k is the educational group (numbered from 1 to 3),
θ
k is the population weight of the educational group k, and SDRk and SDR are age-standardized death rates in thek-th educational group and in the overall population, respectively.
The relative index of inequality (RII) and slope index of inequality (SII) are based on the least square regression of mortality rates in educational groups on levels of education, taking into account their population weights. These indices express relative (RII) and absolute (SII) gaps in mortality between the “best” and the “worst” individuals in population. The baseline assumption is that mortality changes linearly across individuals ranked by education.
Let 2 / , 2 / , 2
/ 2 1 2 3 1 2 3
1
1=θ p =θ +θ p =θ +θ +θ
p and p b a p
SDR( )= + ⋅
be the linear least square regression built on the three points (p1, SDR1), (p2, SDR2), and (p3,SDR3). The indices are defined as:
b SDR SDR
SII= (1)− (0)= , (3a)
. / ) ( ) 0 ( / ) 1
( SDR a b a
SDR
RII = = + (3b)
In the second part of the analysis, possible differences between the educational categories in the period of observation are controlled for. This is done by estimating the simple Poisson model
) (
, , , ,
k t x year educ
age k t x k t
x
E
e
D
=
⋅
+ + , (4)where
age
x,
year
t,
educ
k are dummy variables corresponding to age group x (5-year age intervals), calendar period t (5-year calendar periods) and educational level k (three categories),D
x,t,k andE
x,t,k are the numbers of deaths and person-years in respectivecells of the region of observations (in analogy with the notation in (1)). The SDR ratios described above correspond to the education effects in this model when period is left out.
The control for period is particularly important in the analysis of cause-specific mortality, not least because of temporal changes in registration of causes. When different causes of death are considered, only the Poisson regression technique is used.
To assess the changes over time in the educational gradients, interactions between education and period are included. As part of this discussion, some attention is also devoted to education-age interactions.
The analysis is done with the STATA6 statistical package (STATA Corp, 1999).
3. Results
Life expectancies and SDRs
Life expectancies between ages 40 and 75 are shown in Table 2. The lowest average is found in the LRC cohort (27 years, reduced to 26 years if the educational distribution for the entire Russian population is used) and the highest in Oslo (29 years). However, the differences are largest in the LRC cohort, where the life expectancy among men with low education is 5.2 years higher than among those with high education. The corresponding differences in Helsinki and Oslo are 3.5 and 3.2 years, respectively.
The life expectancy for the highly educated in the LRC cohort is close to that in the middle education group, and in the total populations, in the two Nordic capitals.
difference of 1.4-2 years also among men with high education. However, the differences among the men with low education are as large as 3.0-3.9 years.
Table 2: Life expectancy between exact ages 40 and 75 by level of education in
three male cohorts: LRC (Moscow-St. Petersburg), Helsinki and Oslo. (in years)
Low Middle High Total
LRC 24.3 27.4 29.4 26.8/25.8**
(0.6)* (0.4) (0.6) (0.4)
Helsinki 27.3 29.1 30.8 28.3
(0.2) (0.2) (0.2) (0.1)
Oslo 28.2 29.8 31.4 29.3
(0.2) (0.2) (0.2) (0.1) Differences from the groups of high education
LRC 5.2 2.1 0.0 2.7/3.2
Helsinki 3.5 1.7 0.0 2.5
Oslo 3.2 1.6 0.0 2.1
Differences from Oslo
LRC 3.9 2.4 2.0 2.5/3.5**
Helsinki 0.9 0.7 0.6 1.0
Oslo 0.0 0.0 0.0 0.0
Notes:
* Doubled standard errors are given in brackets
** Actual value for the LRC cohort / expected value with the all-Russia educational composition
Similar patterns appear in the SDRs in Table 3. Whereas the absolute difference in SDR between men with high and men with low education is much higher in the LRC cohort than in the two Nordic capitals, the LRC-Nordic difference is less significant in relative scale, because of the much higher overall mortality in the LRC cohort. Men with low education in the LRC cohort have an SDR that is 2.2. times higher than that among men with high education. The corresponding ratios are smaller in Helsinki and Oslo (2.0 and 1.9, respectively), but not very markedly.
The relative SDRs are, of course, virtually identical to estimates from Possion regression models where period is left out (not shown). When period is included, the estimates are also very similar (see illustration of all-cause mortality in Figure 1).
only slightly higher for the low education group than for the high education group. While it is true that highly educated men in Moscow and St. Petersburg do enjoy unusually low mortality by Russian standards, their position is indeed unfavorable compared with men at the same level of education in Helsinki and Oslo.
Table 3: Age-standardized* death rates for the range of ages 40 to 74 by level of
education in three male cohorts: LRC (Moscow-St. Petersburg), Helsinki and Oslo. (per 100,000 person-years)
Low Middle High Total
LRC 2969 2019 1346 2194/2491***
(192)** (151) (110) (82)
Helsinki 1905 1405 974 1614
(36) (44) (44) (24)
Oslo 1731 1270 890 1407
(48) (48) (50) (28)
Ratios to the SDRs of the high education group
LRC 2.2 1.5 1.0 1.6/1.7
Helsinki 2.0 1.4 1.0 1.7
Oslo 1.9 1.4 1.0 1.6
Ratios to the SDRs of Oslo
LRC 1.7 1.6 1.5 1.4/1.6
Helsinki 1.1 1.1 1.1 1.1
Oslo 1.0 1.0 1.0 1.0
Notes:
* European population standard of the WHO is used ** Doubled standard errors are given in brackets
*** Actual value for the LRC cohort / expected value with the all-Russia educational composition
Indices of dissimilarity and inequality
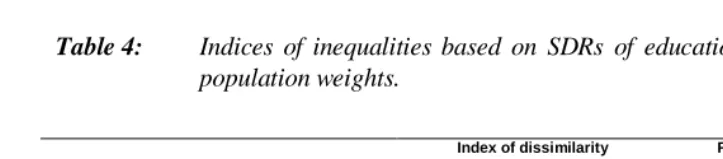
Whereas one figure for men with low education and one for those with middle education are shown for each country in Tables 2 and 3, one single index of dissimilarity (absolute or relative) is shown in table 4. Indices of inequality are given as alternative measures.
As expected, the absolute index of dissimilarity (ID) is much higher in the LRC cohort than in the populations of Helsinki or Oslo. Relative ID is also high for the LRC cohort, but it diminishes from 29% to 23% if the all-Russia educational distribution is used. The latter figure is still little higher than 21% observed in Helsinki and Oslo.
Oslo.) There are three bars in each panel. The width of each bar corresponds to the population-weight of the respective educational group and its height corresponds to the SDR. A regression line connects the “worst” (left end of the regression line) and the “best” (right-end) individuals. RII is the ratio of the “worst” to the “best” mortality rates, and SII is the absolute difference between them.
Once again, the absolute inequality, as expressed by SII, is much greater in the LRC cohort than those in the populations of Helsinki or Oslo (about 2500 per 100,000
vs. 1200-1500 per 100,000). Similarly, the relative inequality, as expressed by RII, is
highest in the LRC cohort (3.8, reduced to 3.1 if the educational distribution for Russia is used, compared with 2.6-2.7 in Helsinki and Oslo).
Table 4: Indices of inequalities based on SDRs of educational groups and their
population weights.
Index of dissimilarity (ID)
Regression-based indices
Relative (%) Absolute (per 100000)
Relative index of inequality (RII)
(times)
Slope index of inequality (SII)
(%)
LRC 29.6 636 3.8 2587
LRC with the all-Russia educational composition 23.2 583 3.1 2530
Helsinki 20.8 336 2.7 1467
500 1000 1500 2000 2500 3000 3500 4000 0 100 0 0 200 0 0 300 0 0 400 0 0 500 0 0 600 0 0 700 0 0 800 0 0 900 0 0 10000 0
Propor tion in the over all population of 100000
A g e-st an d a rd iz ed d eat h r a te , p e
r 100 000
Low Middle High Regression line LRC, Moscow -St.Petersburg SII = 2587/100000 RII = 3.8
500 1000 1500 2000 2500 3000 3500 0
10000 20000 30000 40000 50000 60000 70000 80000 90000 100000 Pr opor tion in the over all population of 100 000
A g e-st an d a rd iz ed d e at h r a te , p e r 100 000
Low Middle High Regression line Oslo SII = 1251/100000 RII = 2.6 500 1000 1500 2000 2500 3000 3500 0
10000 20000 30000 40000 50000 60000 70000 80000 90000
100000
Pr oportion in the ove rall population of 100 000
A g e-st an d a rd iz ed d eat h r a te , p e
r 100 000
Low Middle High Regression line Helsinki SII = 1467/100000 RII = 2.7
500 1000 1500 2000 2500 3000 3500 4000 0
10000 20000 30000 40000 50000 60000 70000 80000 90000
100000
Propor tion in the over all population of 100000
A g e -st an d a rd iz ed d e at h r a te , p e r 100000
Low Middle High Regression line LRC, Moscow -St.Petersburg w ith all-Russia educational structure SII = 2530/100000 RII = 3.1
Figure 3: Construction of the regression-based slope index of inequality (SII) and
relative index of inequality (RII): LRC cohort, LRC cohort with the all-Russia educational composition, Helsinki, and Oslo.
Cause-specific educational differences
Other studies have shown that much of the difference in mortality between highly and poorly educated men in Russia is due to the high mortality from cardiovascular diseases in the latter group and, to a lesser extent, cancers and external causes of death (Shkolnikov et al., 1998). It is now checked whether these causes also lie behind the larger educational gradients in the LRC than in the populations of the two Nordic capitals. Four major causes of death are considered: coronary heart disease, cerebrovascular disorders, smoking-related cancers (cancers of lung, bronchus, lips, oral cavity, pharynx, and esophagus), and accidents and violence. The educational differences shown in Figure 4 are from Poisson regression models. Men with high education are the reference category, and their mortality from the cause in focus is set to 1.
cancers is very much lower among men with high education than among those with low education (ratios of 0.25-0.30).
The slightly sharper educational gradient that appears for all-cause mortality in the LRC cohort than in the other cohorts in Figure 4 (in accordance with the higher SDR ratio in Table 3), is otherwise only seen for cerebrovascular diseases (significant only when comparing LRC and Helsinki) and, more sharply, for accidents and violence. Interestingly, in the LRC cohort, men with middle education experience mortality from external causes very close to that among men with low education. In Helsinki and Oslo, however, the major divide is between those with low and those with middle education. In these cities, accident and violence mortality in the latter group is much lower than that in the former group (rate ratios are 0.6-0.7 vs. 0.9 in Russia).
Figure 4: Effects of education on mortality from major causes of death in the LRC
cohort, Helsinki and Oslo male cohorts: Poisson regression rate ratios.
0.00 0.25 0.50 0.75 1.00
All ca u s e s C H D C e re b ro va s c u la r C a n ce rs /s m o king Acc id e n ts /Vio le n ce
R
a
te
ra
tio
Low M iddle High
LRC
0.00 0.25 0.50 0.75 1.00
All ca u s e s C H D C e re b ro va s c u la r C a n ce rs /s m o king Acc id e n ts /Vio le n ce
R
a
te
ra
tio
Low M iddle High
Helsinki
0.00 0.25 0.50 0.75 1.00
All ca u s e s C H D C e re b ro va s c u la r C a n ce rs /s m o king Acc id e n ts /Vio le n ce
R
a
te
r
a
tio
Interactions of education effects with age and calendar period in Poisson regression models for all-cause mortality
According to likelihood ratio tests, the first-order interactions involving education (education*age and education*time) do not improve the model fit significantly for the LRC cohort. However, in terms of point estimates there is a quite clear pattern in the interaction effects that nevertheless deserves some attention. In addition, the interaction effects are significant for Helsinki and Oslo.
The educational differentials tend to decrease with age. In the LRC cohort, as well as for Helsinki and Oslo, the mortality rate ratio for the group with high education increases from about 0.3-0.4 at age 40-49 to about 0.5-0.6 at age 70-74. This pattern fits well with the general pattern of relative inequality in mortality with maximum around age 35-45 and further decline with age. This pattern has been reported since very early studies of social differentials in mortality long time ago (Antonovsky, 1967).
The interactions between education and period are shown in Figure 5. In the LRC cohort (upper left panel), the mortality rate ratios increase from 1978-82 (taken as baseline = 1) to 1993-97 for low and middle levels of education, and do not increase for high education. These (insignificant) trends are consistent with previous population-level studies (that were possibly hampered by numerator-denominator bias) showing that the mortality increase has been most pronounced for the lower social classes (Shkolnikov et al., 1998, Shkolnikov, Andreev and Maleva, 2000). This is, of course, the same as claiming that the educational differentials have widened.
Recently, a similar result was obtained in another individual-level study by comparison of mortality in the St. Petersburg part of the LRC cohort traced from 1975 with another cohort traced from 1986 (Plavinski, Plavinskaya, Klimov, 2003).
In contrast to this, mortality is significantly declining from 1976-80 to 1991-95 in all educational groups in the Helsinki population, although most steeply among men with high education. This is also consistent with the results of earlier studies for the whole country (Valkonen et al., 1993). In Oslo, mortality has changed little among men with low and middle education and declined for those with high education. Thus, the educational differences have increased in both Nordic capitals.
Figure 5: Effects of calendar period by level of education in the LRC, Helsinki and Oslo cohorts: Poisson regression rate ratios.
4. Discussion
The present study provides the most accurate Russia-West comparison of mortality by educational level published so far. On the Russian side, the estimates are based on information about educational attainment of members of an epidemiological cohort in 1975 and data on their mortality during the following 22 years. This is a better design than in most previous studies, which have been based on independent data sources on education of deceased and education of population at risk (Shkolnikov et al., 1998). Similar data covering the same periods and years were established for the entire male populations of Helsinki and Oslo, using population registers linked with censuses. The educational categories were defined very similarly in the three data sets, to make the
0.50 0.75 1.00 1.25 1.50 1.75
Total Low Middle High
Education
R
a
te
r
a
ti
o
1978-82 1983-87 1988-92 1993-97
LRC
0.50 0.75 1.00 1.25 1.50 1.75
Total Low Middle High
Education
R
a
te
r
a
ti
o
1976-80 1981-85 1986-90 1991-95
Helsinki
0.50 0.75 1.00 1.25 1.50 1.75
Total Low Middle High
Education
R
a
te
r
a
ti
o
1975-79 1980-84 1985-91
effects as comparable as possible (Note 4). The fact that the educational level in 1975 is used in the LRC cohort and the Helsinki population, whereas the data from Oslo include education in 1970 or 1980, should be of no concern. The educational careers of the subjects had been largely completed by 1970 (when they were 39-54 years) anyway. Lack of representativity is a potential problem. The LRC cohort has a distribution over age, education and socio-occupational categories that is very similar to that in the entire populations of Moscow and St. Petersburg in 1975. However, the sample was drawn randomly from populations of only one typical district in each city and could miss certain peculiarities in mortality, characteristic of other districts. Moreover, the LRC cohort (as any other epidemiological cohort) could hardly include homeless people and other "marginal" groups (Note 5).
Nevertheless, the mortality pattern in the LRC cohort was found to be very close to that in the total male populations of Moscow and St. Petersburg. Moreover, the mortality differences between the LRC cohort, Moscow and St. Petersburg, and Russia are very small compared to the large mortality gap between Russia and the Nordic countries. In addition, in calculations of mortality and inequality measures we made adjustments for compositional effects connected with the educational advantage of Moscow and St. Petersburg compared to the whole of Russia.
The data sets from Helsinki and Oslo cover the whole male population and are less problematic in this respect. The implication of this is probably that the mortality in the low-education group could be somewhat underestimated in the LRC cohort, and more so than in the Norwegian and Finnish populations.
Another potential problem is connected with comparability of educational categories across countries. In spite of similar numbers of years of schooling, relative distances between groups of high, middle, and low education in terms of amounts of, for example, knowledge and job opportunities may not be the same in different countries. Our use of regression-based indices of inequality mitigates this problem since these measures are relatively insensitive to categorization as long as the order of groups is correct.
Generally, schooling has consequences for people’s income, exposure to occupational hazards, social networks and many other factors, and these consequences are likely to differ across countries. Similarly, their impact on mortality may differ substantially. Besides, there may be inter-country variations in the extent to which educational careers reflect resources and attitudes in the family of origin and childhood factors. In this study, we make no attempt to identify any causal channels, but merely describe the educational mortality differences.
Finally, the small size of the LRC cohort (about 8000 men) is an important limitation leading to wide confidence intervals. Moreover, the youngest subjects in all three cohorts were aged 40 in 1975. This means that we entirely miss mortality experience at younger working ages, where relative social differentials in mortality are especially large.
The main conclusion is that educational gradients in mortality are sharper in the LRC cohort than in the populations of Helsinki and Oslo. This appears particularly clearly when absolute differences in life expectancy are considered, but there is a similar pattern in age-standardized mortality rate ratios and various indices of relative inequality. However, the difference in average mortality between the populations is not due only to the large difference in the lower social classes. Also the better educated in the LRC cohort have a much higher mortality than their counterparts in Helsinki and Oslo.
The sharper educational differentials in the LRC cohort stem from a particularly high mortality from cerebrovascular disorders among the men with low education, as well as a high rate of external mortality. The educational gradients are particularly sharp for the latter. In contrast to this, the differentials in the mortality from coronary heart diseases and smoke-related cancers are no more pronounced than in Helsinki and Oslo. This may reflect that, in spite of differences in societal contexts, there is a similarity in concrete risk factors underlying educational gradients in mortality, such as smoking, alcoholism, poor quality of nutrition, lack of attention to own health, and inequalities in access to advanced medical care. These risk factors are related not only to the incidence of diseases but also to survival after getting ill. For example, there are large educational differences in cancer survival even in Norway, with a supposedly egalitarian health care system, and one cannot rule out the possibility that this is partly due to differentials in access to, or ability to make use of, medical treatment (Kravdal, 2000).
how the educational differentials would be at a national level compared to those estimated in this study.
The sharper educational gradients in Russia may perhaps be considered striking, given the strong political rhetoric about egalitarianism during most of the follow-up period. More specifically, there has been a much weaker link between education and income in Russia than in western countries. However, education effects surely signal much more than differences in purchasing power (Ross and Mirowski, 1999). In Russia, it may well be that, for example, knowledge, behaviors, and social networks contribute more than factors more directly linked with purchasing power to the overall mortality gap between high and low educational groups.
The estimates from the LRC cohort indicate an increasing mortality among those with low and middle education, especially after about 1990, as opposed to absence of an increase or even a decline in the high-education group, and thus widening differentials. A similar result has been reported also in previous population-level studies, but it is important to see the pattern confirmed, because these earlier studies were based on independent data sources on education of deceased and education of population at risk.
Educational differentials seem to have increased also in the two Nordic capitals, but less markedly. At least, all groups have experienced stable or decreasing mortality.
The widening mortality differentials in Russia, indicated now also by the LRC results, may to a large extent be a result of abrupt and ill-governed economic transformations that have created escalating income inequalities (UNDP, 1999). This worrying tendency should find an adequate response in public health policies. On the scientific side, trends in inequalities in health in the Russian population require careful monitoring and further analyses.
5. Acknowledgements
The study was supported by the Max Planck Institute for Demographic Research (Rostock, Germany).
Collection of the LRC data for the period of 1994-97 was supported by the Rockefeller Foundation within the framework of the Global Health Equity Initiative.
The study was supported by funding from the Academy of Finland (project 51640). We thank Statistics Finland for permission (TK 53-1783-96) to use the data for Finland.
Notes
1. There are a few studies employing proportional analysis of mortality by cause of death for an indirect estimation of social differentials in mortality without data on population at risk (Chenet et al., 1998).
2. Temporary life expectancy within the range of ages 40 to 74 is defined in terms of standard life table functions as 35e40 =(T40−T75)/l40.
3. Doubled standard error is given in brackets.
4. For a detailed comparison of the Russian and the Finnish educational systems see also Palosuo et al., 1995.
References
Andreev, E., Darsky, E. and Kharkova, T. (1992). L'histoire de la population de l'URSS. 1920-1959. Serie: Annales de demographie historique. Paris, 65-150.
Antonovsky, A. (1967). Social class, life expectancy and overall mortality. Milbank Memorial Fund Quarterly 43, 31-73.
Avdeev, A., Blum, A., Zakharov, S., Andreev, E. (1998). The reactions of a heterogeneous population to pertubation. An interpretative model of mortality trends in Russia. Population: An English Selection, 10(2), 267- 302
Carlson, E. (1989). Concentration of rising Hungarian mortality among manual workers. Sociology and Social Research, 73(3), 119-128
Carlson, E. and Tsvetarsky, S. (1992). Concentration of rising Bulgarian mortality among manual workers. Sociology and Social Research, 76(2), 81-84
Chenet, L., Leon, D., Mckee, M., Vassin, S. (1998). Deaths from alcohol and violence in Moscow: socio-economic determinants. European Journal of Population, 14, 19-37
Dennis, B.H., Zhukovsky, G.S., Shestov, D.B., Davis, C.E., et al. (1993) The association of education with coronary heart disease mortality in the USSR Lipid Research Clinics Study. International Journal of Epidemiology, 22, 420-427.
Interstate Statisrtical Committee of CIS. (1996). Results of the 1989 All-Union Population Census. CD-ROM.
Kahn, H.A., Sempos, C.T. (1989). Statistical methods in epidemiology. Oxford University Press, New York-Oxford
Koskinen, S. and Martelin T. (1998). Viina tappaa keski-ikäisiä päääkaupunkiseudulla (Alcohol kills middle-aged people in the Helsinki region). Kuntapuntari, 2, 66-71
Kravdal, Ø. (2000). Social inequalities in cancer survival. Population Studies 54, 1-18.
Kunst, A.E. and Mackenbach, J.P. (1994). Measuring socio-economic inequalities in health. WHO Regional Office for Europe, Copenhagen
Palosuo, H., Zhuravleva, I., Uutela, A., Lakomova, N., Shilova, L. (1995). Perceived Health, Health-Related Habits and Attitudes in Helsinki and Moscow: a Comparative Study of Adult Populations in 1991. Publication of the National Health Institute: A10, Helsinki
Plavinski, S.L., Plavinskaya, S.I., Klimov, A.N. (2003). Social factors and increase in mortality in Russia in the 1990s: prospective cohort study. British Medical Journal, 326, 1240-1242.
Rose, R. (2000). How much does social capital add to individual health? A survey study of Russians. Social Science and Medicine, 51, 1421-1435.
Ross, C.E. and J. Mirowski. (1999). Refining the association between education and health: The effects of quantity, credential, and selectivity. Demography, 36, 445-460.
Shestov, D.B., Deev, A.D., Klimov, A.N., Davis, C.E., et al. (1993). Increased risk of coronary heart disease death in men with low total and low-density lipoprotein cholesterol in the Russian Lipid Research Clinics prevalence follow-up study. Circulation, 88, 846-853.
Shkolnikov, V., Meslé F. and Vallin, J. (1996). Health crisis in Russia. Population: An English Selection, 8, 123-190
Shkolnikov, V.M., Andreev, E.M., Maleva, T. ed. (2000). Neravenstvo i smertnost v Rossii. [Inequality and Mortality in Russia] “Signal”, Moscow.
Shkolnikov V.M., McKee M., Leon D.A. (2001). Changes in life expectancy in Russia in the mid-1990s. Lancet, Vol. 357, March, pp. 917-921.
Shkolnikov, V.M., Leon, D.A., Adamets; S., Andreev, E., Deev, A. (1998). Educational level and adult mortality in Russia: an analysis of routine data 1979 to 1994. Social Science Medicine, 47(3), 357-369
STATA Corp. (1999). Stata Statistical Software: Release 6.0. College Station, Texas: Stata Corporation.
Statistics Norway (2002). Mortality statistics at http://www.ssb.no/english/subjects/ 02/02/10/dode_en/tab-2002-06-27-11-en.html last visited in August 2002.
US-USSR Steering Committee for Problem Area 1. (1977). The pathogenesis of atherosclerosis: collaborative US-USSR study on the prevalence of dyslipoproteinemia and ischeamic heart disease in American and Soviet populations. American Journal of Cardiology, 40, 260-268.
Valkonen, T. (1993). Problems in the measurements and international comparisons of socio-economic differences in mortality. Social Science and Medicine, 36(4), 409-418
Valkonen, T., Martelin, T., Rimpelä, A., Notkola, V. and Savela, S. (1993) Socio-economic mortality differences in Finland 1981-1990. Statistics Finland, Population 1993:1
Vallin J. (1979). Socioeconomic determinants of mortality in industrialised countries. Readings in Population Research Methodology, 2, 957-971