DEMOGRAPHIC RESEARCH
VOLUME 31, ARTICLE 40, PAGES 1229
−
1242
PUBLISHED 20 NOVEMBER 2014
http://www.demographic-research.org/Volumes/Vol31/40/ DOI: 10.4054/DemRes.2014.31.40
Descriptive Finding
Pregnancy scares and subsequent unintended
pregnancy
Heather H. Gatny
Yasamin Kusunoki
Jennifer S. Barber
© 2014 Gatny, Kusunoki & Barber.
This open-access work is published under the terms of the Creative Commons Attribution NonCommercial License 2.0 Germany, which permits use, reproduction & distribution in any medium for non-commercial purposes, provided the original author(s) and source are given credit.
1 Introduction 1230
2 Methods 1231
2.1 Measures 1232
2.2 Data analysis 1234
3 Results 1234
3.1 Characteristics of respondents who had a pregnancy scare 1234 3.2 Multivariate models of experiencing a pregnancy scare 1235 3.3 Multivariate models of the hazard of experiencing an unintended
pregnancy
1237
4 Discussion 1239
5 Conclusions 1240
6 Acknowledgements 1241
Pregnancy scares and subsequent unintended pregnancy
1Heather H. Gatny2
Yasamin Kusunoki3
Jennifer S. Barber4
Abstract
BACKGROUND
A substantial number of young women experience pregnancy scares – thinking they might be pregnant, and later discovering that they are not. Although pregnancy scares are distressing events, little is known about who experiences them and whether they are important to our understanding of unintended pregnancy.
OBJECTIVE
We describe the young women who experience pregnancy scares, and examine the link between pregnancy scares and subsequent unintended pregnancy.
METHODS
We used data from the Relationship Dynamics and Social Life Study. T-tests and regression analyses were conducted using baseline and weekly data to estimate relationships between respondent characteristics and subsequent pregnancy scares. Event history methods were used to assess pregnancy scares as a predictor of unintended pregnancy.
RESULTS
Nine percent of the young women experienced a pregnancy scare during the study. African-American race, lack of two-parent family structure, lower GPA, cohabitation, and sex without birth control prior to the study are associated with experiencing a pregnancy scare and with experiencing a greater number of pregnancy scares. Further, experiencing a pregnancy scare is strongly associated with subsequent unintended pregnancy, independent of background factors. Forty percent of the women who experienced a pregnancy scare subsequently had an unintended pregnancy during the study period, relative to only 11% of those who did not experience a pregnancy scare.
1 Paper presented at Session #74, “Contraception: The Determinants of Choice,” at the Annual Meeting of the
Population Association of America, March 31‒April 2, 2011, Washington, DC, U.S.A.
2 University of Michigan, U.S.A., Survey Research Center, Institute for Social Research, 426 Thompson St.,
Room 2252, Ann Arbor, MI, 48106-1248. E-Mail: [email protected].
CONCLUSIONS
Young women from less advantaged backgrounds are more likely to experience a pregnancy scare, and pregnancy scares are often followed by an unintended pregnancy.
1. Introduction
In the United States, the term ‘pregnancy scare’ describes when a woman who wants to avoid pregnancy believes she is pregnant, but later learns that she is not. For example, as one respondent (who didnotdesire a pregnancy) told us shortly after her pregnancy scare, “I thought there could have been a chance that I was pregnant but it turned out that I wasn’t, so I am very thankful for that.” Many respondents reported, “I missed this month’s period,” or “My period started seven days late” to explain why they temporarily thought they were pregnant.
Pregnancy scares are common – over half of the young women (54%) who participated in a recent survey conducted by the National Campaign to Prevent Teen and Unplanned Pregnancy (2013) reported that they had had a pregnancy scare. In the Henry J. Kaiser Family Foundation’s National Survey of Adolescents and Young Adults, 3 in 5 respondents reported that they or their female partner had ever experienced a pregnancy scare (Hoff, Greene, and Davis 2003). Relatively little is known about pregnancy scares and their consequences.
Our first objective is to describe the young women who experience pregnancy scares. We hypothesize that disadvantaged sociodemographic background characteristics and early experiences with sex, lack of contraception, and pregnancy will be associated with pregnancy scares, much as they are associated with unintended pregnancy.
month is only about 50% for young women even when sex is perfectly timed to ovulation (Dunson, Colombo, and Baird 2002). Third, personality traits or skills that lead to pregnancy scares may predict unintended pregnancy as well – for example, the ability to consistently adhere to a contraception regimen.
2. Methods
We use data from the Relationship Dynamics and Social Life (RDSL) study, which interviewed a random, population-based sample of 1,003 young women ages 18-19, residing in a Michigan county. Women were selected from the state driver’s license and personal identification card databases. Investigators conducted a 60-minute face-to-face baseline survey between March 2008 and July 2009. Women then participated in a 2.5-year follow-up study that required completion of weekly online or telephone surveys about contraceptive use, relationships, and prospective pregnancy intentions. In this paper we refer to the follow-up study as “the journal,” and the weekly surveys as “journals”. The follow-up study concluded in February 2012. The response rate for the baseline interview was 84%, 99% agreed to participate in the journal, and 75% participated in the journal for at least 18 months.
Figure 1: Categories of the combined responses to the questions measuring pregnancy desires
2.1 Measures
Table 1: Percent of sample experiencing unintended pregnancy and pregnancy scares (n=901)
Percent
Any unintended pregnancy 13
Number of unintended pregnancies (among those who experienced any unintended pregnancy, N= 114)
1 unintended pregnancy 89
2 unintended pregnancies 11
Any pregnancy scare 9
Number of pregnancy scares (among those who experienced any pregnancy scare, N= 85)
1 pregnancy scare 78
2 pregnancy scares 13
3-4 pregnancy scares 9
Because we are analyzing only weeks in which respondents do not desire pregnancy, any “probably pregnant” report that is not subsequently verified by a pregnancy test (or, eventually, a birth, miscarriage, or abortion) is considered a “pregnancy scare”. Descriptive statistics of these measures are also presented in Table 1. Of the 901 women in our analytic sample, 85 women (9%) reported 114 pregnancy scares during the 18-month study period. The majority reported only one pregnancy scare (78%), but a substantial proportion reported two (13%), and even three or four scares (9%). Of the 126 unintended pregnancies, 26 (21%) were preceded by a pregnancy scare within the study period, and among the 85 women who reported a pregnancy scare, 34 (40%) subsequently had an unintended pregnancy during the study (not shown in tables). Among the 816 women in our analytic sample who did not report a pregnancy scare, only 88 (11%) subsequently had an unintended pregnancy during the study (not shown in tables).
Sociodemographic characteristics and adolescent pregnancy-related experiences. We include characteristics measured in the baseline interview, summarized in Table 2. All of these variables are dichotomous, except high school GPA, which is continuous. Currently receiving public assistance includes WIC (Women, Infants and Children Program), FIP (Family Independence Program), cash welfare, or food stamps.
observations. Time in study is coded in months and ranges from 0.49 to 18 months, with a mean of 8.60 months.
2.2 Data analysis
First we calculate the descriptive statistics for all independent variables for the total sample, as well as two subsamples: those who never experienced a pregnancy scare, and those who experienced a pregnancy scare (Table 2). Independent samples’ t-tests indicate whether the independent variables are statistically different in the two subsamples. Next we investigate these characteristics in a multivariate context, using logistic regression for models of experiencing any pregnancy scare, and Poisson regression for models of the number of pregnancy scares (Table 3). Lastly, we estimate hazard models, implemented using logistic regression, to illustrate the relationship between a pregnancy scare and subsequent unintended pregnancy (Table 4). All analyses were conducted in Stata 12.1 using the logit, poisson, and xtlogit commands. The hazard models were estimated with xtlogit to account for the clustering effect of multiple journals per respondent.
3. Results
3.1 Characteristics of respondents who had a pregnancy scare
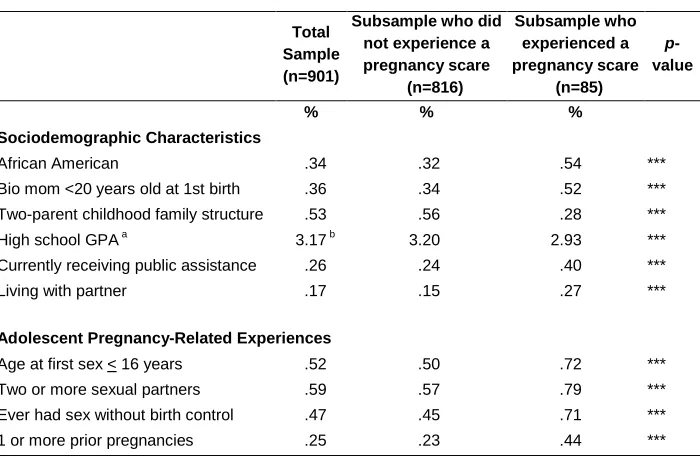
Table 2: Sociodemographic characteristics and adolescent pregnancy-related experiences
Total Sample (n=901)
Subsample who did not experience a pregnancy scare
(n=816)
Subsample who experienced a pregnancy scare
(n=85)
p-value
% % %
Sociodemographic Characteristics
African American .34 .32 .54 ***
Bio mom <20 years old at 1st birth .36 .34 .52 ***
Two-parent childhood family structure .53 .56 .28 ***
High school GPA a 3.17 b 3.20 2.93 ***
Currently receiving public assistance .26 .24 .40 ***
Living with partner .17 .15 .27 ***
Adolescent Pregnancy-Related Experiences
Age at first sex < 16 years .52 .50 .72 ***
Two or more sexual partners .59 .57 .79 ***
Ever had sex without birth control .47 .45 .71 ***
1 or more prior pregnancies .25 .23 .44 ***
Note: + p < 0.10; * p < 0.05; ** p < 0.01; *** p < 0.001 (one-tailed independent samples t-tests for significant differences between the two subsamples)
a
mean GPA presented for sample and subsamples; b std. dev.=.59
3.2 Multivariate models of experiencing a pregnancy scare
The results in Table 3 are similar to the bivariate results presented in Table 2, although some of the associations are not statistically significant in the multivariate models. Further, the results are quite similar across specifications – characteristics associated with the probability of experiencing a pregnancy scare are also associated with the number of pregnancy scares actually reported, with only minor differences.
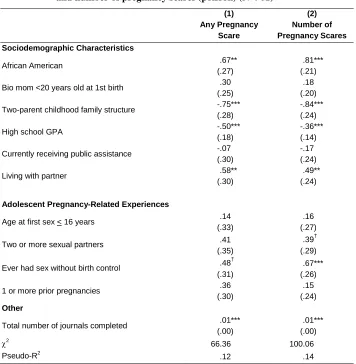
Table 3: Regression coefficients for models of any pregnancy scare (logistic) and number of pregnancy scares (poisson) (N=901)
(1) Any Pregnancy Scare (2) Number of Pregnancy Scares Sociodemographic Characteristics
African American .67**
(.27)
.81*** (.21)
Bio mom <20 years old at 1st birth .30
(.25)
.18 (.20)
Two-parent childhood family structure -.75***
(.28)
-.84*** (.24)
High school GPA -.50***
(.18)
-.36*** (.14)
Currently receiving public assistance -.07
(.30)
-.17 (.24)
Living with partner .58**
(.30)
.49** (.24)
Adolescent Pregnancy-Related Experiences
Age at first sex < 16 years .14
(.33)
.16 (.27)
Two or more sexual partners .41
(.35)
.39† (.29)
Ever had sex without birth control .48
†
(.31)
.67*** (.26)
1 or more prior pregnancies .36
(.30)
.15 (.24)
Other
Total number of journals completed .01***
(.00)
.01*** (.00)
χ2
66.36 100.06
Pseudo-R2
.12 .14
Note: Standard errors in parentheses. †
p < 0.10; * p < 0.05; ** p < 0.01; *** p < 0.001 (one-tailed tests)
disproportionately represented in the group that experienced multiple pregnancy scares. In these multivariate regression models, having had sex without birth control is the only adolescent pregnancy-related experience strongly related to pregnancy scares. Recall that in the bivariate models, on the other hand, early sex, multiple partners, prior sex without birth control, and one or more prior pregnancies are strongly related to pregnancy scares. This suggests that early sex, multiple sexual partners, and prior pregnancy are associated with pregnancy scares largely because of the sociodemographic characteristics of those young women who have early sex, multiple partners, and teen pregnancies, or because of their association with having sex without birth control. This is consistent with existing research; for example, finding that early sexual debut is associated with less contraceptive use (Kusunoki and Upchurch 2011; Manning, Longmore, and Giordano 2000; Manlove, Ryan, and Franzetta 2007). Note also that respondents who completed more journals were more likely to report a pregnancy scare, likely in part because it is associated with more time in the study period.
3.3 Multivariate models of the hazard of experiencing an unintended pregnancy
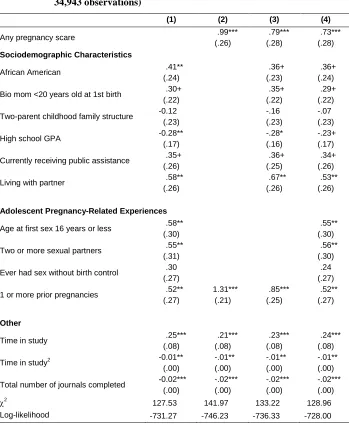
Table 4: Logistic regression coefficients (additive effects on log-odds) for models of the hazard of unintended pregnancy (N=901 individuals, 34,943 observations)
(1) (2) (3) (4)
Any pregnancy scare .99***
(.26) .79*** (.28) .73*** (.28) Sociodemographic Characteristics
African American .41**
(.24)
.36+ (.23)
.36+ (.24)
Bio mom <20 years old at 1st birth .30+
(.22)
.35+ (.22)
.29+ (.22)
Two-parent childhood family structure -0.12
(.23)
-.16 (.23)
-.07 (.23)
High school GPA -0.28**
(.17)
-.28* (.16)
-.23+ (.17)
Currently receiving public assistance .35+
(.26)
.36+ (.25)
.34+ (.26)
Living with partner .58**
(.26)
.67** (.26)
.53** (.26)
Adolescent Pregnancy-Related Experiences
Age at first sex 16 years or less .58**
(.30)
.55** (.30)
Two or more sexual partners .55**
(.31)
.56** (.30)
Ever had sex without birth control .30
(.27)
.24 (.27)
1 or more prior pregnancies .52**
(.27) 1.31*** (.21) .85*** (.25) .52** (.27) Other
Time in study .25***
(.08) .21*** (.08) .23*** (.08) .24*** (.08)
Time in study2 -0.01**
(.00) -.01** (.00) -.01** (.00) -.01** (.00)
Total number of journals completed -0.02***
(.00) -.02*** (.00) -.02*** (.00) -.02*** (.00) χ2
127.53 141.97 133.22 128.96
Log-likelihood -731.27 -746.23 -736.33 -728.00
Note: Standard errors in parentheses.
Model 2 shows that young women who experienced a pregnancy scare had higher subsequent unintended pregnancy rates than those respondents who did not. More precisely, the weekly log-odds of experiencing an unintended pregnancy were 99% higher, which translates into nearly double the unintended pregnancy rate for women who had a prior pregnancy scare compared to those who did not.
Model 3 indicates higher unintended pregnancy rates after a pregnancy scare even when measures of sociodemographic characteristics are included as controls. In other words, although women from disadvantaged backgrounds experience more pregnancy scares and higher unintended pregnancy rates, young women who experience a pregnancy scare have higher unintended pregnancy rates than their peers without a pregnancy scare, net of their disadvantaged background. However, the fact that the magnitude of the pregnancy scare effect declines by 20% between models 2 and 3 indicates that pregnancy scares are associated with unintended pregnancy in part because of the sociodemographic characteristics linked to both experiences.
The adolescent pregnancy-related experiences added to Model 4 explain an additional 6% of the relationship between pregnancy scares and unintended pregnancy, but the coefficient remains large and statistically significant. Although adolescent experiences with early sex and multiple partners are strongly related to the rate of unintended pregnancy, for the most part they do not explain the difference in unintended pregnancy rates between young women who experienced pregnancy scares and those who did not.
4. Discussion
We found that a substantial proportion (9%) of young women experienced a pregnancy scare during the 18-month study period. A wide range of sociodemographic characteristics and adolescent experiences were associated with pregnancy scares in our bivariate analyses. However, in our multivariate analyses, only being African-American, growing up with something other than a two-parent family structure, having a lower high school GPA, living with a romantic partner, and having sex without birth control during adolescence were independently associated with a higher probability of a pregnancy scare. We found similar results when we predicted number of pregnancy scares. This suggests that although pregnancy scares occur to all types of young women, those from less advantaged backgrounds are more likely to experience a pregnancy scare than those from more advantaged backgrounds.
during the relatively limited period of observation in our study (18 months). In our hazard models, pregnancy scares are a strong predictor of unintended pregnancy, independent of key sociodemographic characteristics and adolescent experiences. In other words, young women who experience a pregnancy scare have higher unintended pregnancy rates than those who do not, regardless of their background. This suggests that pregnancy scares may be a harbinger of a future unintended pregnancy.
It is beyond the scope of the current study to discern the mechanisms that explain why pregnancy scares are followed by unintended pregnancies, but future research should examine whether young women’s attitudes or behaviors change after this experience. Of course, we cannot rule out that other unknown or unmeasured factors associated with unintended pregnancy are captured by pregnancy scares. But even if this is the case, a pregnancy scare could mark an important point for intervention.
The study has several limitations. The single county sample design may decrease the generalizability of the results. The sample does, however, hold constant the geographic differences in pregnancy scares and/or unintended pregnancy rates, as well as the geographic factors (e.g., media, policy, etc.) that are not a focus in this study. The very few Latinas in the county, and in our sample, precludes assessing them as a separate category. Research has estimated that other surveys capture only about one-half of abortions (Jones and Kost 2007). Thus, unintended pregnancies that end in abortion are likely underrepresented in our analyses.
Finally, although we measure pregnancy desires prospectively with two unipolar scales, this measurement does not fully capture the range of emotions surrounding pregnancy. We also use a broad definition of “unintended” in this analysis – we consider all pregnancies that were not fully intended (i.e., strong desire to get pregnant and no desire to avoid pregnancy) to be unintended. Our goal in this analysis was not to develop a complex measure of the intention status of pregnancies or pregnancy scares, but rather to limit our analyses to time periods when young women were not specifically trying to become pregnant.
5. Conclusions
6. Acknowledgements
This research was supported by two grants from the National Institute of Child Health and Human Development (R01 HD050329, R01 HD050329-S1, PI Barber), a grant from the National Institute on Drug Abuse (R21 DA024186, PI Axinn), and a population center grant from the National Institute of Child Health and Human Development to the University of Michigan’s Population Studies Center (R24 HD041028). We thank N.E. Barr for valuable editing assistance, and John Casterline and Ann Biddlecom for helpful comments on an earlier draft of the paper. We gratefully acknowledge the Survey Research Operations (SRO) unit at the Survey Research Center of the Institute for Social Research for their help with the data collection, particularly Vivienne Outlaw, Sharon Parker, and Meg Stephenson. We also gratefully acknowledge the intellectual contributions of the other members of the original RDSL project team, including William Axinn, Mick Couper, and Steven Heeringa, as well as the Advisory Committee for the project: Larry Bumpass, Elizabeth Cooksey, Kathie Harris, and Linda Waite.
Corrections:
References
Dunson, D., Colombo, B., and Baird, D.D. (2002). Changes with age in the level and duration of fertility in the menstrual cycle. Human Reproduction 17(5): 1399– 1403. doi:10.1093/humrep/17.5.1399.
Hoff, T., Greene, L., and Davis, J. (2003). National survey of adolescents and young adults: Sexual health knowledge, attitudes and experiences. Menlo Park, CA: The Henry J. Family Foundation.
Jones, R.K. and Kost, K. (2007). Underreporting of induced and spontaneous abortion in the united states: An analysis of the 2002 national survey of family growth. Studies in Family Planning 38(3): 187–197. doi:10.1111/j.1728-4465.2007. 00130.x.
Kusunoki, Y. and Upchurch, D.M. (2011). Contraceptive method choice among young women in the united states: The importance of relationship context. Demography 48(4): 1451–1472. doi:10.1007/s13524-011-0061-0.
Manlove, J., Ryan, S., and Franzetta, K. (2007). Contraceptive use patterns across teens’ sexual relationships: The role of relationships, partners, and sexual histories. Demography 44(3): 603–621. doi:10.1353/dem.2007.0031.
Manning, W.D., Longmore, M.A., and Giordano, P.C. (2000). The relationship context of contraceptive use at first intercourse. Family Planning Perspectives 32(3): 104–110. doi:10.2307/2648158.
Miller, W.B., Barber, J.S., and Gatny, H.H. (2013). The effects of ambivalent fertility desires on pregnancy risk in young women in the USA. Population studies 67(1): 25–38. doi:10.1080/00324728.2012.738823.
National Campaign to Prevent Teen and Unplanned Pregnancy (2013). Contraception Calling: Why Aren't More Young Women Listening? [electronic resource].