Structural Equation Modeling of
eBankQual Scale: A Study of E-Banking
in India
Kumbhar, Vijay
Abasaheb Marathe College, Rajapur (Maharashtra) India
4 May 2011
Online at
https://mpra.ub.uni-muenchen.de/32714/
The Journal of Sri Krishna Research & Educational Consortium
I N T E R N A T I O N A L J O U R N A L O F
B U S I N E S S E C O N O M I C S A N D
M A N A G E M E N T R E S E A R C H
I n t e r n a t i o n a l l y I n d e x e d & L i s t e d R e f e r r e d e - J o u r n a lSTRUCTURAL EQUATION MODELING
OF eBANKQUAL SCALE: A STUDY OF E-BANKING IN INDIA
VIJAY M. KUMBHAR*
*Rayat Shikshan Sanstha Satara’s
Abasaheb Marathe College Rajapur (Maharashtra) India 416702 E-mail: [email protected]
ABSTRACT
This study assesses the relationship between perceived quality, brand perception and perceived value with satisfaction. For the data analysis structural equation modeling (SEM) method and path analysis method were used. A result indicates that, eBankQual model is fit to assess relationship between service quality, brand perception and perceived value with overall customers’ satisfaction in e-banking service. Result of regression SEM indicates that, all 14 variables found significant and good predictors of overall satisfaction in e-banking services. However, result of SEM analysis indicates that, data supports to eBankQual model and dimensions Compensation, Convenience, Contact Facilities, Easy to Use, Responsiveness, Cost Effectiveness and System Availability including brand perception and perceived value were found more significant factors in the eBankQual model.
KEYWORDS: Structural Equation Modeling, Service quality, Brand perception,
Perceived value, Satisfaction.
INTRODUCTION
There are many scales and models available to assess service quality and customer satisfaction in service and e-service settings. However, no any appropriate scale is available to assess service quality and customers’’ satisfaction in e-baking. Therefore, through the present research author has tried to develop a specialized scale to same. A customer satisfaction is an ambiguous and abstract concept. Actual
manifestation of the state of satisfaction will vary from person to person, product to product and service to service. The state of satisfaction depends on a number of factors which consolidate as psychological, economic and physical factors. The quality of service is one of the major determinants of the customer satisfaction, which can be enhanced by using advanced technology. Today, almost all banks in are providing e-banking
service to their customers. It brings connivance, customer centricity, enhance service quality and cost effectiveness in the banking services. Even now, customers are evaluating their banks based on availability of high-tech services and banks also enhancing their e-banking service to satisfy their customers. Many researchers from USA, UK, Finland, Malaysia, Taiwan, etc. have proved that the use of technology positively affects the customers’ satisfaction in banking industry. But some researches evidenced that, technology based banking service can’t satisfy the each and every need of the customers’ and each type of customers’. There are may be some possibilities of gaps between customers’ expectations and actual service perception in ICT based banking service, which leads to customer dissatisfaction. Hence, author felt that, there is a need to assess the service quality and customers satisfaction in e-banking in Indian context.
OBJECTIVES AND RESEARCH QUESTIONS
Basically, concept of eBankQual scale was firstly mentioned by Jayawardhena et al., (2006) his research paper presented in European Marketing
Academy Conference, Athens. The objective of this study is to test a model of customer satisfaction in e-banking service setting. To accomplish this objective a specific question was addressed:
1. What is the predictive
relationship between service quality and customer satisfaction in e-banking?
2. What is the predictive
relationship between brand perception and customer satisfaction in e-banking?
3. What is the predictive
relationship between perceived value and customer satisfaction in e-banking?
REVIEW OF RELEVANT LITERATURE
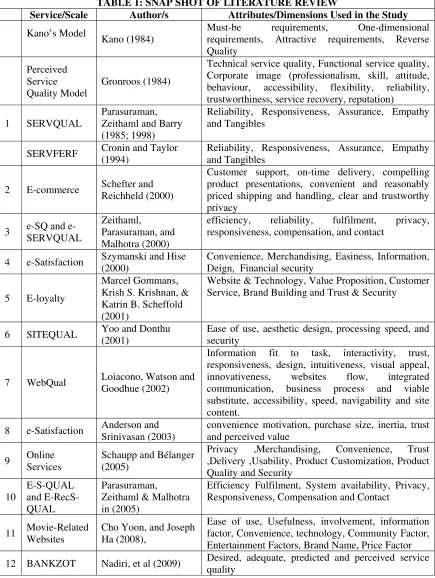
TABLE 1: SNAP SHOT OF LITERATURE REVIEW
Service/Scale Author/s Attributes/Dimensions Used in the Study
Kano’s Model
Kano (1984)
Must-be requirements, One-dimensional requirements, Attractive requirements, Reverse Quality
Perceived Service Quality Model
Gronroos (1984)
Technical service quality, Functional service quality, Corporate image (professionalism, skill, attitude, behaviour, accessibility, flexibility, reliability, trustworthiness, service recovery, reputation)
1 SERVQUAL
Parasuraman, Zeithaml and Barry (1985; 1998)
Reliability, Responsiveness, Assurance, Empathy and Tangibles
SERVFERF Cronin and Taylor
(1994)
Reliability, Responsiveness, Assurance, Empathy and Tangibles
2 E-commerce Schefter and
Reichheld (2000)
Customer support, on-time delivery, compelling product presentations, convenient and reasonably priced shipping and handling, clear and trustworthy privacy
3 SQ and
e-SERVQUAL
Zeithaml, Parasuraman, and Malhotra (2000)
efficiency, reliability, fulfilment, privacy, responsiveness, compensation, and contact
4 e-Satisfaction Szymanski and Hise
(2000)
Convenience, Merchandising, Easiness, Information, Deign, Financial security
5 E-loyalty
Marcel Gommans, Krish S. Krishnan, & Katrin B. Scheffold (2001)
Website & Technology, Value Proposition, Customer Service, Brand Building and Trust & Security
6 SITEQUAL Yoo and Donthu
(2001)
Ease of use, aesthetic design, processing speed, and security
7 WebQual Loiacono, Watson and
Goodhue (2002)
Information fit to task, interactivity, trust, responsiveness, design, intuitiveness, visual appeal, innovativeness, websites flow, integrated communication, business process and viable substitute, accessibility, speed, navigability and site content.
8 e-Satisfaction Anderson and
Srinivasan (2003)
convenience motivation, purchase size, inertia, trust and perceived value
9 Online
Services
Schaupp and Bélanger (2005)
Privacy ,Merchandising, Convenience, Trust ,Delivery ,Usability, Product Customization, Product Quality and Security
10
E-S-QUAL and E-RecS-QUAL
Parasuraman, Zeithaml & Malhotra in (2005)
Efficiency Fulfilment, System availability, Privacy, Responsiveness, Compensation and Contact
11 Movie-Related
Websites
Cho Yoon, and Joseph Ha (2008),
Ease of use, Usefulness, involvement, information factor, Convenience, technology, Community Factor, Entertainment Factors, Brand Name, Price Factor
12 BANKZOT Nadiri, et al (2009) Desired, adequate, predicted and perceived service
quality
SERVICE QUALITY AND CUSTOMER SATISFACTION
The relationship between expectation, perceived service quality and customers satisfaction have been investigated in a number of researches (Zeithaml, et al, 1988). They found that, there is very strong relationship between quality of service and customer satisfaction (Parasuraman et al, 1985; 1988; ). Increase in service quality of the banks can satisfy and develop attitudinal loyalty which ultimately retains valued customers (Nadiri, et al 2009). The higher level of perceived service quality results in increased customer satisfaction. When perceived service quality is less than expected service quality customer will be dissatisfied (Jain and Gupta, 2004). According to Cronin and Taylor (1992) satisfaction super ordinate to quality-that quality is one of the service dimensions factored in to customer satisfaction judgment.
BRAND REPUTATION AND CUSTOMER SATISFACTION
Marketing literature including NCSI and ACSI literature examined positive of the link between the satisfaction and the brand reputation. Wafa et al (2009) mentioned that, the nature and amount of a consumer's experience with an evoked set of brands. Perceived brand reputation has significant impacts on customer satisfaction and a consumer's beliefs about brand are derived from personal use experience, word-of-mouth endorsements/criticisms, and/or the marketing efforts of companies. (Woodruff et, al.1983). A brand perception is also one of the important aspects of in banking sector. Perceived brand reputation in banking sector refers to the banks reputation and expiating place of bank in the banking industry (Che-Ha and Hashim,
2007, Reynolds, 2007). It measures experience of the customer how he/she fill with this brand and their services. A perceived overall brand performance is determined by some combination of beliefs about the brand's various performance dimensions (Woodruff et al 1983; Che-Ha and Hashim, 2007). A brand perception is important factor to service provides because, satisfied customer with brand will recommends that service to others.
PERCEIVED VALUE
Apart from brand perception, perceived value also one of most important constructs of the customer satisfaction measurement; it is used to assess the actual benefits of the service. Perceived value is compression between price or charges paid for the services by the customer as sacrifice of the money and utility derived by service perception (Holbrook, 1994; Bolton, & Drew, 1991; Cronin and Taylor, 1992; 1994). In this study we have assessed overall satisfaction also it can be say cumulative satisfaction. It is overall perception and concluded remark of the customer regarding alternative banking channel used by customers. The overall remark of the customer is based on his/her expectations about various aspects of service quality and actual service he/she perceived by the particular bank.
CONCEPTUALIZATION AND MEASUREMENT OF CUSTOMER SATISFACTION
banking, ATM, POS, credit cards, debit cards and other electronic devises. Traditionally the level of customer satisfaction was determined by the quality of services, price and purchasing process. Consequently, the level of e-satisfaction is also determined by the quality of e-services, the price level and e-purchasing process (Ming Wang, 2003). Literature on e-consumers satisfaction realizes that there are different factors of e-customers satisfaction than formal customer, e-satisfaction are modeled as the consequences of attitude toward the e-portals (Chen and Chen, 2009). After review of the literature some important factors of e-satisfaction were extracted (Table 1). There are number of scales and instruments are available to assess service quality. Available literature shows that, the customer satisfaction is measured via service quality and service quality measured by various measurement tools and instruments developed by various researchers (Riscinto-Kozub, 2008) and marketing consultancy organisations i.e. Gronroos’s ‘Perceived Service Quality Model, SERVQUAL, SERVPERF, SITQUAL, WEBQUAL, etc (Table 1).
HYPOTHESES
Based on review of literature and considering rational views of the experts in banking and service marketing following Null and Alternative hypotheses were formulated;
H1 Null: Service quality not significantly contributing to customer satisfaction in e-banking
H2 Null: Service quality not significantly contributing to brand perception in e-banking
H3 Null: Service quality not significantly contributing to perceived value in e-banking
H4 Null: Perceived service quality not significantly contributing to brand perception in e-banking
H5 Null: Perceived service quality not significantly contributing to perceived value in e-banking
H6 Null: Brand perception not significantly contributing to customer satisfaction in e-banking
H7 Null: Perceived value not significantly contributing to customer satisfaction in e-banking
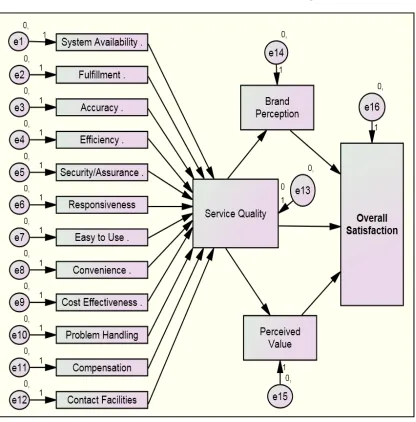
CONCEPTUAL MODEL
FIGURE 1: CONCEPTUAL MODEL: EBANKQUAL
DATA AND METHODS
The research model as presented Figure 1 implemented as a structural equation model (SEM) through AMOS 18.0. This model is tested with numerical data obtained from customer survey. The data were collected from customer (N=200) of public and private sector in Satara city of Maharashtra during the month of May to August 2010. Survey was conducted using Likert based
incomplete and out of order questionnaires were eliminated and only 190 usable questionnaires were used. Thereby the gathered raw data were aggregated according to dimensions under study. The structural equation model was performed using AMOS 18.0 to specify the causal relationships among the latent variables, describes the causal effects and unexplained variance through SPSS 19.0 and AMOS 18.
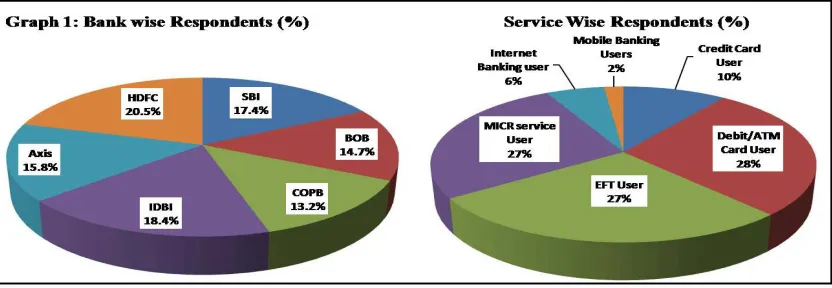
DEMOGRAPHIC PROFILE OF THE RESPONDENTS
Graph 1 indicates demographic information of the (N=190) respondents, consisting 17.4% of State Bank of India, 14.7% of Bank of Baroda, 13.2% of Corporation Bank, 18.4% of IDBI Bank, 15.8% of Axis Bank and 20.5% of HDFC Bank (63.7% of Public Sector and 36.3% of private sector Banks). Graph 1 also indicates that, 10% of Credit Card users and 28% of Debit/ATM card users, 27% of Electronic Fund Transfer facilities users, 27% of MICR clearing facilities users, 6% of Internet baking users and 2% of Mobile banking service users.
[image:8.612.99.515.289.433.2]
Table 1 shows that, 82.1% of the respondents were male, 17.9 % were female. In terms of age group, 20% were below 25 years, 34.7% of 25 to 35 years, 35.8% were 36 to 50 years and 9.5% were 51 to 60 years old out of 190 respondents. There were no respondent above 60 years however; some retired persons from military and army were covered under study as samples. Educational status of the respondents indicates that 4.2% of respondents were below HSC, 5.3% of HSC, 49.5% of graduate and 41.1% of post graduates. There were 31.6% of employees and 36.3% of businessmen as a core respondent who were using most of alternative channels. However, 13.7% of professional (doctor, engineers, charted accountants, investment consultants,
TABLE 1: DEMOGRAPHIC PROFILE OF THE RESPONDENTS
Frequency Percent Frequency Percent
<1 Lakh 39 20.5 <HSC 8 4.2
1 to 3 Lakh 31 16.3 HSC 11 5.3
3 to 8 Lakh 70 36.8 Graduate 94 49.5
8 to 15 Lakh 27 14.2 Post Graduate 77 41.1
15 to 25 Lakh 9 4.7 Total 190 100.0
>25 Lakh 4 2.1 Employee 60 31.6
Dependents 10 5.3 Businessman 69 36.3
Total 190 100 Retired 8 4.2
Below 25 38 20 Student 27 14.2
25-35 66 34.7 Professional 26 13.7
36-50 68 35.8 Total 190 100.0
51-60 18 9.5 Female 34 17.9
Total 190 100 Male 156 82.1
Source: Survey Total 190 100
SEM ANALYSIS
On the basis of the aggregated survey data, The Unweighted Least Squares (ULS) method is employed, because the observed variables in the data set do not follow a multivariate normal distribution. The use of structural equating modeling (SEM) techniques seems to be necessary in the study of related concepts such as service quality, satisfaction, loyalty and repurchase (Solvang, 2008). In order to determine the causal relationship between service quality, brand perception, perceived value and customer satisfaction structural equation modeling was employed (Bloemer et al 1999). Structural equation models (SEM) are the most powerful instruments for path analysis in marketing and consumer research, and have been widely applied in activity and travel behavior research during recent decades (William and Tang, 2003). Structural equation modeling (SEM) provides simultaneous tests of measurement reliability and structural relations and overcome some of the limitations of traditional statistical
techniques (Smith 2004).If the appropriate distributional assumptions are met and if the specified model is correct, then the probability level is the approximate probability of getting a chi-square statistic as large as the chi-square statistic obtained from the current set of data used for testing of the Structural Equation Model (SEM). If probability level is .05 or less, the departure of the data from the model is significant at the .05 level (Bollen & Long,
Chi-squa DF RMSEA R in Figur intercept variables eBankQu dimensio values ar regressio 0.10 in c
are
Result of pat re 2 show
s for pre s for ea ual and regre on. All inte
re regaining on weights case of 12 d
TAB
108 104 .223
th modeling s that, est edicting en ach dimen ession weigh ercepts (fac
from 2.61 to ranging fro dimensions
FIGU
BLE 2: MO
83.392 4 3 g indicated timates of ndogenous nsion of
hs of each tor mean) o 3.79 and om .06 to
of service
URE 2: EBA
DEL FIT IN
C G A quality servic servic Brand Percei Howe quality ANKQUAL NDICES CFI GFI AGFI y. Though, ce quality to ce quality to d perception
ived value ever, regres y to satisfac
L MODEL
.748 .950 .869
, regression o brand per
o Perceived n to satisfac to satisfact sion weigh tion is .86.
n weight o rception 1.0 d value 1.0 ction.070 an tion also.07 ht of servic
RESULTS OF REGRESSION ANALYSIS
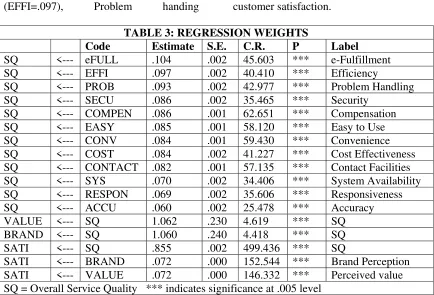
A result of regression analysis indicates relationship between predicting variables and criterion variable. Table 3 indicates regression weights of predicting variables, which shows that how to affects predicting variables on dependent variable; result revels that, all variables were significantly influencing customers’’
satisfaction. However, efficiency (EFFI=.097), Problem handing
[image:11.612.90.524.237.532.2](PROB=.093) and Fulfillment (eFULL=.104) were highly influencing satisfaction followed by security (.086), compensation (.086), easy to use (.085), convenience (.084), Cost effectiveness (.084), contact (.082), System availability (.070), responsiveness (.069), and accuracy (.060) on overall service quality. Overall service quality influencing brand perception (1.060) and perceived value (1.062) as well as satisfaction (.855). However, brand perception (.072) and perceived value (.072) also influencing customer satisfaction.
TABLE 3: REGRESSION WEIGHTS
Code Estimate S.E. C.R. P Label
SQ <--- eFULL .104 .002 45.603 *** e-Fulfillment
SQ <--- EFFI .097 .002 40.410 *** Efficiency
SQ <--- PROB .093 .002 42.977 *** Problem Handling
SQ <--- SECU .086 .002 35.465 *** Security
SQ <--- COMPEN .086 .001 62.651 *** Compensation
SQ <--- EASY .085 .001 58.120 *** Easy to Use
SQ <--- CONV .084 .001 59.430 *** Convenience
SQ <--- COST .084 .002 41.227 *** Cost Effectiveness
SQ <--- CONTACT .082 .001 57.135 *** Contact Facilities
SQ <--- SYS .070 .002 34.406 *** System Availability
SQ <--- RESPON .069 .002 35.606 *** Responsiveness
SQ <--- ACCU .060 .002 25.478 *** Accuracy
VALUE <--- SQ 1.062 .230 4.619 *** SQ
BRAND <--- SQ 1.060 .240 4.418 *** SQ
SATI <--- SQ .855 .002 499.436 *** SQ
SATI <--- BRAND .072 .000 152.544 *** Brand Perception
SATI <--- VALUE .072 .000 146.332 *** Perceived value
SQ = Overall Service Quality *** indicates significance at .005 level
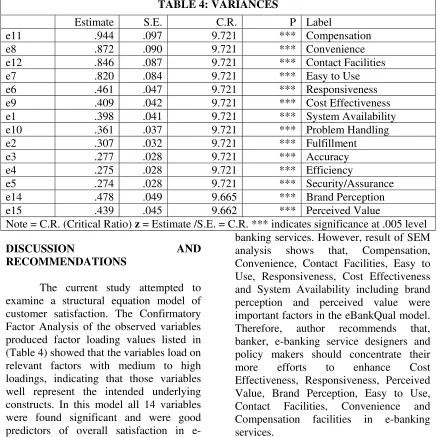
Table 4 explains variances expensed by predicting variables in the model (eBankQual). Table 4 indicates that, Compensation, Convenience, Contact Facilities and Easy to Use explains variances from .820 to .944 in overall service quality, thereby, Responsiveness Cost Effectiveness, Cost Effectiveness, System Availability, Problem Handling, Fulfillment, Accuracy, Efficiency and Security/Assurance explains variance less
TABLE 4: VARIANCES
Estimate S.E. C.R. P Label
e11 .944 .097 9.721 *** Compensation
e8 .872 .090 9.721 *** Convenience
e12 .846 .087 9.721 *** Contact Facilities
e7 .820 .084 9.721 *** Easy to Use
e6 .461 .047 9.721 *** Responsiveness
e9 .409 .042 9.721 *** Cost Effectiveness
e1 .398 .041 9.721 *** System Availability
e10 .361 .037 9.721 *** Problem Handling
e2 .307 .032 9.721 *** Fulfillment
e3 .277 .028 9.721 *** Accuracy
e4 .275 .028 9.721 *** Efficiency
e5 .274 .028 9.721 *** Security/Assurance
e14 .478 .049 9.665 *** Brand Perception
e15 .439 .045 9.662 *** Perceived Value
Note = C.R. (Critical Ratio) z = Estimate /S.E. = C.R. *** indicates significance at .005 level
DISCUSSION AND RECOMMENDATIONS
The current study attempted to examine a structural equation model of customer satisfaction. The Confirmatory Factor Analysis of the observed variables produced factor loading values listed in (Table 4) showed that the variables load on relevant factors with medium to high loadings, indicating that those variables well represent the intended underlying constructs. In this model all 14 variables were found significant and were good predictors of overall satisfaction in
ANNEXURE-I
SERVICE QUALITY DIMENSIONS USED IN EBANKQUAL
Dimension Description
1. System Availability
Up-to-date equipment and physical facilities- Full Branch computerization, Core banking, ATM, POS, internet banking, mobile banking, SMS alerts, credit card, EFT, ECS, E-bill pay
2. E-Fulfillment Scope of services offered, availability of global network,
digitalization of business information, Variety of services
3. Accuracy Error free e-services through e-banking channels
4. Efficiency
Speed of service (clearing, depositing, enquiry, getting information, money transfer, response etc.), immediate and quick transaction and check out with minimal time.
5. Security
Trust, privacy, believability, truthfulness, and security, building customer confidence. freedom from danger about money losses, fraud, PIN, password theft; hacking etc.
6. Responsiveness
Problem handling, recovery of the problem, prompt service, timeliness service, helping nature, employee curtsey , recovery of PIN, password and money losses
7. Easy to use Easy to use & functioning of ATM, Mobile banking, internet
banking, credit card, debit card etc.
8. Convenience Customized services, any ware and any time banking, appropriate
language support, time saving
9. Cost Effectiveness
Price, fee, charges, - i.e. commission for fund transfer , interest rate, clearing charges, bill collection and payments’, transaction charges, charges on Switching of ATM, processing fees etc.etc price, charges and commissions should be reduce and charges taken by Telecommunication Company, devise designer company, internet service providers
10. Problem Handling
It refers to problem solving process regarding computerized banking services
11. Compensation It refers to recover the losses regarding to problems and
inconvenience occurred in using e-banking channels.
12. Contact Communication in bank and customer or customers to bank, Via
e-mail, SMS, Phone, interactive website, postal communication, fax
REFERENCES
1. Anderson and Srinivasan (2003)
E-Satisfaction and E-Loyalty: A
Contingency Framework, Psychology
& Marketing, Vol. 20(2): 123–138 (February 2003)
2. Bloemer, Josee, Ko de Ruyter, and
Martin Wetzels (1999), "Linking perceived service quality and service loyalty: a multi-dimensional perspective," European Journal of Marketing, 33 (11/12), 1082-106.
4. Bolton, R. N. & Drew, J. H. (1991): A Multistage Model of Customer’s Assessments of Service Quality and
Value, in: Journal of Consumer
Research, Vol. 17 (October), pp. 375-384.
5. Che-Ha and Hashim, (2007), Brand
Equity, Customer Satisfaction & Loyalty: Malaysian Banking Sector,
International Review of Business Research Papers Vol. 3 No.5 November 2007 Pp.123-133
6. Chen and Chen, (2009), Determinants of satisfaction and continuance intention towards self-service technologies, Industrial Management & Data Systems Vol. 109 No. 9, 2009 pp. 1248-1263
7. Cho Yoon, and Joseph Ha (2008),
Users’ Attitudes Toward Movie-Related Websites And E-Satisfaction,
Journal of Business & Economics Research Volume 2, Number 3
8. Cronin J. Joseph, Jr. and Taylor Steven A., (1994) SERVPERF versus
SERVQUAL: Reconciling Performance-Based and
Perceptions-Minus- Expectations Measurement of
Service Quality The Journal of
Marketing, Vol. 58, No. 1 (Jan., 1994), pp. 125-131
9. Cronin, J., Taylor, S.A. (1992),
"Measuring service quality: a Rreexamination and extension",
Journal of Marketing, 56 (July), 55-68.
10.Gronroos, C. (1990), Service
Management and Marketing, Lexington Books, Lexington, MA.
11.Holbrook, M. B. (1994): The Nature of Customer Value, in: Rust, R. T.; Oliver, R. L. (eds.): Service Quality:
New Directions in Theory and Practice, London 1994, pp. 21-71.
12.Jain S. K. and Gupta Garima (2004), Measuring Service Quality: SERVQUAL vs. SERVPERF Scales,
VIKALPA ,Volume 29, No 2, April - June 2004, pp 25-37
13.Jayawardhena. C.,, Raan K. and Farrell A. M., (2006) Internet Banking Service Quality: An Investigation of Interrelationships between Construct Dimensions, paper presented in
European Marketing Academy Conference, Athens, Greece, May,
2006, available on http://eprints.aston.ac.uk/2919/
accessed on June, 2010
14.Loiacono, E.T., Watson, R.T. and
Goodhue, D.L. (2002), ‘‘WebQUAL: a measure of web site quality’’, Proceedings of the AMA Winter
Educators’ Conference, American
Marketing Association, Chicago, IL, pp. 432-8.
15.Marcel Gommans, Krish S. Krishnan, & Katrin B. Scheffold (2001), From Brand Loyalty to E-Loyalty: A
Conceptual Framework, Journal of
Economic and Social Research 3(1) 2001, 43-58
16.Ming Wang, (2003), Assessment of service Quality via satisfaction in
E-commerce Globalization, The
Electronic Journal on Information
System in developing Countries(EJISDC), Vol. 11, No. 10,
pp 1-4
17.Nadiri, Halil , Kandampully, Jay and Hussain, Kashif(2009) 'Zone of tolerance for banks: a diagnostic model
of service quality', The Service
18.Parasuraman A. Zeithaml Valarie A. and Malhotra Arvind (2005) E-S-QUAL: A Multiple-Item Scale for Assessing Electronic Service Quality,
Journal of Service Research, Volume 7, No. X, Month 2005 1-21
19.Parasuraman, A. Valarie A. Zeithaml, Leonard L. Berry (1985) A Conceptual Model of Service Quality and Its Implications for Future Research, The Journal of Marketing, Vol. 49, No. 4 (Autumn, 1985), pp. 41-50
20.Parasuraman, A., Zeithaml, V. A., & Berry, L. L. (1988), “SERVQUAL: A Multiple-Item Scale For Measuring Consumer Perceptions Of Service Quality”, Journal Of Retailing, Spring, Volume 64, Number 1, pp. 12-40.
21.Reynolds John, (2007), A
Retrospective Data Examination Of Customer Loyalty In The E- Banking Technology Services Industry: Strategies For New Successes, A Dissertation Presented in Partial Fulfillment Of the Requirements for the Degree Doctor of Philosophy, Capella University, November 2007
22.Riscinto-Kozub, (2008), The Effects of Service Recovery Satisfaction on Customer Loyalty And Future Behavioral Intentions: An Exploratory Study In The Luxury Hotel Industry, A thesis Submitted to the Graduate Faculty of Auburn University in Partial Fulfillment of the Requirements for the Degree of Doctor of Philosophy, in May 2008
23.Schaupp and Bélanger (2005) A
Conjoint Analysis of Online Consumer Satisfaction, Journal of Electronic Commerce Research, Vol. 6, No.2, 2005 Pp 95-111
24.Schefter, P. and Reichheld, F (2000)
“E-Loyalty,“ Harvard Business
Review, 78 (4): 105-114.
25.Smith D., Smith K. Langfield (2004), Structural Equation Modeling in Management Accounting Research: Critical Analysis and Opportunities”,
Journal of Accounting Literature, Vol. 23, pp. 49-86
26.Solvang Bernt Krohn (2008),
Satisfaction, Loyalty and Repurchase: A Study of Customers of Furniture and Grocery Stores, Consumer Satisfaction, Dissatisfaction and Complaining Behavior Conference Proceedings 2008, Illinois State University, Las Vegas, Nevada.
27.Szymanski and Hise (2000),
e-Satisfaction: An Initial Examination,
Journal of Retailing, Volume 76(3) pp. 309–322, ISSN: 0022-4359
28.Wafa M’Sallem, Nabil Mzoughi and
Olfa Bouhlel (2009), Customers’ evaluations after a bank renaming: effects of brand name change on brand personality, brand attitudes and customers’ satisfaction, Innovative Marketing, Volume 5, Issue 3, 2009 58
29.William JEN and Tang-Jung LU
(2003), Effects Of Service Quality, Customer Satisfaction and Switching Barriers on Passenger Behavioral Intentions in Scheduled Coach Service,
Proceedings of the Eastern Asia
Society for Transportation Studies, Vol.4, October, 2003
30.Woodruff Robert B., Cadotte Ernest R., Jenkins Roger L., (1983) Modeling Consumer Satisfaction Processes Using Experience-Based Norms ,
31.Yoo, Boonghee and Naveen Donthu (2001), “Developing a Scale to Measure the Perceived Quality of an Internet Shopping Site (Sitequal),”
Quarterly Journal of Electronic Commerce, 2 (1), 31-46
32.Zeithaml V. A., (1988), Consumer
Perception of Price, Quality and Value: A Means end Model and Synthesis of Evidence, Journal of marketing, 52, 2-22
33.Zeithaml, A. Parasuraman, and Arvind Malhotra (2000), “A Conceptual Framework for Understanding e-Service Quality: Implications for Future Research and Managerial Practice,” working paper, report No. 00- 115, Marketing Science Institute,