R E V I E W
Open Access
Assessing general cognitive and adaptive
abilities in adults with Down syndrome: a
systematic review
Sarah Hamburg
1,2,3*, Bryony Lowe
2,3,4, Carla Marie Startin
1,2,3, Concepcion Padilla
5, Antonia Coppus
6,7,
Wayne Silverman
8, Juan Fortea
9,10,11, Shahid Zaman
5, Elizabeth Head
12, Benjamin L. Handen
13, Ira Lott
14,
Weihong Song
15and André Strydom
1,2,3Abstract
Background:Measures of general cognitive and adaptive ability in adults with Down syndrome (DS) used by previous studies vary substantially. This review summarises the different ability measures used previously, focusing on tests of intelligence quotient (IQ) and adaptive behaviour (AB), and where possible examines floor effects and differences between DS subpopulations. We aimed to use information regarding existing measures to provide recommendations for individual researchers and the DS research community.
Results:Nineteen studies reporting IQ test data met inclusion for this review, with 17 different IQ tests used. Twelve of these IQ tests were used in only one study while five were used in two different studies. Eleven studies reporting AB test data met inclusion for this review, with seven different AB tests used. The only AB scales to be used by more than one study were the Vineland Adaptive Behaviour Scale (VABS; used by three studies) and the Vineland Adaptive Behavior Scale 2nd Edition (VABS-II; used by two studies). A variety of additional factors were identified which make comparison of test scores between studies problematic, including different score types provided between studies (e.g. raw scores compared to age-equivalent scores) and different participant inclusion criteria (e.g. whether individuals with cognitive decline were excluded). Floor effects were common for IQ tests (particularly for standardised test scores). Data exists to suggest that floor effects may be minimised by the use of raw test scores rather than standardised test scores. Raw scores may, therefore, be particularly useful in longitudinal studies to track change in cognitive ability over time.
Conclusions:Studies assessing general ability in adults with DS are likely to benefit from the use of both IQ and AB scales. The DS research community may benefit from the development of reporting standards for IQ and AB data, and from the sharing of raw study data enabling further in-depth investigation of issues highlighted by this review.
Keywords:Down syndrome, Cognition, Intelligence, IQ, Adaptive behaviour, Adaptive ability, AB, General ability
Background
Down syndrome (DS) is the most common genetic cause of intellectual disability (ID), with an incidence of around 1 in 650–1000 live births worldwide [1]. DS oc-curs due to an extra copy of chromosome 21 (trisomy 21), typically in its entirety and in all cells. However, in
rarer cases of DS, only some cells have an extra copy of chromosome 21 (mosaicism) or only part of chromo-some 21 is triplicated by translocation (partial trisomy). People with DS may have significant cognitive impair-ments and typically have an intelligence quotient (IQ) ranging from 30 to 70, although IQs both above and below this range occur [2]. Cognitive domains that are particularly impaired in individuals with DS include lan-guage (especially expressive lanlan-guage), memory,
execu-tive function, and motor coordination. These
impairments can vary substantially among individuals
© The Author(s). 2019Open AccessThis article is distributed under the terms of the Creative Commons Attribution 4.0 International License (http://creativecommons.org/licenses/by/4.0/), which permits unrestricted use, distribution, and reproduction in any medium, provided you give appropriate credit to the original author(s) and the source, provide a link to the Creative Commons license, and indicate if changes were made. The Creative Commons Public Domain Dedication waiver (http://creativecommons.org/publicdomain/zero/1.0/) applies to the data made available in this article, unless otherwise stated. * Correspondence:[email protected]
1
Department of Forensic and Neurodevelopmental Sciences, Institute of Psychiatry, Psychology & Neuroscience, Kings College London, London SE5 8AF, UK
with DS and also within individuals due to advanced adult age and/or the development of dementia (for which people with DS are at an ultra-high risk [lifetime prevalence of dementia is estimated to be as high as 90% [3]], although considerable variability is present in terms of age at dementia onset and clinical presentation, as reviewed by Zigman and Lott [4]).
In addition to impairments in general cognitive ability, individuals with DS also have considerable limitations in adaptive behaviour (AB). Adaptive skills are defined as “the effectiveness with which the individual copes with the natural and social demands of his environment” [5]. Although they reflect distinct domains of functioning, adaptive skills/abilities are associated with general cogni-tive ability measured with IQ [2], suggesting AB scales may be used as an alternative for estimating the severity of ID in individuals when IQ assessment results are unavailable.
Due to the unique cognitive profile found in people
with DS (see [6]), it is necessary to understand how
useful and applicable different IQ tests and AB scales are for this population as an index of general abil-ities. Understanding the relationship between IQ and AB scores across the lifespan is also of importance as there is decline in both IQ and AB scores as
people with DS age [7, 8]. This is thought to be
as-sociated with the development of Alzheimer’s disease
(AD). However, other conditions such as untreated hypothyroidism or emergent neuropsychiatric symp-toms, such as the development of depression, may also impact capabilities and performance during as-sessments. Cohort effects, such as improvements in healthcare and education (including the phasing out of institutions), are also important considerations for cross-sectional studies [9].
IQ tests and AB scales are commonly used in DS studies to describe and compare participant samples, establish the impact of interventions/treatments or comorbidities, and track cognitive change with devel-opment and ageing. Such assessments may be particu-larly important in clinical trials of treatments to improve cognitive outcomes or to track the trajectory of decline due to advanced age or dementia. However, assessment of general ability in individuals with DS is complicated by floor-effects for many neuropsycho-logical tests that were developed for use within the
typically developing (TD) population [10–12]. In
addition, a relative weakness in language domains is often present for people with DS, which may compli-cate interpretation of performance on verbal tests and those with a large verbal component [13].
The aim of this systematic literature review is to summarise currently available literature on the differ-ent IQ and AB tests used previously with adults with
DS, with a particular focus on direct comparisons tween tests as well as differences in performance be-tween participant groups (younger adults and older adults with and without dementia) in order to make recommendations for future studies assessing general cognitive abilities in adults with DS, and also for the
wider DS research community (see Table 3).
Systematic review methods
Search strategy and selection criteria: IQ tests
The PubMed database was searched using the search terms (Down syndrome [MeSH Major Topic]) AND (“Intelligence Quotient” OR“IQ” [All Fields] OR “
Stan-ford-Binet test” [MeSH Major Topic] OR “K-BIT” [All
Fields] OR “BPVS” [All Fields] OR “Leiter” [All Fields] OR“Raven’s Matrices”[All Fields] OR“Wechsler scales”
[MeSH Terms] OR (“Wechsler” [All Fields] AND
“scales” [All Fields]) OR “Wechsler scales” [All Fields]
OR “WISC” [All Fields] OR “Peabody” [All Fields] OR
“WPPSI” [All Fields] OR “Otis-Lennon” [All Fields] OR “Differential Ability Scales” [All Fields] OR “ Woodcock-Johnson”[All Fields]) on 23 September 2018, identifying a total of 197 papers. Titles and abstracts were first screened to identify studies meeting the following cri-teria for inclusion: papers were written in English (trans-lations accepted), the study was published from 1990 onwards, and there was a minimum of 20 participants with DS aged 16 years or older included in the study. This brought the total number of eligible studies down to 75.
Full articles were then read in detail to identify which met the following additional inclusion criteria. We in-cluded tests of vocabulary, as these are often viewed as tests of general ability due to their strong correlation with IQ. Statistical data (including at least one of the following: mean, median, standard deviation, range, floor effects) from a named IQ or general ability test was provided. Where not all individuals in the study were 16 years or older or not all participants had a diagnosis of DS, papers were only included where separate statistical data (at least one of the following: mean, median, standard deviation, range, floor effects) was provided for participants with DS aged 16 years or older. This brought the total number of eligible studies down to 14. If the same or overlapping partic-ipants were used in multiple studies, we selected the main report for inclusion, discarding a further four papers. Additionally, reference lists of identified arti-cles were examined to identify other relevant studies, adding five papers, and a further four papers were in-cluded due to knowledge of the research area. This resulted in a total of 19 relevant papers.
available), and whether the study reported raw and/or standardised test scores was extracted from included papers.
Search strategy and selection criteria: AB scales
For AB scales in DS, the same database (PubMed)
was searched using the search terms (“Down
syn-drome” [MeSH Major Topic]) AND (“Adaptive
Behav-ior Scales” [All fields] OR “Vineland” [All fields] OR
“Adaptive Behavior Assessment System” [All fields]
OR “Diagnostic Adaptive Behavior Scale” [All fields]
OR “Adaptive Behavior” [All fields] OR “Every day
abilities” [All fields] OR “Scales of Independent
Behavior” [All fields] OR “Barthel Index” [All fields]
OR “Wessex Behaviour Scale” [All fields]) on 23
September 2018, identifying a total of 69 papers. AB papers were included in the review using the same criteria as for the IQ papers detailed above and dropped to 36 after screening the title and abstract. After reading the full article, 28 papers were dis-carded. Reference lists of identified articles were examined to identify other relevant studies, adding two papers. One additional paper was included due to knowledge of the research area. This left a total of 11 relevant papers.
All available data regarding sample size, age of partici-pants, AB scale used, test performance, floor effects (if available), and whether the study reported raw and/or standardised test scores was extracted from included papers.
IQ and general ability tests in people with DS
Tests
Nineteen studies, comprising 1455 participants (range 26–305 participants), meeting inclusion criteria that re-ported IQ or general ability test scores are shown in
Table 1. A wide range of ages are included in this
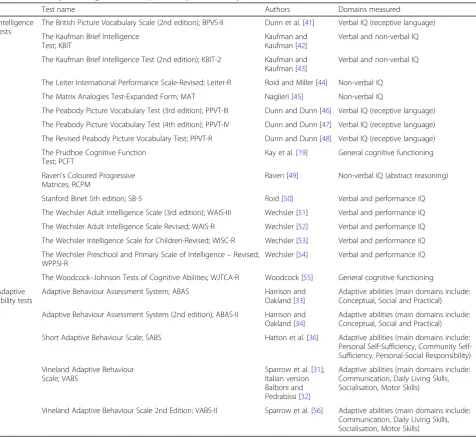
re-view, with the oldest participant being 71 years old. A brief description of all tests identified within this review is provided in theAppendixTable 4.
In total, 17 different IQ or general ability tests were used across the 19 identified studies. Twelve of these IQ tests were used in only one study while five were used in two different studies. These five tests were the Kaufman Brief Intelligence Test 2nd edition (KBIT-2) [11, 16], the Wechsler Intelligence Scale for Children-Revised (WISC-R) [24, 25], Raven’s Coloured Progressive Matrices (RCPM) [13, 22], the British Pic-ture Vocabulary Scale 2nd edition (BPVS-II) [12, 23], and the Peabody Picture Vocabulary Test 4th edition (PPVT-IV) [14, 26].
In addition to this, different versions of the same test were used by a number of studies. These included the Peabody Picture Vocabulary Test-Revised (PPVT-R) and
the Peabody Picture Vocabulary Test 3rd edition (PPVT-III) [7,13], in addition to the Leiter International
Performance Scale-Revised (Leiter-R) [10] and a brief
version of this test [12]. The Wechsler Adult Intelligence Scale-III (WAIS-III; Portuguese version) and Wechsler Adult Intelligence Scale Revised were also each used once. Furthermore, de Sola et al. [17] used the Spanish version of the KBIT.
Five tests were used in only one study and also had no alternative versions used. These included the Prudhoe
Cognitive Function Test (PCFT), the
Woodcock-Johnson Tests of Cognitive Ability-Revised (WJTCA-R), the Matrix Analogies Test-Expanded Form (MAT), the
Wechsler Preschool and Primary Scale of Intelligence—
revised version (WPPSI-R), and the Stanford Binet 5th edition.
Participant samples
Although some studies have used the same or differ-ent versions of the same test, comparison between studies is complicated by differing participant inclu-sion criteria. For example, some studies grouped par-ticipants by dementia status and provide separate test results for each group [11, 16], or only include indi-viduals without a diagnosis of dementia or noticeable decline [8, 19, 20, 23–26], while in other studies these participants are included in the overall sample [7, 13]. Different criteria to define and/or detect dementia were also used between studies.
Furthermore, some studies restricted inclusion to more able participants. For example, “participants were required to have sufficient verbal ability to be inter-viewed” [20], participants were required to have “verbal oral language skills” [18], inclusion of participants with mild-moderate ID only [24], inclusion criteria of IQ > 30 [25], inclusion criteria of a mental age above 2.5 years in addition to at least minimal verbal communication [14], inclusion criteria of receptive language > 3 years. [26], and the inclusion of individuals not at floor only [13]. All such studies were still included in this review, despite differing individual inclusion criteria. Such differ-ing criteria will substantially skew floor effects between
studies and make comparison between studies
problematic.
Floor effects
Nine of the 17 studies reported data on floor effects
for the IQ or general ability tests they used [10–12,
14, 16, 17, 23–25]. Additionally, floor effects were
alluded to by Das et al. [7], who indicated the MAT
was “too difficult for most participants”. Of the
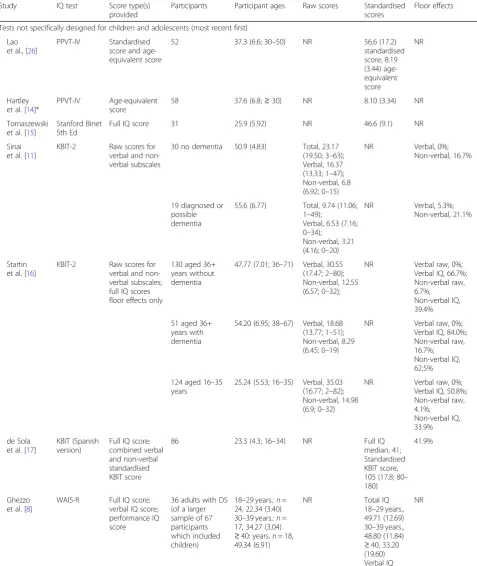
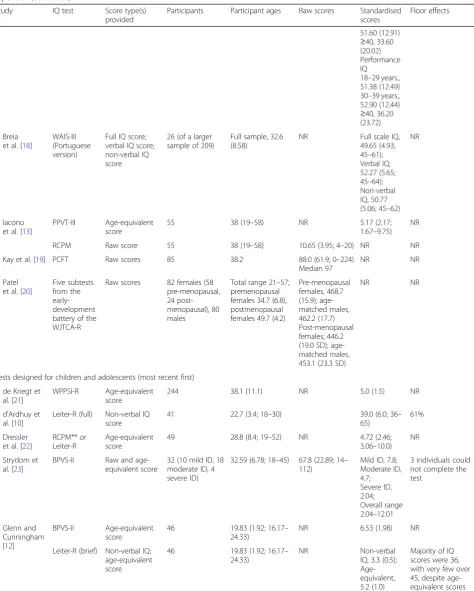
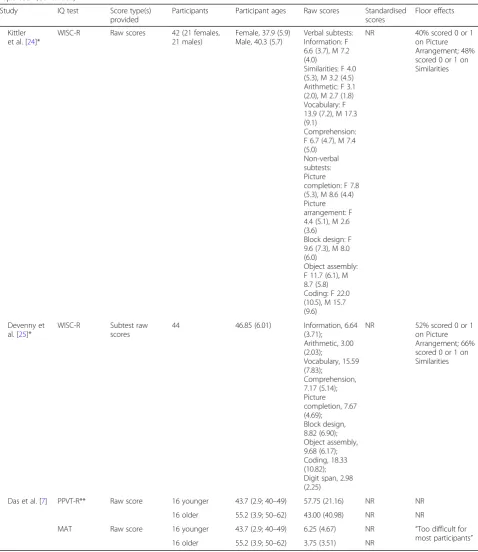
Table 1Summary of studies using intelligence tests in adults with DS. Tests are arranged into those not specifically designed for children and adolescents and those that are. AB tests not shown (see Table2). Ages and age-equivalents given in years; where given in months in original papers these have been converted. Ages and scores given as mean (SD; range). NR indicates“not reported”
Study IQ test Score type(s) provided
Participants Participant ages Raw scores Standardised scores
Floor effects
Tests not specifically designed for children and adolescents (most recent first)
Lao et al., [26]
PPVT-IV Standardised score and age-equivalent score
52 37.3 (6.6; 30–50) NR 56.6 (17.2) standardised score; 8.19 (3.44) age-equivalent score
NR
Hartley et al. [14]*
PPVT-IV Age-equivalent score
58 37.6 (6.8;≥30) NR 8.10 (3.34) NR
Tomaszewski et al. [15]
Stanford Binet 5th Ed
Full IQ score 31 25.9 (5.92) NR 46.6 (9.1) NR
Sinai et al. [11]
KBIT-2 Raw scores for verbal and non-verbal subscales
30 no dementia 50.9 (4.83) Total, 23.17 (19.50; 3–63); Verbal, 16.37 (13.33; 1–47); Non-verbal, 6.8 (6.92; 0–15)
NR Verbal, 0%; Non-verbal, 16.7%
19 diagnosed or possible dementia
55.6 (6.77) Total, 9.74 (11.06; 1–49);
Verbal, 6.53 (7.16; 0–34);
Non-verbal, 3.21 (4.16; 0–20)
NR Verbal, 5.3%; Non-verbal, 21.1%
Startin et al. [16]
KBIT-2 Raw scores for verbal and non-verbal subscales; full IQ scores floor effects only
130 aged 36+ years without dementia
47.77 (7.01; 36–71) Verbal, 30.55 (17.47; 2–80); Non-verbal, 12.55 (6.57; 0–32);
NR Verbal raw, 0%; Verbal IQ, 66.7%; Non-verbal raw, 6.7%;
Non-verbal IQ, 39.4%
51 aged 36+ years with dementia
54.20 (6.95; 38–67) Verbal, 18.68 (13.77; 1–51); Non-verbal, 8.29 (6.45; 0–19)
NR Verbal raw, 0%; Verbal IQ, 84.0%; Non-verbal raw, 16.7%; Non-verbal IQ, 62.5%
124 aged 16–35 years
25.24 (5.53; 16–35) Verbal, 35.03 (16.77; 2–82); Non-verbal, 14.98 (6.9; 0–32)
NR Verbal raw, 0%; Verbal IQ, 50.8%; Non-verbal raw, 4.1%;
Non-verbal IQ, 33.9%
de Sola et al. [17]
KBIT (Spanish version)
Full IQ score; combined verbal and non-verbal standardised KBIT score
86 23.3 (4.3; 16–34) NR Full IQ
median, 41; Standardised KBIT score, 105 (17.8; 80– 180)
41.9%
Ghezzo et al. [8]
WAIS-R Full IQ score; verbal IQ score; performance IQ score
36 adults with DS (of a larger sample of 67 participants which included children)
18–29 years.:n= 24, 22.34 (3.40) 30–39 years.:n= 17, 34.27 (3.04) ≥40: years.n= 18, 49.34 (6.91)
NR Total IQ
18–29 years., 49.71 (12.69) 30–39 years., 48.80 (11.84) ≥40, 33.20 (19.60) Verbal IQ 18–29 years., 53.43 (13.02) 30–39 years.,
Table 1Summary of studies using intelligence tests in adults with DS. Tests are arranged into those not specifically designed for children and adolescents and those that are. AB tests not shown (see Table2). Ages and age-equivalents given in years; where given in months in original papers these have been converted. Ages and scores given as mean (SD; range). NR indicates“not reported”(Continued)
Study IQ test Score type(s) provided
Participants Participant ages Raw scores Standardised scores
Floor effects
51.60 (12.91) ≥40, 33.60 (20.02) Performance IQ
18–29 years., 51.38 (12.49) 30–39 years., 52.90 (12.44) ≥40, 36.20 (23.72)
Breia et al. [18]
WAIS-III (Portuguese version)
Full IQ score; verbal IQ score; non-verbal IQ score
26 (of a larger sample of 209)
Full sample, 32.6 (8.58)
NR Full scale IQ, 49.65 (4.93; 45–61); Verbal IQ, 52.27 (5.65; 45–64); Non-verbal IQ, 50.77 (5.06; 45–62)
NR
Iacono et al. [13]
PPVT-III Age-equivalent score
55 38 (19–58) NR 5.17 (2.17;
1.67–9.75) NR
RCPM Raw score 55 38 (19–58) 10.65 (3.95; 4–20) NR NR
Kay et al. [19] PCFT Raw scores 85 38.2 88.0 (61.9; 0–224) Median 97
NR NR
Patel et al. [20]
Five subtests from the early-development battery of the WJTCA-R
Raw scores 82 females (58 pre-menopausal, 24 post-menopausal), 80 males
Total range 21–57; premenopausal females 34.7 (6.8), postmenopausal females 49.7 (4.2)
Pre-menopausal females, 468.7 (15.9); age-matched males, 462.2 (17.7) Post-menopausal females; 446.2 (19.0 SD); age-matched males, 453.1 (23.3 SD)
NR NR
Tests designed for children and adolescents (most recent first)
de Knegt et al. [21]
WPPSI-R Age-equivalent score
244 38.1 (11.1) NR 5.0 (1.5) NR
d’Ardhuy et al. [10]
Leiter-R (full) Non-verbal IQ score
41 22.7 (3.4; 18–30) 39.0 (6.0; 36– 65)
61%
Dressler et al. [22]
RCPM** or Leiter-R
Age-equivalent score
49 28.8 (8.4; 19–52) NR 4.72 (2.46; 3.06–10.0)
NR
Strydom et al. [23]
BPVS-II Raw and age-equivalent score
32 (10 mild ID, 18 moderate ID, 4 severe ID)
32.59 (6.78; 18–45) 67.8 (22.89; 14– 112)
Mild ID, 7.8; Moderate ID, 4.7; Severe ID, 2.04; Overall range 2.04–12.01
3 individuals could not complete the test
Glenn and Cunningham [12]
BPVS-II Age-equivalent score
46 19.83 (1.92; 16.17– 24.33)
NR 6.53 (1.98) NR
Leiter-R (brief) Non-verbal IQ; age-equivalent score
46 19.83 (1.92; 16.17– 24.33)
NR Non-verbal
IQ, 3.3 (0.5); Age-equivalent, 5.2 (1.0)
Table 1Summary of studies using intelligence tests in adults with DS. Tests are arranged into those not specifically designed for children and adolescents and those that are. AB tests not shown (see Table2). Ages and age-equivalents given in years; where given in months in original papers these have been converted. Ages and scores given as mean (SD; range). NR indicates“not reported”(Continued)
Study IQ test Score type(s) provided
Participants Participant ages Raw scores Standardised scores
Floor effects
Kittler et al. [24]*
WISC-R Raw scores 42 (21 females, 21 males)
Female, 37.9 (5.9) Male, 40.3 (5.7)
Verbal subtests: Information: F 6.6 (3.7), M 7.2 (4.0)
Similarities: F 4.0 (5.3), M 3.2 (4.5) Arithmetic: F 3.1 (2.0), M 2.7 (1.8) Vocabulary: F 13.9 (7.2), M 17.3 (9.1)
Comprehension: F 6.7 (4.7), M 7.4 (5.0)
Non-verbal subtests: Picture completion: F 7.8 (5.3), M 8.6 (4.4) Picture arrangement: F 4.4 (5.1), M 2.6 (3.6)
Block design: F 9.6 (7.3), M 8.0 (6.0)
Object assembly: F 11.7 (6.1), M 8.7 (5.8) Coding: F 22.0 (10.5), M 15.7 (9.6)
NR 40% scored 0 or 1 on Picture Arrangement; 48% scored 0 or 1 on Similarities
Devenny et al. [25]*
WISC-R Subtest raw scores
44 46.85 (6.01) Information, 6.64 (3.71);
Arithmetic, 3.00 (2.03);
Vocabulary, 15.59 (7.83);
Comprehension, 7.17 (5.14); Picture completion, 7.67 (4.69);
Block design, 8.82 (6.90); Object assembly, 9.68 (6.17); Coding, 18.33 (10.82); Digit span, 2.98 (2.25)
NR 52% scored 0 or 1 on Picture Arrangement; 66% scored 0 or 1 on Similarities
Das et al. [7] PPVT-R** Raw score 16 younger 43.7 (2.9; 40–49) 57.75 (21.16) NR NR 16 older 55.2 (3.9; 50–62) 43.00 (40.98) NR NR
MAT Raw score 16 younger 43.7 (2.9; 40–49) 6.25 (4.67) NR “Too difficult for most participants” 16 older 55.2 (3.9; 50–62) 3.75 (3.51) NR
verbal response [18, 20], and one study only included individuals above floor levels [13].
Studies using standardised test scores reported
particularly large floor effects. These were as high as 61% for the Leiter-R [10]. Glenn and Cunningham [12] also reported large floor effects for the brief Leiter-R (the“majority”of test scores were at floor). For the KBIT (Spanish version), de Sola et al. [17] reported floor ef-fects of 41.9% for standardised IQ scores. When examin-ing KBIT-2 IQ subscales independently, Startin et al. [16] reported floor effects of 66.7% for verbal IQ and 39.4% for non-verbal IQ (adults aged 36+ without a clinical diagnosis of dementia).
For studies reporting IQ test raw scores, using the
WISC-R, Kittler et al. [24] reported 40% and 48% of
participants scored 0 or 1 on the first administration of the picture arrangement subtest and the similarities subtest, respectively. Devenny et al. [25] also reported high floor effects for these same subscales (52% and 66%, respectively). In contrast to this, when analysing
KBIT-2 raw scores, two studies [11, 16] found no or
limited floor effects for the verbal subscale (based on receptive language rather than expressive language).
The KBIT-2 non-verbal subscale had moderate floor effects across both younger (YA) and older adults (OA), and these increased substantially in participants
with dementia (see Fig. 1). Raw scores were also used
by Strydom et al. [23] on the BPVS-II, with moderate
floor effects (9.4%) reported.
Comparison between IQ test scores Age-equivalent scores
Two IQ tests were identified for which age-equivalent scores were reported by more than one study. Using the BPVS-II (which provides an estimate of receptive
language), Glenn and Cunningham [12] reported a
mean age-equivalent score of 6.5 years for their
sam-ple of younger adults with DS (age range 16–24
years). Strydom et al. [23] reported BPVS-II mean
age-equivalent scores separately for participants with mild, moderate, and severe ID (7.8 years, 4.7 years, and 2.0 years, respectively). Interestingly, Glenn and
Cunningham [12] also provided non-verbal
age-equivalent scores for their participants, using the Brief Leiter-R (mean 5.2 years). Although the higher mean
verbal age-equivalent score in this study compared to mean non-verbal (6.5 vs 5.2 years) is not consistent with the cognitive profile associated with DS, the dif-ference is small and SD scores overlap.
Using the PPVT-IV (which also provides a measure of receptive language), Hartley et al. [14] reported a mean age-equivalent score of 8.1 years for their sample of adults with DS aged 30 years or older. Using the same test, Lao et al. [26] reported a mean age-equivalent score of 8.2 years for their sample of adults with DS aged 30 years or older. A lower mean receptive vocabulary age-equivalent score was reported by Iacono et al. using the PPVT-III (5.2 years) [13]. However, 18% of this sample were reported to have diagnosed or suspected dementia, and so comparison between these and the above studies (which did not include people with dementia) is problematic.
Standardised test scores
Standardised IQ test scores were reported by seven iden-tified studies. Full IQ scores (including both verbal and
non-verbal subscales) included a median IQ of 41 [17]
(Spanish version of KBIT), a mean IQ of 46.6 (Stanford Binet 5th Edition) [15], a mean IQ of 49.7 (Portuguese version of WAIS-III) [18], and mean IQs of 49.7, 48.8, and 33.2 for different age groups of adults with DS
(WAIS-R) [8]. Standardised mean verbal IQ scores
in-cluded 53.4, 51.6, and 33.6 for these age groups using
the WAIS-R [8], with other studies reporting
standar-dised mean verbal IQ scores of 52.3 (Portuguese version of WAIS-III; [18]) and 56.6 (PPVT-IV; [26]). Standar-dised mean non-verbal IQ test scores included 39.3 [12] (brief Leiter-R), 39.0 [10] (full Leiter-R), and 50.8 [18] (Portuguese version of WAIS-III), with Ghezzo et al. reporting 51.4, 52.9, and 36.2 for their different age groups [8].
It is important to note that the lowest full IQ score ob-tainable on the Leiter-R is 36, and the Stanford Binet 4th Ed supports calculation of IQ scores lower than 40, whereas the lowest full IQ score for the KBIT and WAIS-II are 40 and 45, respectively. It is therefore pos-sible the results reported here are influenced by differing floor levels between tests. Furthermore, floor effects may substantially influence mean test scores. Apart from the high floor effect in standardised IQ tests, it is also worthwhile noting that standardised scoring may result in inflated estimates of true abilities near floor levels, which may differ between tests [27].
Raw test scores
Raw tests scores are only useful to compare between studies when the same test has been used. The
KBIT-2 has been used in more than one study [11, 16].
These two papers are published by one group and it should be noted that although there is no overlap in data, there is some overlap between participants (31 individuals from Sinai et al. were later recruited by Startin et al.).
Both studies found a wide range of raw scores for
both subscales of the KBIT-2 (see Fig. 2). When
examining scores across participant groups (younger adults (YA), older adults without dementia (OA-ND), and older adults with dementia (OA-D)), verbal and non-verbal subscale means and ranges reported by
Startin et al. [16] appear relatively similar between
YA and OA-ND but were lower in OA-D. Sinai et al.
[11] also reported similar reductions in verbal and
non-verbal mean scores and ranges between OA-ND and OA-D (YA not included in this study). Overall, these studies demonstrate that raw KBIT-2 scores can be obtained from a range of individuals with DS, in-cluding many individuals with dementia.
Raw scores from the WISC-R have been used in two studies [24, 25]. Neither study split participants by age and only included individuals with no decline; therefore, raw test scores between groups cannot be compared. However, Kittler et al. [24] used these scores to explore sex differences in DS and reported females performed significantly better than males on the coding subtest (part of the non-verbal IQ subscale).
AB scales in people with DS
Tests
Eleven studies using AB scales in DS were identified
for inclusion in this review (see Table 2). A total of
848 participants took part in the studies, ranging from 16 to 71 years old. The only AB scales to be used by more than one study were the Vineland Adaptive Behaviour Scale (VABS) and the second edition of this scale (VABS-II).
The Vineland Adaptive Behaviour Scale (VABS [31])
was used by Witts and Elders [30], Kishnani et al.
[29], and Ghezzo et al. [8], while Dressler et al. [22]
used an Italian version of this scale [32]. The
VABS-II was used by Hartley et al., Gilmore and Cuskelly, and Tomaszewski et al. [14, 15, 28]. The Adaptive
Be-haviour Assessment System (ABAS [33]) was used by
Strydom et al. [23], and de Sola et al. [17] used the
second edition of this scale (ABAS-II [34]). The
Adaptive Behaviour Scale (ABS [35]) was used by Kay
et al. [19], and the Short Adaptive Behaviour Scale
(SABS [36]), adapted from a later version of the ABS
[37], was used by Startin et al. [16].
Floor effects
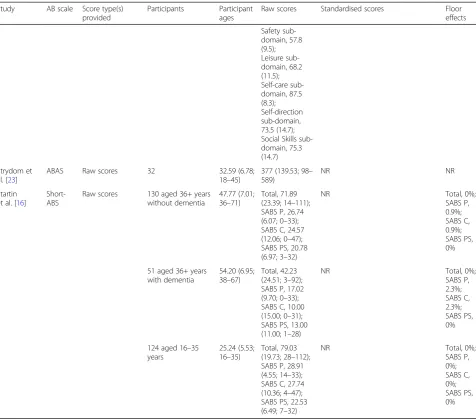
Two studies reported floor effect data for the AB
reported total SABS scores had no floor effects in any group of participants investigated (YA, ND, OA-D). However, when split into its 3 subscales, small floor effects were found. In participants aged 36+ without dementia, floor effects were found in the per-sonal self-sufficiency and community self-sufficiency domains (0.9% for both). For participants aged 36+ with dementia, floor effects were also found in the same two domains (2.3% for both). Kishnani et al.
[29] reported no participants were at floor on the
VABS. Participants in this study were aged 18–38 and
did not have dementia.
Comparisons between AB scales
Two studies reporting age-equivalent scores from dif-ferent versions of the VABS found similar mean age-equivalent scores. This was reported as 8.5 years and 7.3 years for Witts and Elders [30] and Dressler et al.
[22], respectively. Minimum age-equivalent scores
be-tween these two studies were also similar (3.1 years and 3.7 years); however, maximum scores differed
(10.0 years and 18.5 years). Kishnani et al. [29]
reported mean Composite Supplemental Norm Score from the VABS. The results of these this study are therefore not comparable to those of Witts and Elders [30] and Dressler et al. [22]. The three studies using the VABS-II all reported mean Adaptive Behavior Composite scores of 51.86 [28], 52.6 [15], and 183.67 [14]. It is likely the latter of these scores is greater because for this study participants were required to have a mental age of above 2.5 in addition to at least minimal verbal communication, whereas the former two studies had no such inclusion criteria.
Two identified studies reported raw scores of
differ-ent versions of the ABAS. de Sola et al. [17] found
an overall mean test score of 636 (91 SD) and a range from 220 to 627 using the ABAS-II. In
con-trast, Strydom et al. [23] reported a mean raw ABAS
score of 377 (140 SD) and a range of 98–589 (for
further details see Table 2).
Comparisons between IQ tests and AB scales
de Sola et al. [17] analysed the association between IQ and AB using standardised KBIT IQ scores and raw
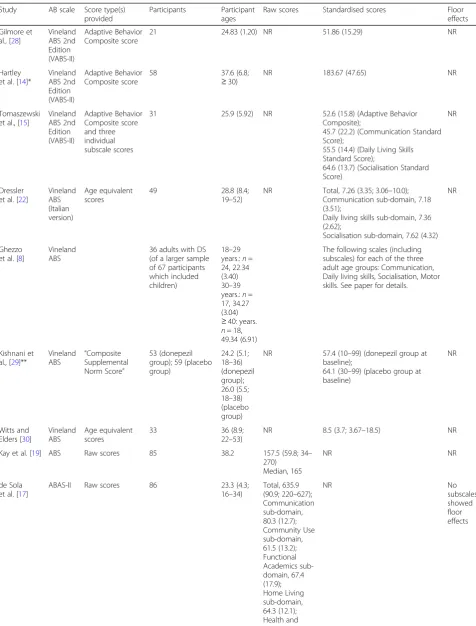
Table 2Summary of studies using adaptive ability tests in adults with DS. NR indicates“not reported.”IQ test results not shown (see Table1)
Study AB scale Score type(s) provided
Participants Participant ages
Raw scores Standardised scores Floor effects
Gilmore et al., [28]
Vineland ABS 2nd Edition (VABS-II)
Adaptive Behavior Composite score
21 24.83 (1.20) NR 51.86 (15.29) NR
Hartley et al. [14]*
Vineland ABS 2nd Edition (VABS-II)
Adaptive Behavior Composite score
58 37.6 (6.8;
≥30)
NR 183.67 (47.65) NR
Tomaszewski et al., [15]
Vineland ABS 2nd Edition (VABS-II)
Adaptive Behavior Composite score and three individual subscale scores
31 25.9 (5.92) NR 52.6 (15.8) (Adaptive Behavior Composite);
45.7 (22.2) (Communication Standard Score);
55.5 (14.4) (Daily Living Skills Standard Score);
64.6 (13.7) (Socialisation Standard Score)
NR
Dressler et al. [22]
Vineland ABS (Italian version)
Age equivalent scores
49 28.8 (8.4;
19–52)
NR Total, 7.26 (3.35; 3.06–10.0); Communication sub-domain, 7.18 (3.51);
Daily living skills sub-domain, 7.36 (2.62);
Socialisation sub-domain, 7.62 (4.32) NR
Ghezzo et al. [8]
Vineland ABS
36 adults with DS (of a larger sample of 67 participants which included children)
18–29 years.:n= 24, 22.34 (3.40) 30–39 years.:n= 17, 34.27 (3.04) ≥40: years. n= 18, 49.34 (6.91)
The following scales (including subscales) for each of the three adult age groups: Communication, Daily living skills, Socialisation, Motor skills. See paper for details.
Kishnani et al., [29]**
Vineland
ABS “
Composite Supplemental Norm Score”
53 (donepezil group); 59 (placebo group)
24.2 (5.1; 18–36) (donepezil group); 26.0 (5.5; 18–38) (placebo group)
NR 57.4 (10–99) (donepezil group at baseline);
64.1 (30–99) (placebo group at baseline)
NR
Witts and Elders [30]
Vineland ABS
Age equivalent scores
33 36 (8.9;
22–53)
NR 8.5 (3.7; 3.67–18.5) NR
Kay et al. [19] ABS Raw scores 85 38.2 157.5 (59.8; 34– 270)
Median, 165
NR NR
de Sola et al. [17]
ABAS-II Raw scores 86 23.3 (4.3; 16–34)
Total, 635.9 (90.9; 220–627); Communication sub-domain, 80.3 (12.7); Community Use sub-domain, 61.5 (13.2); Functional Academics sub-domain, 67.4 (17.9); Home Living sub-domain, 64.3 (12.1); Health and
NR No
ABAS-II scores. A significant difference was found be-tween participants with an IQ above and below 40 for most functional skill areas assessed by the ABAS-II, in addition to ABAS-II total score (mean group difference
for total ABAS-II score 63.4; p= 0.001). This suggests
that participants with DS with a higher IQ may have greater competence in daily living and also demonstrates a potential relationship between IQ and AB scales in adults with DS.
AB scales may also correlate with performance on other tests of IQ. Using raw scores of the PCFT and the ABS, Kay et al. [19] noted a highly significant correlation between these two tests (r= 0.87; p< 0.001). This study
provides further evidence that AB and IQ may be related in adults with DS.
In contrast to the findings of these two studies,
Dressler et al. [22] found no association between AB
and IQ. In this study, IQ tests (either RCPM or the Leiter-R) were used to classify participants by level of ID (mild, moderate, or severe), and VABS scores (Italian version) were compared between groups. No statistically significant differences in VABS scores were observed between groups. However, it is of note that VABS raw scores were not used in this analysis. Instead, VABS raw scores were categorised on an in-dividual basis as above average, average, or below
Table 2Summary of studies using adaptive ability tests in adults with DS. NR indicates“not reported.”IQ test results not shown (see Table1)(Continued)
Study AB scale Score type(s) provided
Participants Participant ages
Raw scores Standardised scores Floor effects
Safety sub-domain, 57.8 (9.5); Leisure sub-domain, 68.2 (11.5); Self-care sub-domain, 87.5 (8.3); Self-direction sub-domain, 73.5 (14.7); Social Skills sub-domain, 75.3 (14.7)
Strydom et al. [23]
ABAS Raw scores 32 32.59 (6.78;
18–45)
377 (139.53; 98– 589)
NR NR
Startin et al. [16]
Short-ABS
Raw scores 130 aged 36+ years without dementia
47.77 (7.01; 36–71)
Total, 71.89 (23.39; 14–111); SABS P, 26.74 (6.07; 0–33); SABS C, 24.57 (12.06; 0–47); SABS PS, 20.78 (6.97; 3–32)
NR Total, 0%;
SABS P, 0.9%; SABS C, 0.9%; SABS PS, 0%
51 aged 36+ years with dementia
54.20 (6.95; 38–67)
Total, 42.23 (24.51; 3–92); SABS P, 17.02 (9.70; 0–33); SABS C, 10.00 (15.00; 0–31); SABS PS, 13.00 (11.00; 1–28)
NR Total, 0%;
SABS P, 2.3%; SABS C, 2.3%; SABS PS, 0%
124 aged 16–35 years
25.24 (5.53; 16–35)
Total, 79.03 (19.73; 28–112); SABS P, 28.91 (4.55; 14–33); SABS C, 27.74 (10.36; 4–47); SABS PS, 22.53 (6.49; 7–32)
NR Total, 0%;
SABS P, 0%; SABS C, 0%; SABS PS, 0%
average, relative to mean VABS score for each group. It is possible this approach to analysis prevented the detection of a significant difference in AB scores be-tween groups.
Discussion
We aimed to provide a systematic review of the lit-erature regarding tests of IQ and AB used in adults with DS, in order to make recommendations regard-ing the use of such tests with this population. Overall a wide variety of different IQ tests and AB scales were identified, with a wide range of differing score types provided (including raw scores, age-equivalent scores, full IQ scores, verbal IQ scores, and non-ver-bal/performance IQ scores). Studies largely differed in criteria for participant inclusion (e.g. only those able to complete tests) and in the reporting of test results by sub-populations. There was also little overlap in the tests used between studies. Together, these factors
make the comparison of tests between studies
problematic.
Where reported, floor effects for IQ tests were par-ticularly high for standardised test scores. Floor ef-fects for raw total BPVS-II scores and raw WISC-R sub-scores were moderate (around 9%) and high (around 50%), respectively. In contrast, floor effects reported for KBIT-2 raw scores were minimal. Verbal raw KBIT-2 scores were particularly low (including for participants with dementia). The number of par-ticipants at floor for AB scales was only reported by
one study [16]. This study found no floor effects
using total raw SABS scores (including for individ-uals with dementia); however, when subdomains of this test were examined, small floor effects were seen for two out of three subdomains. Further, although Kay et al. [19] did not explicitly report floor effects using the ABS, the authors noted that floor effects were less marked on this scale compared to the IQ test used in the study (the PCFT). Together, these findings indicate that raw KBIT-2 scores and raw AB scores may be particularly suited to tracking longitu-dinal change in adults with DS, due to minimal floor effects on these measures prior to the onset of cogni-tive decline.
Although it appears that raw scores may benefit from reduced floor effects compared to standardised scores, it should be noted that the use of raw scores has various limitations. This includes the inability to directly compare level of functioning to that of the TD population (in contrast to the use of standardised or age-equivalent IQ scores, through which this is inherently possible). Additionally, the clinical signifi-cance of differences in raw score values both between
and within individuals over time has not yet been established.
In some studies, child versions of IQ tests (e.g. WISC instead of WAIS) have been used in adults with DS [21, 24, 25]. While this might limit floor ef-fects and should therefore be more sensitive to differ-ences in performance, age-adjusted IQ norms are only available for children, and therefore only age-equiva-lent or raw scores can be used in adults. Age appro-priateness could also be an issue. The generalisability of IQ tests and AB scales in general is an important issue that warrants further investigation. Specifically, the tests identified here were developed in Western populations, and most were developed for use in TD individuals.
Many IQ tests identified in this review are
dependent on language. Significant relative weak-nesses in language are a characteristic feature of the cognitive profile for individuals with DS [38, 39] (see
review by Silverman [6]). The use of language-based
IQ tests in this population is therefore problematic as specific deficits in language may mask the true
level of individuals’ general ability and skew group
test results. Accordingly, some studies identified in this review excluded participants without sufficient verbal skills. Non-verbal/performance subscales on IQ tests are less likely to be substantially influenced by language and so may be more appropriate for use in this population. However, studies utilising these subscales have reported higher floor effects compared
to verbal subscales [11, 16]. It is also worthwhile
noting that IQ tests with language as an integral component require substantial translation and subse-quent revalidation for use in different language-speaking populations. For larger international studies, translation into different languages is a particular barrier, and so non-verbal/performance tests may be preferable to verbal tests. Future research could ex-plore the use of simple non-verbal/performance tests that could be used in people with DS with lower floor effects, though it will need to be established if this would over-estimate IQ.
In this review, “floor” refers to the lowest possible score obtainable on a particular test. However, it may be more appropriate to discuss floor effects in reference to the lowest score below which a decline of significance cannot be detected, for example, two standard errors of the mean (SEM) above the lowest score. Floor effects discussed in this review may therefore be underestimated.
It is likely other IQ tests exist that may be suitable for adults with DS but were not utilised by any stud-ies identified in this review. In particular, d’Ardhuy
appropriate standardised IQ test for use in people with DS compared to the Leiter-R. This is based on a clinical trial of 180 individuals with DS (Clinical. Trials.gov identifier NCT01920633) which reported a
floor effect of only 1% with this IQ test [10].
Fur-thermore, the potential utility of the Stanford-Binet IQ test in individuals with DS has been highlighted by other studies that did not meet inclusion criteria
of this review. For example, Silverman et al. [40]
demonstrated a strong linear correlation between IQ score measured on the Stanford-Binet and the WAIS
(r= .818) in individuals with an ID (70.3% with DS),
confirming that the two scales measured the same underlying construct(s). However, IQ estimates using the WAIS were consistently higher in this study, and more than 85% of individuals with DS had IQ scores that were more than 10 points higher on the WAIS compared to the Stanford-Binet, indicating direct comparison of standardised IQ scores between these two tests requires further validation. Future research should further explore the use of these IQ tests in adults with DS.
With regards to AB measures, three measures were
commonly used: the Vineland adaptive behavior
scales, the Adaptive Behavior Scale (ABS, including its short form), and the Adaptive Behaviour Assessment System (2nd edition; ABAS-II). These measures did not have significant floor effects and in two identified
studies showed a correlation with IQ test scores [17,
19]. This suggests that AB measures are a useful
addition to research studies of cognitive abilities in individuals with DS alongside IQ testing and may allow for an assessment of general ability in individ-uals with DS who cannot engage with IQ tests or who are at floor for IQ tests.
AB measures may represent a broader construct compared to IQ and are likely to be influenced by an individual’s physical abilities as well as their training and support to maintain independence. Nevertheless, the studies reviewed here demonstrated that AB mea-sures can be useful in tracking change in general abil-ities over time, and showed significant differences in scores between groups defined by age or dementia status. Further research is required to demonstrate the relationship between different subscales of AB measures such as the VABS and IQ scores, and be-tween different AB scales. The particular strengths and weaknesses of AB domains in DS should be established, and the development of shorter versions of AB measures will be desirable.
Conclusions
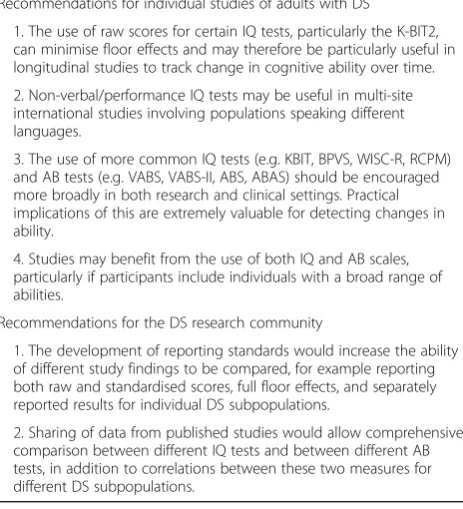
Recommendations following this review have been
summarised in Table 3. The main recommendations
are that the use of raw scores for certain IQ tests such as the K-BIT2 can minimise floor effects and may therefore be particularly useful in longitudinal studies, though it must be acknowledged that the sig-nificance of changes in raw scores are currently un-certain. The use of more common IQ tests (e.g. KBIT, BPVS, WISC-R, RCPM) and AB tests (e.g. VABS, ABS, ABAS) should be encouraged more broadly in both research and clinical settings while the use of non-verbal/performance IQ tests may be preferable in multi-site international studies involving populations speaking different languages. Finally, stud-ies may benefit from the use of both IQ and AB scales, particularly if participants include individuals with a broad range of abilities.
It is also apparent from this review that there is likely a wealth of raw IQ and AB test data that has not been included in the studies identified here. Furthermore, it is apparent that a potential limitation of the current re-search field is that many studies do not exclude (or ana-lyse separately) individuals with cognitive decline or dementia, or individuals with a non-trisomy 21 form of DS. The research community may therefore benefit from an effort to share such data in order to make full and valid comparisons between scales and between different subpopulations of individuals with DS. Such information is likely to be of benefit to both clinicians and researchers.
Table 3Recommendations for future studies of adults with DS and for the DS research community
Recommendations for individual studies of adults with DS
1. The use of raw scores for certain IQ tests, particularly the K-BIT2, can minimise floor effects and may therefore be particularly useful in longitudinal studies to track change in cognitive ability over time.
2. Non-verbal/performance IQ tests may be useful in multi-site international studies involving populations speaking different languages.
3. The use of more common IQ tests (e.g. KBIT, BPVS, WISC-R, RCPM) and AB tests (e.g. VABS, VABS-II, ABS, ABAS) should be encouraged more broadly in both research and clinical settings. Practical implications of this are extremely valuable for detecting changes in ability.
4. Studies may benefit from the use of both IQ and AB scales, particularly if participants include individuals with a broad range of abilities.
Recommendations for the DS research community
1. The development of reporting standards would increase the ability of different study findings to be compared, for example reporting both raw and standardised scores, full floor effects, and separately reported results for individual DS subpopulations.
Appendix
Abbreviations
AB:Adaptive behaviour; ABAS: Adaptive Behaviour Assessment System; ABAS-II: Adaptive Behaviour Assessment System 2nd edition; ABS: Adaptive Behaviour Scale; BPVS-II: The British Picture Vocabulary Scale 2nd edition; IQ: Intelligence quotient; KBIT: Kaufman Brief Intelligence Test; KBIT-2: Kaufman Brief Intelligence Test 2nd edition; Leiter-r: Leiter International Performance Scale Revised; MAT: Matrix Analogies Test-Expanded Form; D: Older adults with dementia; OA-ND: Older adults without dementia; PCFT: Prudhoe Cognitive Function Test; III: Peabody Picture Vocabulary Test 3rd edition; PPVT-IV: Peabody Picture Vocabulary Test 4th edition; PPVT-R: Revised Peabody Picture Vocabulary Test; RCPM: Raven’s Coloured Progressive Matrices; SABS: Short Adaptive Behaviour Scale; SEM: Standard errors of the mean; VABS: Vineland Adaptive Behaviour Scale; VABS-II: Vineland Adaptive Behaviour Scale 2nd Edition; WAIS-III: Wechsler Adult Intelligence Scale 3rd edition; WAIS-R: Wechsler Adult Intelligence Scale–Revised; WISC-R: Wechsler Intelligence Scale for Children–Revised;
WJTCA-R: Woodcock–Johnson Tests of Cognitive Abilities; WPPSI-R: Wechsler Preschool and Primary Scale of Intelligence–Revised; YA: Younger adults
Acknowledgements
This review has been undertaken on behalf of the Trisomy 21 Research Society (T21RS) clinical committee. The research was supported by the National Institute for Health Research (NIHR) Biomedical Research Centre at South London and Maudsley NHS Foundation Trust and King's College London. The views expressed are those of the author(s) and not necessarily those of the NHS, the NIHR or the Department of Health.
Authors’contributions
BL and SH identified relevant studies, with advice from CS. BL and SH drafted the original manuscript. SH provided further analysis and evaluations of identified studies and revised the manuscript. CS, CP, WS, TC, JF, SZ, EH, Table 4Summary of intelligence and adaptive ability tests used by identified studies in adults with DS
Test name Authors Domains measured
Intelligence tests
The British Picture Vocabulary Scale (2nd edition); BPVS-II Dunn et al. [41] Verbal IQ (receptive language) The Kaufman Brief Intelligence
Test; KBIT
Kaufman and Kaufman [42]
Verbal and non-verbal IQ
The Kaufman Brief Intelligence Test (2nd edition); KBIT-2 Kaufman and Kaufman [43]
Verbal and non-verbal IQ
The Leiter International Performance Scale-Revised; Leiter-R Roid and Miller [44] Non-verbal IQ The Matrix Analogies Test-Expanded Form; MAT Naglieri [45] Non-verbal IQ
The Peabody Picture Vocabulary Test (3rd edition); PPVT-III Dunn and Dunn [46] Verbal IQ (receptive language) The Peabody Picture Vocabulary Test (4th edition); PPVT-IV Dunn and Dunn [47] Verbal IQ (receptive language) The Revised Peabody Picture Vocabulary Test; PPVT-R Dunn and Dunn [48] Verbal IQ (receptive language) The Prudhoe Cognitive Function
Test; PCFT
Kay et al. [19] General cognitive functioning
Raven’s Coloured Progressive Matrices; RCPM
Raven [49] Non-verbal IQ (abstract reasoning)
Stanford Binet 5th edition; SB-5 Roid [50] Verbal and performance IQ The Wechsler Adult Intelligence Scale (3rd edition); WAIS-III Wechsler [51] Verbal and performance IQ The Wechsler Adult Intelligence Scale Revised; WAIS-R Wechsler [52] Verbal and performance IQ The Wechsler Intelligence Scale for Children-Revised; WISC-R Wechsler [53] Verbal and performance IQ The Wechsler Preschool and Primary Scale of Intelligence–Revised;
WPPSI-R
Wechsler [54] Verbal and performance IQ
The Woodcock–Johnson Tests of Cognitive Abilities; WJTCA-R Woodcock [55] General cognitive functioning Adaptive
ability tests
Adaptive Behaviour Assessment System; ABAS Harrison and Oakland [33]
Adaptive abilities (main domains include: Conceptual, Social and Practical)
Adaptive Behaviour Assessment System (2nd edition); ABAS-II Harrison and Oakland [34]
Adaptive abilities (main domains include: Conceptual, Social and Practical)
Short Adaptive Behaviour Scale; SABS Hatton et al. [36] Adaptive abilities (main domains include: Personal Sufficiency, Community Self-Sufficiency, Personal-Social Responsibility)
Vineland Adaptive Behaviour Scale; VABS
Sparrow et al. [31]; Italian version Balboni and Pedrabissi [32]
Adaptive abilities (main domains include: Communication, Daily Living Skills, Socialisation, Motor Skills)
and AS provided comments on the manuscript. The review was conceived by AS. All authors read and approved the final manuscript.
Funding
This work was funded by a Wellcome Trust Strategic Award (grant 098330/Z/ 12/Z) conferred upon The London Down Syndrome (LonDownS) Consortium (Chief Investigator, Andre Strydom), and an MRC project grant, (Chief Investigator, Andre Strydom) for LonDownsPREVENT (MR/S011277/1). The funder(s) had no role in study design; the collection, analysis, or interpretation of the data; the writing of the report; or the decision to submit the report for publication.
Availability of data and materials
Data sharing is not applicable to this article as no datasets were generated or analysed during the current study.
Ethics approval and consent to participate Not applicable
Consent for publication Not applicable
Competing interests
The authors declare that they have no competing interests.
Author details
1Department of Forensic and Neurodevelopmental Sciences, Institute of Psychiatry, Psychology & Neuroscience, Kings College London, London SE5 8AF, UK.2Division of Psychiatry, University College London, London W1T 7NF, UK.3The London Down Syndrome Consortium (LonDownS), London, UK.4Department of Psychology, Loughborough University, Loughborough, Leicestershire LE11 3TU, UK.5Department of Psychiatry, Herchel Smith Building for Brain & Mind Sciences, Forvie Site, Robinson Way, Cambridge CB2 0SZ, UK.6Dichterbij, Center for Intellectual Disabilities, Gennep, The Netherlands.7Department of Primary and Community Care, Radboud University Medical Center, Nijmegen, The Netherlands.8Department of Pediatrics, University of California, Irvine, USA.9Memory Unit, Department of Neurology, Hospital de la Santa Creu i Sant Pau–Biomedical Research Institute Sant Pau, Universitat Autònoma de Barcelona, Barcelona, Spain. 10Barcelona Down Medical Center, Fundació Catalana de Síndrome de Down, Barcelona, Spain.11Centro de Investigación Biomédica en Red de Enfermedades Neurodegenerativas, CIBERNED, Madrid, Spain.
12Sanders-Brown Center on Aging, University of Kentucky, 800 South Limestone Street, Lexington, KY 40536-0230, USA.13Department of Psychiatry, University of Pittsburgh School of Medicine, Pittsburgh, PA 15213, USA.14Departments of Pediatrics and Neurology, University of California, Irvine, USA.15Townsend Family Laboratories, Department of Psychiatry, The University of British Columbia, 2255 Wesbrook Mall, Vancouver, BC V6T 1Z3, Canada.
Received: 21 May 2018 Accepted: 22 July 2019
References
1. Bittles AH, Bower C, Hussain R, Glasson EJ. The four ages of Down syndrome. Eur J Pub Health. 2007;17:221–5.
2. Chapman RS, Hesketh LJ. Behavioral phenotype of individuals with Down syndrome. Ment Retard Dev Disabil Res Rev. 2000;6:84–95.
3. McCarron M, McCallion P, Reilly E, Mulryan N. A prospective 14-year longitudinal follow-up of dementia in persons with Down syndrome. J Intellect Disabil Res. 2014;58:61–70.
4. Zigman WB, Lott IT. Alzheimer’s disease in Down syndrome: neurobiology and risk. Ment Retard Dev Disabil Res Rev. 2007;13:237–46.
5. Heber R. A manual on terminology and classification in mental retardation. Am Assoc Ment Defic. 1959;64(2):1–111.https://www.ncbi.nlm.nih.gov/ pubmed/14400459
6. Silverman W. Down syndrome: cognitive phenotype. Ment Retard Dev Disabil Res Rev. 2007;13:228–36.
7. Das JP, Divis B, Alexander J, Parrila RK, Naglieri JA. Cognitive decline due to aging among persons with Down syndrome. Res Dev Disabil. 1995;16:461–78.
8. Ghezzo A, Salviolo S, Solimando M, Palmieri A, Chiostergi C, Scurti M, Lomartire L, Bedetti F, Cocchi G, Follo D, Pipitone E, Rovatti P, Zamberletti J, Gomiero T, Castellani G, Franceschi C. Age-related changes of adaptive and neuropsychological features in persons with Down syndrome. PLoS One. 2014;9(11):e113111.
9. Collacott RA. The effect of age and residential placement on adaptive behaviour of adults with Down’s syndrome. Br J Psychiatry J Ment Sci. 1992; 161:675–9.
10. Liogier d’Ardhuy X, Edgin JO, Bouis C, de Sola S, Goeldner C, Kishnani P, et al. Assessment of cognitive scales to examine memory, executive function and language in individuals with Down syndrome: implications of a 6-month observational study. Front Behav Neurosci. 2015;9:300.
11. Sinai A, Hassiotis A, Rantell K, Strydom A. Assessing specific cognitive deficits associated with dementia in older adults with Down syndrome: use and validity of the Arizona cognitive test battery (ACTB). PLoS One. 2016;11: e0153917.
12. Glenn S, Cunningham C. Performance of young people with Down syndrome on the Leiter-R and British picture vocabulary scales. J Intellect Disabil Res. 2005;49:239–44.
13. Iacono T, Torr J, Wong HY. Relationships amongst age, language and related skills in adults with Down syndrome. Res Dev Disabil. 2010;31:568–76. 14. Hartley SL, Handen BL, Devenny D, Mihaila I, Hardison R, Lao PJ, et al.
Cognitive decline and brain amyloid-βaccumulation across 3 years in adults with Down syndrome. Neurobiol Aging. 2017;58:68–76.
15. Tomaszewski B, Fidler D, Talapatra D, Riley K. Adaptive behaviour, executive function and employment in adults with Down syndrome. J Intellect Disabil Res. 2017;62(1):41–52.
16. Startin CM, Hamburg S, Hithersay R, Davies A, Rodger E, Aggarwal N, et al. The LonDownS adult cognitive assessment to study cognitive abilities and decline in Down syndrome. Wellcome Open Res. 2016;1:11.
17. de Sola S, de la Torre R, Sánchez-Benavides G, Benejam B, Cuenca-Royo A, Del Hoyo L, et al. A new cognitive evaluation battery for Down syndrome and its relevance for clinical trials. Front Psychol. 2015;6:708.
18. Breia P, Mendes R, Silvestre A, Gonçalves MJ, Figueira MJ, Bispo R. Adults with Down syndrome: characterization of a Portuguese sample. Acta Medica Port. 2014;27:357–63.
19. Kay DWK, Tyrer SP, Margallo-Lana ML, Moore PB, Fletcher R, Berney TP, et al. Preliminary evaluation of a scale to assess cognitive function in adults with Down’s syndrome: the Prudhoe Cognitive Function Test. J Intellect Disabil Res. 2003;47:155–68.
20. Patel BN, Seltzer GB, Wu HS, Schupf N. Effect of menopause on cognitive performance in women with Down syndrome. Neuroreport. 2001;12:2659–62.
21. de Knegt NC, Lobbezoo F, Schuengel C, Evenhuis HM, Scherder EJA. Self-reported presence and experience of pain in adults with Down syndrome. Pain Med. 2017;18(7):1247–63.
22. Dressler A, Bozza M, Perelli V, Tinelli F, Guzzetta A, Cioni G, et al. Vision problems in Down syndrome adults do not hamper communication, daily living skills and socialisation. Wien Klin Wochenschr. 2015;127:594–600. 23. Strydom A, Dickinson MJ, Shende S, Pratico D, Walker Z. Oxidative stress
and cognitive ability in adults with Down syndrome. Prog Neuro-Psychopharmacol Biol Psychiatry. 2009;33:76–80.
24. Kittler P, Krinsky-McHale SJ, Devenny DA. Sex differences in performance over 7 years on the Wechsler Intelligence Scale for Children--revised among adults with intellectual disability. J Intellect Disabil Res. 2004;48:114–22.
25. Devenny DA, Krinsky-McHale SJ, Sersen G, Silverman WP. Sequence of cognitive decline in dementia in adults with Down’s syndrome. J Intellect Disabil Res. 2000;44(Pt 6):654–65.
26. Lao PJ, Handen BL, Betthauser TJ, Mihaila I, Hartley SL, Cohen AD, et al. Longitudinal changes in amyloid positron emission tomography and volumetric magnetic resonance imaging in the nondemented Down syndrome population. Alzheimers Dement Amst Neth. 2017;9:1–9. 27. Sansone SM, Schneider A, Bickel E, Berry-Kravis E, Prescott C, Hessl D.
Improving IQ measurement in intellectual disabilities using true deviation from population norms. J Neurodev Disord. 2014;6:16.
29. Kishnani PS, Sommer BR, Handen BL, Seltzer B, Capone GT, Spiridigliozzi GA, et al. The efficacy, safety, and tolerability of donepezil for the treatment of young adults with Down syndrome. Am J Med Genet A. 2009;149A:1641–54.
30. Witts P, Elders S. The‘Severe Impairment Battery’: assessing cognitive ability in adults with Down syndrome. Br J Clin Psychol. 1998;37:213–6. 31. Sparrow SS, Balla DA, Cicchetti DV, Harrison PL, Doll EA. Vineland adaptive
behavior scales; 1984.
32. Balboni G, Pedrabissi L. Adattamento italiano delle Vineland Adaptive Behavior Scales. OS Organ Spec Firenze. 2003.https://www.ncbi.nlm.nih. gov/pmc/articles/PMC3082207/
33. Harrison P, Oakland T. Adaptive Behavior Assessment System: Psychol Corp; 2000.
34. Harrison P, Oakland T. Adaptive Behavior Assessment System–Second Edition, San Antonio, TX: The Psychological Corporation; 2003. 35. Nihira K, Foster R, Shellhaas M, Leland H. AAMD adaptive behavior scale
(rev.). Washington, DC: American Association on Mental Deficiency; 1974. 36. Hatton C, Emerson E, Robertson J, Gregory N, Kessissoglou S, Perry J, et al.
The adaptive behavior scale-residential and community (part I): towards the development of a short form. Res Dev Disabil. 2001;22:273–88.
37. Nihira K, Leland H, Lambert N. Adaptive behavior scale-residential and community (second edition): examination booklet. Austin: Pro-Ed; 1993.
https://www.worldcat.org/title/abs-rc2-aamr-adaptive-behavior-scale-residential-and-community/oclc/38860955
38. Chapman RS, Hesketh LJ, Kistler DJ. Predicting longitudinal change in language production and comprehension in individuals with Down syndrome: hierarchical linear modeling. J Speech Lang Hear Res. 2002; 45:902–15.
39. Laws G, Bishop DVM. A comparison of language abilities in adolescents with Down syndrome and children with specific language impairment. J Speech Lang Hear Res. 2003;46:1324–39.
40. Silverman W, Miezejeski C, Ryan R, Zigman W, Krinsky-McHale S, Urv T. Stanford-Binet & WAIS IQ differences and their implications for adults with intellectual disability (aka mental retardation). Intelligence. 2010;38:242–8. 41. Dunn L, Dunn L, NFER-Nelson. The British Picture Vocabulary Scale Second
Edition. UK: NFER-Nelson; 1997.
42. Kaufman AS, Kaufman NL. Kaufman Brief Intelligence Test. Circle Pines, MN: American Guidance Service; 1990.
43. Kaufman AS, Kaufman NL. Manual for Kaufman brief intelligence test second edition (KBIT-2). Circle Pines: American Guidance Service; 2004. 44. Roid GH, Miller L. Leiter international test of intelligence—revised. Chicago,
IL: Stoelting; 1997.
45. Naglieri JA. Matrix analogies test: expanded form. Columbus, OH: Merrill; 1985.
46. Dunn L, Dunn L. The British Picture Vocabulary Scale Third Edition. UK: NFER-Nelson; 1997.
47. Dunn L, Dunn D. Peabody Picture Vocabulary Test. 4th ed. San Antonio: NCD Pearson, Inc; 2007.
48. Dunn L, Dunn L. PPVT: Peabody picture vocabulary test-revised: manual for forms L and M. Am Guid Serv; 1981.
49. Raven J. Manual for the Coloured Progressive Matrices (revised). Windsor: NFER Nelson; 1984.
50. Roid GH. Stanford-Binet Intelligence Scales, Fifth Edition (SB: V). Itasca: Riverside Publishing; 2003.
51. Wechsler D. WAIS–III administration and scoring manual. 3rd ed. San Antonio: The Psychological Corporation; 1997.
52. Wechsler D. Manual for the Wechsler Adult Intelligence Scale, Revised. New York: Psychological Corporation; 1981.
53. Wechsler D. Manual for the Wechsler Intelligence Scale for Children (rev. ed.). New York: Psychol. Corp; 1974.
54. Wechsler D. Wechsler Preschool and Primary Scale of Intelligence–revised. San Antonio: The Psychological Corporation; 1989.
55. Woodcock R. The Woodcock-Johnson Tests of Cognitive Ability—revised. In: Flanagan DP, Genshaft JL, Harrison PL, editors. Contemporary intellectual assessment: theories, tests, and issues. New York: Guilford Press; 1997. 56. Sparrow SS, Cicchetti DV, Balla DA. Vineland adaptive Behavior Scales. 2nd
ed. Circle Pines: American Guidance Service; 2005.
Publisher’s Note