R E S E A R C H
Open Access
Pathway analysis of rare variants for the
clustered phenotypes by using hierarchical
structured components analysis
Sungyoung Lee
1†, Sunmee Kim
2†, Yongkang Kim
3, Bermseok Oh
4, Heungsun Hwang
2and Taesung Park
3,5*FromThe 8th Annual Translational Bioinformatics Conference Seoul, South Korea. 31 October - 2 November 2018
Abstract
Backgrounds:Recent large-scale genetic studies often involve clustered phenotypes such as repeated measurements. Compared to a series of univariate analyses of single phenotypes, an analysis of clustered phenotypes can be useful for substantially increasing statistical power to detect more genetic associations.
Moreover, for the analysis of rare variants, incorporation of biological information can boost weak effects of the rare variants.
Results:Through simulation studies, we showed that the proposed method outperforms other method currently available for pathway-level analysis of clustered phenotypes. Moreover, a real data analysis using a large-scale whole exome sequencing dataset of 995 samples with metabolic syndrome-related phenotypes successfully identified the glyoxylate and dicarboxylate metabolism pathway that could not be identified by the univariate analyses of single phenotypes and other existing method.
Conclusion:In this paper, we introduced a novel pathway-level association test by combining hierarchical
structured components analysis and penalized generalized estimating equations. The proposed method analyzes all pathways in a single unified model while considering their correlations. C/C++ implementation of PHARAOH-GEE is publicly available athttp://statgen.snu.ac.kr/software/pharaoh-gee/.
Keywords:Generalized estimating equations, Clustered phenotypes, Pathway analysis, Rare variants
Backgrounds
The history of Genome-Wide Association Studies (GWAS) now has reached two decades, and those GWAS have identified almost 60,000 unique associations of over 3000 traits [1]. However, despite the steeply in-creasing GWAS discoveries, those discoveries explain only a small portion of expected phenotypic variations [2,3], a phenomenon known as“missing heritability”[2]. Some of the possible explanation for such phenomenon
include gene-gene interaction, pleiotropic effect, and rare variants [3].
For the analysis of rare variants, the low statistical power caused by the sparseness of rare variants is one of the major issues. The use of biological information such as genes or pathways has been proven to escalate the statistical power and improve the biological interpret-ation, for identifying statistically significant genes and pathways associated with complex traits such as high-density lipoprotein levels, obesity, schizophrenia, and multiple cancers [4–8]. Taking the advantages of the pathway-level analysis, we have developed statistical methods PHARAOH that investigates pathway-level as-sociations [9] and PHARAOH-multi that extends PHARAOH to the analysis of multiple continuous phe-notypes [10]. Our PHARAOH method has two exclusive
© The Author(s). 2019Open AccessThis article is distributed under the terms of the Creative Commons Attribution 4.0 International License (http://creativecommons.org/licenses/by/4.0/), which permits unrestricted use, distribution, and reproduction in any medium, provided you give appropriate credit to the original author(s) and the source, provide a link to the Creative Commons license, and indicate if changes were made. The Creative Commons Public Domain Dedication waiver (http://creativecommons.org/publicdomain/zero/1.0/) applies to the data made available in this article, unless otherwise stated. * Correspondence:[email protected];[email protected]
Sungyoung Lee, and Sunmee Kim are the authors wish it to be known that, in their opinion, the first two authors should be regarded as joint First Authors.
3Department of Statistics, Seoul National University, Seoul, Korea
5Interdisciplinary Program in Bioinformatics, Seoul National University, Seoul, Korea
features. First, it employs the hierarchy of biological process by constructing a hierarchical structural model of the rare variants, genes, pathways, and phenotype(s). Sec-ond, it considers all pathways within a single unified model with statistical regularization, hence effectively con-trolling the correlations between genes and pathways.
Another approach to improving the statistical power is a simultaneous analysis of clustered phenotypes. For ex-ample, the analysis of repeatedly measured phenotypes outperforms the analysis of cross-sectionally observed phenotypes, since the information on the temporal differ-ences within a subject improves the power [11]. Many re-cent GWAS have analyzed the repeatedly measured phenotypes and discovered many novel associations, such as fasting glucose, body mass index, and lung function [12–14]. In the repeated measures analysis, a consider-ation of the correlconsider-ations between the repeated measure-ments is crucial. Neglecting the nature of clustered phenotypes may result in loss of statistical power [15].
The Generalized Estimating Equations (GEE) approach is one of the most commonly used methods for the ana-lysis of clustered and correlated phenotypes [15]. The major advantages of GEE include that it can handle a wide class of phenotypes such as binary, count, and con-tinuous traits from an exponential family distribution and that its estimator is consistent regardless of the spe-cification of the working correlation structure. In these respects, the GEE approach has been contributed to the discovery of genetic components from various studies including association studies of lung cancer [16], oph-thalmological measurements [16, 17], and gene-drug interaction analysis [18]. For the analysis of expression datasets, various extensions of GEE have been proposed such as the repeated microarray experiment and penal-ized GEE for microRNA dataset [17, 18]. For gene-level tests, several GEE methods have been developed, includ-ing Longitudinal Genetic Random Field (LGRF) and GEE-KM [19,20].
However, unlike the gene-level analyses, to the best of our knowledge, only one method based on GEE has employed the pathway-level analysis of the correlated phe-notypes [21] with the R package GEEaSPU. Note that GEEaSPU employs the adaptive Sum of Powered score (aSPU) and adapts the GEE framework to enable pathway-level analysis of genetic variants [21]. However, the GEEaSPU method cannot handle the correlations be-tween the pathways, which can result in the biased results. In order to address this problem, we propose a novel pathway-level association test for clustered and correlated phenotypes such as repeated measurements, Pathway-based approach using HierArchical component of collapsed RAre variants Of High-throughput sequencing data using General-ized Estimating Equations (PHARAOH-GEE). While the existing GEE based pathway-level method GEEaSPU
implements the individual“pathway-wise” test assuming all tests are independent, the proposed PHARAOH-GEE method implements a“global test”that considers the correl-ation among the pathways into account by putting all path-ways simultaneously into a single model. Moreover, PHARAOH-GEE can handle various types of phenotypes (e.g., binary), and it also retains the advantages of PHAR-AOH, such as the hierarchical model that mimics the natural biological processes. By providing PHARAOH-GEE program using a powerful and fast C/C++ based framework WISARD [22], it supports various genetic data formats and provides af-fordable performance.
Results
We used a workstation system consists of two Intel Xeon E5–2640 CPUs and 256GiB of RAM. Due to the limitation of the compared method, the R version 3.4.0 and R pack-age‘GEEaSPU’were used with default settings.
Simulation study
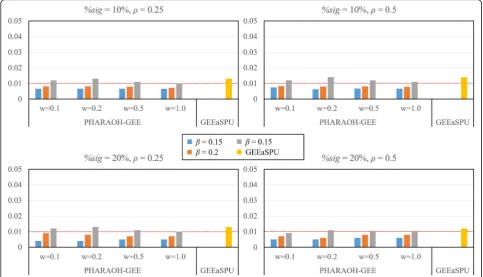
For our simulation study, we generated 300 replicates from the simulated data pool. Each replicate consisted of 10 pathways in which the first pathway was causal and the other nine were non-causal (i.e., no effect). For each repli-cate, the proposed PHARAOH-GEE method was applied to the 10 pathways simultaneously, whereas GEEaSPU was applied to each pathway individually. Here we assumed that the first pathway is causal and the others are non-causal. For the causal pathway, we considered three different par-ameter settings: four gene-level effects (w =0.1, 0.2, 0.5 and 1.0), three pathway-level effects (β=0.15, 0.2 and 0.25), two correlations of phenotypes (ρ=0.25 and 0.5). For all test re-sults, we applied the BH step-up procedure to control the False Discovery Rate (FDR) at 5% level [23]. Details on simulation procedure can be found onMethodssection.
First, we evaluated the type 1 errors of PHARAOH-GEE and GEEaSPU. For the given parameter settings for the causal pathway, we evaluated the type 1 errors using 9 non-causal pathways with significance level α= 0.01. As shown in Fig. 1, all methods controlled the type 1 error rates appropriately, regardless of the parameter values.
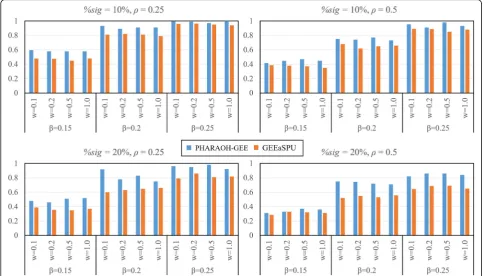
Second, we evaluated statistical power of the methods where power was computed as a proportion of the causal pathway being statistically significant at the FDR < 0.05 over 300 replicates. In addition to three parameter settings for the causal pathway, we consider two cases when the numbers of significant genes within the causal pathway are only one (H1= 1) and two (H1= 2) out of
ten simulated genes, respectively. As shown in Fig. 2, PHARAOH-GEE outperforms GEEaSPU in all simula-tion scenarios.
tended to outperform GEEaSPU. Second, PHARAOH-GEE showed less reduction of statistical power than GEEaSPU when the phenotypic correlation ρ increased. In real practical situation where only a fraction of genes is likely re-lated to phenotypes and that the correlations among clus-tered phenotypes are high, these findings suggest that PHARAOH-GEE would be more powerful for detecting true biological signals than GEEaSPU.
Analysis of whole exome sequencing (WES) dataset using clustered phenotypes
To demonstrate the usefulness of PHARAOH-GEE, we analyzed a large-scale sequencing dataset with six phe-notypes related to the metabolic syndrome: systolic blood pressure (SBP), diastolic blood pressure (DBP), tri-glycerides (TG), fasting glucose (FASTGLU), waist cir-cumference (WAIST), and high-density lipoprotein (HDL). Before the analysis, we binarized these pheno-types according to the metabolic syndrome criteria of International Diabetes Federation (IDF) consensus worldwide definition of the metabolic syndrome (https://www.idf.org). Metabolic syndrome is diagnosed as the presence of three or more of the following criteria: (1) WAIST≥90 cm in males and≥80 cm in females; (2) elevated TG≥150 mg/dL or tak-ing medication; (3) HDL-cholesterol < 40 mg/dL in males and < 50 mg/dL in females or taking lipid-lowering agents;
(4) systolic blood pressure≥130 mmHg or diastolic blood pressure≥85 mmHg or taking antihypertensive medica-tions; and (5) elevated FASTGLU ≥100 mg/dL or oral hypoglycemic agents use. From these six metabolic syn-drome related phenotypes, we derived five clustered bin-ary traits. Especially, we combined two blood pressure phenotypes (SBP & DBP) into a single phenotype, named BP, by setting 1 if either SBP or DBP satisfied the diagnosis criteria of metabolic syndrome and 0 otherwise. All other phenotypes were binarized if the diagnosis criteria of metabolic syndrome was satisfied and 0 otherwise.
We applied PHARAOH for the univariate analysis of each binary phenotype and applied PHARAOH-GEE and GEEaSPU for the multivariate analysis of the five binary phenotypes. We conducted the multiple testing adjustment to both univariate and multivariate analyses by using the BH step-up procedure [23]. The unstruc-tured covariance structure of the phenotypes was assumed for both PHARAOH-GEE and GEEaSPU. Fig-ure 3 presents quantile-quantile (Q-Q) plots showing that PHARAOH and PHARAOH-GEE led to no sub-stantial deflation or inflation ofp-values.
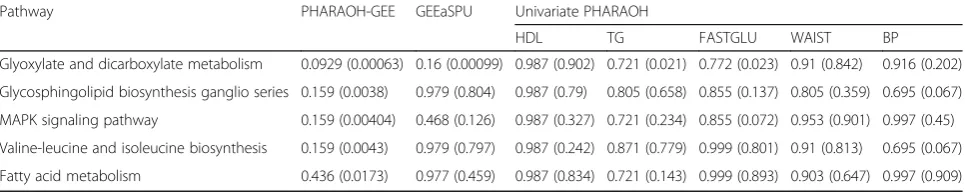
Table 1 exhibits the pathways with the five smallest q-values identified by PHARAOH-GEE, as well as their q-values under PHAROH and GEEaSPU. PHARAOH-GEE was able to identify one KEGG pathway, the glyoxylate and
dicarboxylate metabolism, at the q-value threshold of 0.1. None of these pathways turned out to be statistically signifi-cant in the univariate analyses of PHARAOH, always result-ing in larger q-values than those from PHARAOH-GEE. Although the same glyoxylate and dicarboxylate pathway had the lowest p-value by GEEaSPU, it failed to pass the
q-value threshold of 0.1, after the multiple testing adjust-ment. Thus, our real data analyses showed the relatively su-perior performance of PHARAOH-GEE.
Among the five pathways identified by PHARAOH-GEE, a recent study suggests a strong relationship between the metabolic syndrome and two pathways (glyoxylate and dicarboxylate, and fatty acid metabolisms), through their role in abdominal obesity [24]. In addition, the glycosphin-golipid biosynthesis and MAPK signaling pathways are re-ported to be related to the metabolic syndrome via insulin resistance that plays a critical role in manifestation of the metabolic syndrome [25,26].
Fig. 2Result of power analysis. Columns and rows represent different phenotypic correlations (0.25 and 0.5) and proportions of significant genes within the causal pathway (10 and 20%). For each plot, estimated statistical powers from 300 simulation datasets are shown with combinations of gene-level effects (0.1, 0.2, 0.5 and 1) and pathway-level effects (0.15, 0.2 and 0.25)
Fig. 3Q-Q plots of the real data analyses.aQ-Q plot of the univariate analyses using KEGG pathway database andbBiocarta pathway database.
Conclusion
An analysis of the clustered phenotypes provides more infor-mation than the cross-sectional studies. Recent large cohort studies keep producing repeatedly measured phenotypes. We introduced a novel statistical method for the pathway ana-lysis of the large-scale genetic dataset with clustered pheno-types. While our previous PHARAOH-multi method can handle only continuous phenotypes, the proposed PHARAOH-GEE can handle various phenotypes such as clustered binary and count phenotypes under the various correlation structures. Through the compari-son study using the simulated datasets, we demon-strated that the proposed PHARAOH-GEE method outperforms an existing pathway method. Further-more, our application to the large-scale WES dataset successfully identified one pathway that has not been discovered in the analyses of individual phenotype with the multiple testing adjustments.
Discussion
Compared to GEEaSPU the only currently available method for pathway-level test of clustered phenotypes, the proposed method has many advantages. First, PHARAOH-GEE effectively controls the complex corre-lations among the pathways by constructing a unified hierarchical, doubly-penalized statistical model. Second, it successfully reflects the nature of biological process from GSCA framework and takes clustered phenotypes into account from GEE framework. In conclusion, we hope that PHARAOH-GEE can serve as a main tool for the pathway-level analysis of clustered phenotypes in genetic studies.
Currently, we have a number of considerations for our future research. Although we considered many possible combinations of parameters in the simulation setting, a further extensive simulation study is required for more comprehensive comparison with existing pathway-based methods. In addition, we will perform a replication study using other independent datasets with the metabolic syndrome phenotypes. Finally, we will employ other pen-alization methods such as lasso and elastic-net.
Methods
PHARAOH-GEE method
Technically, the proposed method is an extension of the doubly-regularized Generalized Structured Com-ponent Analysis into the GEE framework [27] that imposes ridge penalties [28] on both gene-pathway and pathway-phenotype relationships. From the previ-ous studies, we successfully demonstrated that those two ridge penalties effectively control the correlations between genes and pathways [9, 10]. PHARAOH-GEE aims to identify associations between Q clustered phenotypes and K pathways, each of which is linked to Tk genes (k= 1, ⋯, K). An example of the
PHARAOH-GEE model is depicted in Fig. 4.
Letyiqbe the value of theqthphenotype measured on the ith
individual (i= 1, …, N; q= 1, …, Q) and ~yi¼ ½yi1;⋯;yiQ0 be aQ× 1 vector of the clustered phenotypes of theithindividual. Similar to the previous description of the PHARAOH model [9], we assume thatyiq follows an
exponential family distribution with a mean μiq. LetΣi be
theQ×Qcovariance matrix of~yi. Then,
covð Þ ¼~yi Σi QQð Þ¼Ai1=2Rið ÞαA1i=2; ð1Þ
where Ri(α) is a so-called “working correlation
matrix”, α is a parameter vector that fully character-izes Ri(α), and A1i=2¼ diag½varðμijÞ, i.e., a Q×Q diagonal matrix with the marginal variance of re-sponses. Liang and Zeger [29] suggested various choices for Ri(α), e.g., the independence covariance
structure, Ri(α) =IQ, where IQ is the identity matrix of
order Q.
Let ~x0i¼ ½1;⋯;1;xi11;⋯;xi1T1;⋯;xiK1;⋯;xiKTK be a
(T+ 1) × 1 vector consisting of all gene-level collapsed variables for the ithindividual across Kpathways, where
T =ΣKk¼1Tk. The gene-level collapsed variables are gen-erated as the weighted sums of rare variants. Let X be an N× (T+ 1) matrix of the gene-level collapsed vari-ables forNobservations, as expressed in (2).
Table 1Top five pathways from PHARAOH-GEE. Theq-values after the multiple testing adjustment are presented in each cell, with their correspondingp-values within the brackets. The results of univariate PHARAOH are also provided on the right side of the table
Pathway PHARAOH-GEE GEEaSPU Univariate PHARAOH
HDL TG FASTGLU WAIST BP
Glyoxylate and dicarboxylate metabolism 0.0929 (0.00063) 0.16 (0.00099) 0.987 (0.902) 0.721 (0.021) 0.772 (0.023) 0.91 (0.842) 0.916 (0.202)
Glycosphingolipid biosynthesis ganglio series 0.159 (0.0038) 0.979 (0.804) 0.987 (0.79) 0.805 (0.658) 0.855 (0.137) 0.805 (0.359) 0.695 (0.067)
MAPK signaling pathway 0.159 (0.00404) 0.468 (0.126) 0.987 (0.327) 0.721 (0.234) 0.855 (0.072) 0.953 (0.901) 0.997 (0.45)
Valine-leucine and isoleucine biosynthesis 0.159 (0.0043) 0.979 (0.797) 0.987 (0.242) 0.871 (0.779) 0.999 (0.801) 0.91 (0.813) 0.695 (0.067)
XNðTþ1Þ¼
1 x111 x112 ⋯ x1KTK 1 x211 x212 ⋯ x2KTK
⋮ ⋮ ⋮ ⋱ ⋮
1 xN11 xN12 ⋯ xNKTK
2 6 6 4 3 7 7 5 ¼ ~ x0 1 ~ x0 2 ⋮ ~ x0 N 2 6 6 4 3 7 7
5: ð2Þ
As in the previous methods [9], we standardize X to satisfy the conventional scaling constraint diag(X′X) =
NI. Each element of X, xikt, denotes a gene-level
sum-mary of the ithsample for the tth gene (t= 1, ⋯,Tk) in
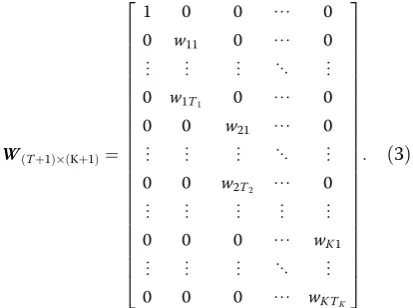
thekthpathway and is generated by the weighted sum of rare variants that is same as the previous work [9, 10]. Let W denote a (T + 1) × (K+ 1) matrix consisting of component weights wtk, which are assigned toxikt. This
matrix can be generally expressed as
WðTþ1ÞðKþ1Þ¼
1 0 0 ⋯ 0
0 w11 0 ⋯ 0
⋮ ⋮ ⋮ ⋱ ⋮
0 w1T1 0 ⋯ 0
0 0 w21 ⋯ 0
⋮ ⋮ ⋮ ⋱ ⋮
0 0 w2T2 ⋯ 0
⋮ ⋮ ⋮ ⋮ ⋮
0 0 0 ⋯ wK1
⋮ ⋮ ⋮ ⋱ ⋮
0 0 0 ⋯ wKTK
2 6 6 6 6 6 6 6 6 6 6 6 6 6 6 6 6 6 6 6 6 6 6 6 4 3 7 7 7 7 7 7 7 7 7 7 7 7 7 7 7 7 7 7 7 7 7 7 7 5
: ð3Þ
Let ηiq and g(·) denote the ithlinear predictors of the qth
phenotype and a link function, respectively. We de-fine the proposed PHARAOH-GEE model as
g μiq ¼ηiq¼β0qþ
XK
k¼1
XTk
t¼1 xiktwtk
!
βkq
¼β0qþ
XK
k¼1
fikβkq¼~fi~βq; ð4Þ
where fik¼PTt¼k1xiktwtk is the component score of the ith
individual for the kth pathway ~fi¼ ½1;fi1;⋯;fiK,
andβ~q¼ ½β0qβ1q⋯βKqis a vector of coefficients linking
K pathways to the qth phenotype. We can statistically examine the joint effects of thekthpathway onQ pheno-types by testing the null hypothesis H0:βk1= ... =βkQ= 0.
Moreover, it is possible to evaluate the effect of one gene on a single phenotype mediated by its corresponding pathway.
Parameter estimation
For simplicity, we describe the propose method, assum-ing that the phenotype ~yi is continuous. It is technically straightforward to extend the method to other pheno-types from exponential distributions. In parameter esti-mation, we add two L2 penalty terms to control for
potential adverse influences of high correlations between genes and/or pathways. Specifically, to estimate the pa-rameters W and B, we seek to minimize the following penalized estimating equations.
ϕα;B;W ¼
XN
i¼1
UiþλPtrðB0BÞ þλGtrðW0WÞ; ð5Þ
where U is the estimating equation for the parameters,
Bis a matrix consisting of all regression coefficients ~βq, tr(·) denotes the trace of matrix, and λG and λP denote
ridge parameters on theL2penalty terms for the weights
and regression coefficients, respectively. A more detail on the estimating equation and solving process can be found on elsewhere [9].
To minimize ϕα, B, W, we use an iterative algorithm
that repeats the following steps until no substantial changes in parameter estimates occur.
Step 1: We update B for fixed W and Ri(α). Let b=
vec(B) denote a vector formed by stacking all columns ofBone below another. This is equivalent to minimizing the following estimating equations
ϕ1¼
XN
i¼1
Uð Þ þb λPb0b
¼X
N
i¼1
f0 iI
Σ−1
i yi− f0iI
b
þλPb0b
¼X
N
i¼1
QiΣ−i1ðyi−QibÞ þλPb0b; ð6Þ
where Qi¼ f0iI and ⊗ denotes Kronecker product.
Then, b can be estimated by b^¼
ðPNi¼1Q0iΣi−1QiþλPIÞ− 1
ðPNi¼1Q0iΣi−1yiÞ, and B^ is recon-structed fromb^.
Step 2: We update W for fixed Band Ri(α). Let w=
vec(W). Similar to step 1, it is equivalent to minimizing
ϕ2¼
XN
i¼1
Uð Þ þw λGw0w
¼X
N
i¼1 ~ x0
iB0
0Σ−1
i yi− ~x0iB0
w
þλGw0w
¼X
N
i¼1 M0
iΣ−i1ðyi−MiwÞ þλGw0w; ð7Þ
whereMi¼~x0iB0;w*is the vector formed by eliminating all zero elements ofw, andMiis the matrix formed by
re-moving the columns of~x0iB0corresponding to the zero el-ements of w. Then, w∗ can be estimated by
^
w¼ ðPNi¼1Mi0Σ−i1MiþλGIÞ−1ðPNi¼1M0iΣ−i1ziÞ: Then, the estimatedWis reconstructed fromw^.
Step 3: We updateRi(α) from the updated B and W
using Pearson residuals with the variance function of the distributionν,
rij¼yij−^μij=ν1=2 ^μij : ð8Þ
where ^μij¼β0qþPKk¼1fik^βkq: Finally, the dispersion parameterφis estimated consistently by
^
φ¼ NQ− KþX
K
k¼1 Tk
!!−1XN
i¼1
XQ
j¼1
^r2ij: ð 9Þ
We applyk-fold cross-validation (CV) to estimate the values ofλGand λP, which compares the quasi-deviance
values [30] of a two-dimensional grid of candidate values ofλGandλP.
Significance testing and multiple correction
Resampling methods can be used to test the statistical significance of the estimated effects of all pathways on a given set of clustered phenotypes. In the proposed method, we utilize a permutation test to obtainp-values. By permuting the phenotypes, the method first generates the empirical null distributions of both pathways and gene co-efficients. By computing the quantile of the estimated path-way and gene coefficients from the non-permuted dataset with the corresponding null distribution, we can obtain an empiricalp-value for any specific pathway and gene.
In our study, we want to test the joint effects of path-ways on clustered phenotypes. In our previous study, we introduced two approaches to test βk1, ...,βkQ
simultan-eously and suggested the Wald-type statistics [10]. Simi-larly, we construct a single statistic that combines all Q coefficients. Here, we define a Wald-type statisticTas.
T ¼~β0k cov−1 β~k β~k: ð10Þ
Under penalized GEE, the estimated covariance covðb~βkÞ can be obtained in two ways. One way is to calculate it dir-ectly, as introduced by Wang et al. [31] as follows.
cov b~β ¼ Hb
~ βþnEb~β
−1
Mb
~
β Hbβ~þnEb~β
−1
; ð11Þ
where Hb
~
β¼
PN
i¼1~x0iA1i=2Ri−1ðαÞA1i=2~xi, Eb~ β¼trðB
0BÞ, and
Mb ~
β¼
PN i¼1~x0iA
1=2
i R−i1ðαÞeb~ βe
0
bβ~R−i1ðαÞAi1=2~xiwitheb~
β¼A
1=2
i
ð~yi−μ~iÞ. The other indirect way is to calculate it as the sam-ple covariance ofβ~kfrom permutations. We use this indirect way to reduce computational burden.
For the calculated p-values, we implemented two types of multiple testing procedure as we discussed earlier [10]. In short, we applied two approaches: Westfall & Young permutation procedure [32] that effectively considers the correlation ofp-values, and the Benjamini-Hochberg (BH) step-up procedure [23] that computes q-values by False Discovery Rate (FDR) adjustment.
Simulation study
the phenotypes were simulated from the below model that assumes only the first pathway is causal:
g μiq ¼ηiq¼β1q~fi1¼β1q
XH1
t¼1 w1txi1t
¼β1q
XH1
t¼1 w1t
XM1t
j¼1 γ1tjgi1tj
!
; ð12Þ
whereH1andM1tdenote the number of causal genes in
the causal pathway and the number of causal rare vari-ants in the tth causal gene, respectively. Note that M1t
was the number of rare variants in the simulated gene var-ies and was used as an input variable in our simulation study. We setγ1tjto |log10MAFtj|, which represents the
ef-fect of thejthgenetic variant of thetthgene. For the sim-plicity, we generated the phenotypes from the simulated linear predictorηiq, by using it as a binarization threshold
from the randomly generated variables from the multivari-ate normal distribution MVN(0,Σ). For each replicate, all rare variants were collapsed into genes.
Exome sequencing dataset with clustered phenotypes In order to illustrate PHARAOH-GEE for investigating as-sociations between multiple pathways and the clustered phenotypes, we analyzed a large-scale WES dataset from a Korean population cohort. Our WES dataset consists of next-generation sequencing data of 1087 individuals’ ge-nomes, using the Illumina HiSeq2000 platform (Illumina, Inc., San Diego, CA), as a part of the T2D-GENES consor-tium [34]. All individuals of the dataset were originated from a large Korean cohort named the Korean Association REsource (KARE) study [35]. For our analysis, we selected six phenotypes related to the metabolic disease: SBP, DBP, TG, FASTGLU, WAIST and HDL. In our analysis, we con-sidered 995 individuals with complete phenotypes of inter-est. We then applied two pathway databases Biocarta and KEGG from Molecular Signatures Database [36], which is a curated collection of multiple pathway databases.
Abbreviations
BH:Benjamini-Hochberg; CV: Cross-validation; DBP: Diastolic blood pressure; FASTGLU: Fasting glucose; FDR: False Discovery Rate; GEE: Generalized estimating equations; GWAS: Genome-wide association studies; HDL: High-density lipoprotein; IDF: International Diabetes Federation; KARE: Korean Association REsource; SBP: Systolic blood pressure; TG: Triglycerides; WAIST: Waist circumference; WES: Whole exome sequencing
Acknowledgements
Not applicable.
Funding
Publication costs are funded by the Korea Health Technology R&D Project through the Korea Health Industry Development Institute (KHIDI) grant (HI16C2037). Also, this work was supported by the Bio & Medical Technology Development Program of the National Research Foundation of Korea (NRF) grant (2013M3A9C4078158) and by grants of the Korea Health Technology R&D Project through the Korea Health Industry Development Institute
(KHIDI), funded by the Ministry of Health & Welfare, Republic of Korea (grant number: HI16C2037, HI15C2165, HI16C2048).
Availability of data and materials
We provide PHARAOH-GEE method as a program from the website (http:// statgen.snu.ac.kr/software/pharaoh-gee). The KARE exome sequencing data-set is a part of T2D-GENES consortium, and is available upon approval of T2D-GENES project committee.
About this supplement
This article has been published as part ofBMC Medical Genomics Volume 12 Supplement 5, 2019: Selected articles from the 8th Translational Bioinformatics Conference: Medical Genomics.The full contents of the supplement are available online athttps://bmcmedgenomics.biomedcentral.com/articles/ supplements/volume-12-supplement-5.
Authors’contributions
SL and SK performed all analyses and developed the software
implementation. SL, SK and TP conducted the entire study, developed the methodology, and wrote the manuscript. YK and BO helped with the performing of analyses. HH helped developing the methodology. All of the authors have read and approved of the final manuscript.
Ethics approval and consent to participate
We used the exome sequencing data of 1,037 samples from KARE. KARE study is a part of Korean Genome Epidemiology Study (KoGES), and the dataset was used under the partnership of T2D-GENES. All participants of KARE study provided written informed consent. The study using KARE sam-ples was approved by two independent institutional review boards at Seoul National University.
Consent for publication
Not applicable.
Competing interests
The authors declare that they have no competing interests.
Publisher’s Note
Springer Nature remains neutral with regard to jurisdictional claims in published maps and institutional affiliations.
Author details
1
Center for Precision Medicine, Seoul National University Hospital, Seoul, Korea.2Department of Psychology, McGill University, Montreal, Canada. 3
Department of Statistics, Seoul National University, Seoul, Korea. 4Department of Biochemistry and Molecular Biology, School of Medicine, Kyung Hee University, Seoul, Korea.5Interdisciplinary Program in Bioinformatics, Seoul National University, Seoul, Korea.
Published: 11 July 2019
References
1. MacArthur J, Bowler E, Cerezo M, Gil L, Hall P, Hastings E, Junkins H, McMahon A, Milano A, Morales J, et al. The new NHGRI-EBI catalog of published genome-wide association studies (GWAS catalog). Nucleic Acids Res. 2017;45(D1):D896–901.
2. Maher B. Personal genomes: the case of the missing heritability. Nature. 2008;456(7218):18–21.
3. Manolio TA, Collins FS, Cox NJ, Goldstein DB, Hindorff LA, Hunter DJ, McCarthy MI, Ramos EM, Cardon LR, Chakravarti A, et al. Finding the missing heritability of complex diseases. Nature. 2009;461(7265):747–53.
4. Ahituv N, Kavaslar N, Schackwitz W, Ustaszewska A, Martin J, Hebert S, Doelle H, Ersoy B, Kryukov G, Schmidt S, et al. Medical sequencing at the extremes of human body mass. Am J Hum Genet. 2007;80(4):779–91. 5. Brunham LR, Singaraja RR, Hayden MR. Variations on a gene: rare and
common variants in ABCA1 and their impact on HDL cholesterol levels and atherosclerosis. Annu Rev Nutr. 2006;26:105–29.
7. Slatter TL, Jones GT, Williams MJ, van Rij AM, McCormick SP. Novel rare mutations and promoter haplotypes in ABCA1 contribute to low-HDL-C levels. Clin Genet. 2008;73(2):179–84.
8. Walsh T, McClellan JM, McCarthy SE, Addington AM, Pierce SB, Cooper GM, Nord AS, Kusenda M, Malhotra D, Bhandari A, et al. Rare structural variants disrupt multiple genes in neurodevelopmental pathways in schizophrenia. Science. 2008;320(5875):539–43.
9. Lee S, Choi S, Kim YJ, Kim BJ, T2D-GENES Consortium, Hwang H, Park T. Pathway-based approach using hierarchical components of collapsed rare variants. Bioinformatics. 2016;32(17):i586–94.
10. Lee S, Kim Y, Choi S, Hwang H, Park T. Pathway-based approach using hierarchical components of rare variants to analyze multiple phenotypes. BMC Bioinformatics. 2018;19(Suppl 4:79.
11. Landerman LR, Mustillo SA, Land KC. Modeling repeated measures of dichotomous data: testing whether the within-person trajectory of change varies across levels of between-person factors. Soc Sci Res. 2011;40(5):1456–64. 12. Rasmussen-Torvik LJ, Alonso A, Li M, Kao W, Kottgen A, Yan Y, Couper D,
Boerwinkle E, Bielinski SJ, Pankow JS. Impact of repeated measures and sample selection on genome-wide association studies of fasting glucose. Genet Epidemiol. 2010;34(7):665–73.
13. Mei H, Chen W, Jiang F, He J, Srinivasan S, Smith EN, Schork N, Murray S, Berenson GS. Longitudinal replication studies of GWAS risk SNPs influencing body mass index over the course of childhood and adulthood. PLoS One. 2012;7(2):e31470.
14. Tang W, Kowgier M, Loth DW, Soler Artigas M, Joubert BR, Hodge E, Gharib SA, Smith AV, Ruczinski I, Gudnason V, et al. Large-scale genome-wide association studies and meta-analyses of longitudinal change in adult lung function. PLoS One. 2014;9(7):e100776.
15. Mukherjee B, Ko YA, Vanderweele T, Roy A, Park SK, Chen J. Principal interactions analysis for repeated measures data: application to gene-gene and gene-environment interactions. Stat Med. 2012;31(22):2531–51. 16. Schifano ED, Li L, Christiani DC, Lin X. Genome-wide association analysis for
multiple continuous secondary phenotypes. Am J Hum Genet. 2013;92(5): 744–59.
17. Fan Q, Teo YY, Saw SM. Application of advanced statistics in ophthalmology. Invest Ophthalmol Vis Sci. 2011;52(9):6059–65.
18. Sitlani CM, Rice KM, Lumley T, McKnight B, Cupples LA, Avery CL, Noordam R, Stricker BH, Whitsel EA, Psaty BM. Generalized estimating equations for genome-wide association studies using longitudinal phenotype data. Stat Med. 2015;34(1):118–30.
19. He Z, Zhang M, Lee S, Smith JA, Guo X, Palmas W, Kardia SL, Diez Roux AV, Mukherjee B. Set-based tests for genetic association in longitudinal studies. Biometrics. 2015;71(3):606–15.
20. Wang X, Zhang Z, Morris N, Cai T, Lee S, Wang C, Yu TW, Walsh CA, Lin X. Rare variant association test in family-based sequencing studies. Brief Bioinform. 2017;18(6):954–61.
21. Kim J, Zhang Y, Pan W, Alzheimer's Disease Neuroimaging I. Powerful and adaptive testing for multi-trait and multi-SNP associations with GWAS and sequencing data. Genetics. 2016;203(2):715–31.
22. Lee S, Choi S, Qiao D, Cho M, Silverman EK, Park T, Won S. WISARD: workbench for integrated superfast association studies for related datasets. BMC Med Genet. 2018;11(Suppl 2):39.
23. Benjamini Y, Hochberg Y. Controlling the false discovery rate: a practical and powerful approach to multiple testing. J R Stat Soc Ser B Methodol. 1995;57(1):289–300.
24. Chen G, Ye G, Zhang X, Liu X, Tu Y, Ye Z, Liu J, Guo Q, Wang Z, Wang L, et al. Metabolomics reveals protection of resveratrol in diet-induced metabolic risk factors in abdominal muscle. Cell Physiol Biochem. 2018;45(3):1136–48. 25. Gehart H, Kumpf S, Ittner A, Ricci R. MAPK signalling in cellular metabolism:
stress or wellness? EMBO Rep. 2010;11(11):834–40.
26. Aerts JM, Boot RG, van Eijk M, Groener J, Bijl N, Lombardo E, Bietrix FM, Dekker N, Groen AK, Ottenhoff R, et al. Glycosphingolipids and insulin resistance. Adv Exp Med Biol. 2011;721:99–119.
27. Hwang H, Takane Y. Generalized structured component analysis. Psychometrika. 2004;69(1):81–99.
28. Hoerl AE, Kennard RW. Ridge regression - biased estimation for nonorthogonal problems. Technometrics. 1970;12(1):55.
29. Liang K-Y, Zeger SL. Longitudinal data analysis using generalized linear models. Biometrika. 1986;73(1):13–22.
30. Li B. A deviance function for the quasi-likelihood method. Biometrika. 1993; 80(4):741–53.
31. Wang L, Zhou J, Qu A. Penalized generalized estimating equations for high-dimensional longitudinal data analysis. Biometrics. 2012;68(2):353–60. 32. Westfall PH, Young SS. Resampling-based multiple testing : examples and
methods for P-value adjustment. New York: Wiley; 1993. 33. Li B, Wang G, Leal SM. SimRare: a program to generate and analyze
sequence-based data for association studies of quantitative and qualitative traits. Bioinformatics. 2012;28(20):2703–4.
34. Fuchsberger C, Flannick J, Teslovich TM, Mahajan A, Agarwala V, Gaulton KJ, Ma C, Fontanillas P, Moutsianas L, McCarthy DJ, et al. The genetic architecture of type 2 diabetes. Nature. 2016;536(7614):41–7.
35. Cho YS, Go MJ, Kim YJ, Heo JY, Oh JH, Ban HJ, Yoon D, Lee MH, Kim DJ, Park M, et al. A large-scale genome-wide association study of Asian populations uncovers genetic factors influencing eight quantitative traits. Nat Genet. 2009;41(5):527–34.