Open Access
S O F T W A R E
© 2010 Gribov et al; licensee BioMed Central Ltd. This is an Open Access article distributed under the terms of the Creative Commons Attribution License (http://creativecommons.org/licenses/by/2.0), which permits unrestricted use, distribution, and reproduction in any medium, provided the original work is properly cited.
Software
SEURAT: Visual analytics for the integrated analysis
of microarray data
Alexander Gribov
†1, Martin Sill
†2, Sonja Lück
3, Frank Rücker
3, Konstanze Döhner
3, Lars Bullinger
3, Axel Benner
2and
Antony Unwin*
1Abstract
Background: In translational cancer research, gene expression data is collected together with clinical data and genomic data arising from other chip based high throughput technologies. Software tools for the joint analysis of such high dimensional data sets together with clinical data are required.
Results: We have developed an open source software tool which provides interactive visualization capability for the integrated analysis of high-dimensional gene expression data together with associated clinical data, array CGH data and SNP array data. The different data types are organized by a comprehensive data manager. Interactive tools are provided for all graphics: heatmaps, dendrograms, barcharts, histograms, eventcharts and a chromosome browser, which displays genetic variations along the genome. All graphics are dynamic and fully linked so that any object selected in a graphic will be highlighted in all other graphics. For exploratory data analysis the software provides unsupervised data analytics like clustering, seriation algorithms and biclustering algorithms.
Conclusions: The SEURAT software meets the growing needs of researchers to perform joint analysis of gene expression, genomical and clinical data.
Background
The rapid development of microarray technologies in recent years has led to the possibility of acquiring a large spectrum of different molecular data types. In transla-tional cancer research, gene expression data are usually collected together with additional clinical information and genomic data from other high throughput technolo-gies such as microarray-based comparative genomic hybridization (array CGH) or SNP (single nucleotide polymorphism) arrays. The availability of these related, mostly high-dimensional data sets calls for software tools which can analyze them all together in an integrated fash-ion. Currently there is a lack of such applications that enable exploratory analysis of integrated data sets. Most visualization and clustering tools are limited in their abil-ity to handle gene expression, genomic and clinical data together. To our knowledge only a few software tools are able to perform an integrated analysis.
The VAMP software [1] is able to visualize genomic gain and loss information together with gene expression data. The focus of VAMP is on the comparison of the genomic information between tumors and thus all data types are displayed along the physical position in the genome. It is not possible to reorder the gene expression data according to the expression patterns and clustering algorithms can only be applied to cluster different tumors. A single graphic allows the display of additional clinical data by a simple color code and this representa-tion is limited to categorical variables. In addirepresenta-tion the graphics are not linked, so that each graphic has to be interpreted separately.
Other tools able to visualize gene expression data together with genetic variations and other molecular data types like RNAi data and methylation data are the Inte-grative Genomic Viewer (IGV) [2] developed by the Broad Institute and the Integrated Genome Browser [3]. These tools organize the different data types in the form of tracks within a browser window similar to the well known UCSC Genome Browser. The different data types are displayed one below the other along the physical posi-tions of the genome. This visualization allows the user to
* Correspondence: [email protected]
1 Department of Computer Oriented Statistics and Data Analysis, University of
Augsburg, Universitätsstr. 14, 86159 Augsburg, Germany
† Contributed equally
examine relations between different molecular data at specific known genomic locations, but it is impossible to reveal new trans-regulative relations. Furthermore, with an increasing number of subjects and molecular data types the comparison of the many tracks becomes com-plicated. IGV additionally offers the possibility of aligning clinical data using color codes. For continuous data and especially for time to event data like survival times such a representation is not sufficient.
Besides these open source software solutions, some proprietary software tools are able to perform an inte-grated analysis, e.g., the Genomic Workbench (Agilent Technologies, Santa Clara, California) or Acuity (Enter-prise Microarray Informatics). However, although they can handle the different data types, visualizations are lim-ited to stand alone graphics, not linked to other displays such as clustering results or summary statistics of clinical variables. In order to reveal new biologically meaningful relations possibly hidden inside the different data sets, we follow the philosophy of exploratory data analysis [4]. Our approach to this problem was to develop open source software capable of performing in-depth explor-atory analyses with the help of interactive graphics. In contrast to other software tools that usually aim to visual-ize the information of the different data types within a single graphic, we display each data type in its own graphic and link them using interactive graphics. Each graphic corresponds to the usual visualization of the cor-responding data type and can easily be interpreted. Com-bining these dynamic graphics by linking, so that objects selected are highlighted in all other graphics, and provid-ing unsupervised statistical methods enables users to per-form very effective exploratory analyses. The proposed software does not compete with usual software approaches that offer inferential statistics, but provides a complementary analytical approach. The advantage of our exploratory software regarding the analysis of high-dimensional integrated data sets is demonstrated by an analysis of data collected from acute myeloid leukemia (AML) patients.
Implementation
To ensure portability and platform independence, SEURAT has been written in Java. Most of the GUI ele-ments are based on JAVA Swing packages so that SEURAT has a uniform look and feel independent of the underlying platform. The software establishes a connec-tion to the R statistical software [5] via Rserve [6]. Rserve is a TCP/IP server which allows other programs to com-municate with R. This connection potentially provides access to all functions implemented in R and Bioconduc-tor [7]. For clustering and seriation algorithms SEURAT uses the facilities of the R-packages amap [8], seriation
[9] and biclust [10]. In order to use SEURAT, R, the
rele-vant R packages, and the Java Runtime Environment (JRE) 1.6 need to be installed on the user's computer. The software focuses on performing exploratory, visual analy-ses. To simplify the data import all datasets are assumed to be preprocessed and being in tab-delimited ASCII form. Preprocessing includes the data management and quality control of the different microarray data as well as the normalization, gene filtering and annotation of the data. SEURAT was tested with different data sets, and works well with both data from custom two color gene expression arrays (Stanford 40 k DNA microarrays) and CGH arrays (2.8 k BAC/PAC microarrays) as well as with Affymetrix exon (GeneChip Human Exon 1.0 ST Arrays) and SNP arrays (Genome-Wide Human SNP Arrays 6.0). The preprocessing was performed using R and Biocon-ductor. For the preprocessing of the exon arrays and for extracting raw copy numbers from the SNP array data we used statistical methods available within the R package
aroma.affymetrix [11,12]. To extract the genomic regions showing the same genomic variations from array CGH and SNP data we applied the GLAD (Gain and Loss Anal-ysis of DNA) algorithm [13]. This algorithm is available within the Bioconductor package GLAD as well as within the R package aroma.affymetrix. Alternatively other methods could also be used within this context, e.g. a hid-den Markov model approach [14] or the fast binary seg-mentation algorithm [15]. Additional annotations not available from the Affymetrix annotation files have been added by using the capabilities of BioMart that are acces-sible with the Bioconductor package biomaRt [16]. Detailed R scripts describing each step of the preprocess-ing are available at the project website.
Results and Discussion
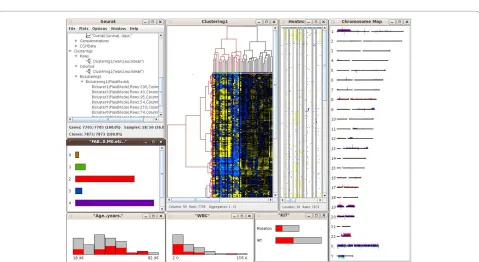
through the branches of the tree showing datasets and objects and access the gene annotations and clinical data. The gene expression matrix is visualized by a heatmap, where the gene expression levels are represented by col-ors. This completely interactive heatmap occupies a cen-tral position in SEURAT and is the starting point for exploratory analyses. To reorder the gene expression matrix, the user can choose from different clustering and seriation algorithms. Until know SEURAT provides agglomerative hierarchical clustering and k-means clus-tering and for both of these clusclus-tering methods several distance functions are available. If interest lies in an ordering of the gene expression matrix rather than find-ing distinct clusters, an orderfind-ing of the genes and samples using one of a number of seriation algorithms can be car-ried out. Seriation algorithms are heuristic procedures that try to find an approximately optimal ordering of a set of objects given a loss or merit function. Both seriation algorithms and clustering algorithms belong to the field of combinatorial data analysis. In this context the optimal order of the leaf nodes of a dendrogram resulting from hierarchical clustering can be interpreted as the seriation result. Principle component analysis and multidimen-sional scaling are established dimension reduction tech-niques for the analysis of high-dimensional microarray data. Within the seriation algorithms SEURAT provides seriation methods that use the first principle component of a PCA or the first MDS dimension to produce an opti-mal ordering. In order to reveal subsets of genes coregu-lated only within a subset of patients SEURAT offers several biclustering algorithms. Biclustering is the simul-taneous clustering of rows and columns of a data matrix. Ordinary one-way clustering algorithms cluster objects using the complete feature space, e.g. a clustering of the genes with respect to the gene expression values of all patients. Biclustering algorithms take into account that correlations between genes may only be present for a sub-set of patients and vice versa. In addition, biclustering algorithms do not assign all objects to a cluster and depending on the biclustering algorithm resulting biclus-ters are allowed to overlap. Genes that are members of more than one bicluster may be regarded as being involved in more than one biological process. A more detailed description of the different unsupervised statisti-cal methods available within SEURAT can be found at the project website. Clustering and seriation results as well as single biclusters are visualized within an interactive heat-map and in the case of hierarchical clustering, interactive dendrograms can also be displayed (Figure 1). For each heatmap additional functions are available, including functions to change the color and pixel settings and func-tions to display the correlation matrices of the genes and samples. The results of applying unsupervised methods are added to the tree view within the data manager
Figure 1 Screen capture of an unsupervised analysis with SEURAT. The screenshot displays the data manager and heatmaps showing the results of different unsupervised methods, e.g. a heatmap with dendrograms that displays the result of hierarchical clustering and a heatmap that shows the result of a seriation generated by PCA. Furthermore the color settings menu, a correlation matrix and a confusion matrix are shown. Two resulting biclusters are visualized by heatmaps. 'Bicluster4' is selected and the corresponding genes and samples are highlighted in all other graphics.
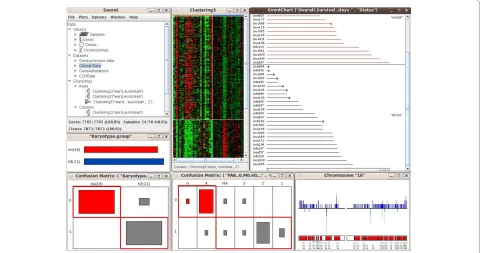
linked with one another, so that any transient selection of objects in one graphic will result in highlighting of the corresponding objects in all other associated graphics. SEURAT provides printing functionality and thus it is possible to export all graphics as pdf files. Testing SEURAT on genomics data derived from acute myeloid leukemia (AML) patients demonstrated the power of this novel analysis tool. Here, the interactive graphics allowed a much faster evaluation of the data enabling the transla-tional researcher to come to meaningful results in a more reasonable time. Furthermore, the interactive graphics and interconnection with clinical data easily allowed the detection of leukemia subgroups of potential biological relevance such as subgroups of AML cases harboring dis-tinct gene expression profiles based on similar underlying secondary genetic aberrations (e.g. AML cases with an inv(16) and an additional trisomy 8; Figure 3).
Conclusions
SEURAT is a new software tool which is capable of inte-grated analysis of gene expression, array CGH and SNP array and clinical data using interactive graphics. The focus of SEURAT is on exploratory analysis that enables biological and medical experts to uncover new relations in high-dimensional biological and clinical datasets and thus supports the process of hypothesis generation. To our knowledge, no other software that aims to perform
integrated analysis of microarray data offers such a high level of interactivity. The concept of combining many interactive graphics by logical linking and the broad spec-trum of unsupervised methods is unique. Because of the object oriented design of the software it will be possible to add additional graphics like parallel coordinates with interactive capability. In addition, with the use of Rserve, the complete functionality of R and Bioconductor is avail-able to include more statistical methods in SEURAT. In particular, further clustering algorithms (e.g. model-based clustering) will be investigated for adoption in later versions of SEURAT. In the future, we plan to adapt SEURAT to integrate other microarray based data types such as loss of heterozygosity data, also available from SNP arrays, as well as information from protein arrays or epigenetic data arising from methylation arrays. While this will further improve SEURAT, the current version already provides a powerful means for the integrative and interactive analysis of complex genomics data sets. Therefore, SEURAT will likely contribute to refined insights into cancer biology such as acute myeloid leuke-mia.
Availability and requirements
Project name: SEURAT
Project home page: http://seurat.r-forge.r-project.org/
Operating system(s): Platform independent
Programming language: Java and R
Other requirements: Java 1.6 or higher, R 2.8 or higher, R-packages: Rserve, amap, seriation and biclust License: GNU GPLv3
Any restrictions to use by non-academics: None
Abbreviations
AML: acute myeloid leukemia; ASCII: American Standard Code for Information Interchange; BAC/PAC: bacterial artificial chromosome/P1-derived artificial chromosome; CGH: comparative genomic hybridization; FAB classification: French American British classification; GUI: graphical user interface; inv(16): inversion mutation at chromosome 16; JRE: Java Runtime Environment; RNAi: RNA interference; SNP: single nucleotide polymorphism; TCP/IP: Transmission Control Protocol/Internet Protocol; t(8,21): translocation mutation between chromosome 8 and 21.
Competing interests
The authors declare that they have no competing interests.
Authors' contributions
LB, AB and AU conceived the software. AG was responsible for the software architecture and implementation. MS, SL, LB, AB, and AU were involved in designing and testing the software. MS preprocessed and annotated the example data sets and wrote the documentation. FR and KD collected the clin-ical and molecular data. MS wrote the manuscript and all authors revised and approved the final manuscript. AG and MS contributed equally.
Acknowledgements
This project was supported by the Deutsche José Carreras Leukämie-Stiftung e.V. (Project Number 07/30v and 07/09v).
Author Details
1Department of Computer Oriented Statistics and Data Analysis, University of
Augsburg, Universitätsstr. 14, 86159 Augsburg, Germany, 2Division of
Biostatistics, German Cancer Research Center, Im Neuenheimer Feld 280, 69120 Heidelberg, Germany and 3Department of Internal Medicine III,
University Hospital of Ulm, Albert-Einstein-Allee 23, D-89081 Ulm, Germany
References
1. Rosa PL, Viara E, Huppé P, Pierron G, Liva S, Neuvial P, Brito I, Lair S, Servant N, Robine N, Manipé E, Brennetot C, Janoueix-Lerosey I, Raynal V, Gruel N, Rouveirol C, Stransky N, Stern MH, Delattre O, Aurias A, Radvanyi F, Barillot E: VAMP: visualization and analysis of array-CGH, transcriptome and other molecular profiles. Bioinformatics 2006, 22(17):2066-2073. 2. Broad Institute: Integrative Genomics Viewer. [http://
www.broadinstitute.org/igv].
3. Nicol JW, Helt GA, Blanchard SG, Raja A, Loraine AE: The Integrated Genome Browser: free software for distribution and exploration of genome-scale datasets. Bioinformatics 2009, 25(20):2730-2731. 4. Tukey JW: Exploratory Data Analysis. Reading, Mass, Addison-Wesley;
1977.
5. Ihaka R, Gentleman R: R: A Language for Data Analysis and Graphics.
Journal of Computational and Graphical Statistics 1996, 5(3):299-314. 6. Urbanek S: Rserve -- A Fast Way to Provide R Functionality to
Applications. Proceedings of the 3rd International Workshop on Distributed Statistical Computing (DSC 2003) 2003:20-22.
7. Gentleman RC, Carey VJ, Batesa DM, Bolstad B, Dettling M, Dudoit S, Ellis B, Garnier L, Ge Y, Gentry J, Hornik K, Hothorn T, Huber W, Iacus S, Irizarry R, Leisch F, Li C, Maechler M, Rossi AJ, Sawitzki G, Smith C, Smyth G, Tierney L, Ynag JY, Zhang J: Bioconductor: open software development for computational biology and bioinformatics. Genome Biology 2004,
5((R80)):.
8. Lucas A: amap: Another Multidimensional Analysis Package 2010, Version 0.8-5. [http://cran.r-project.org/web/packages/amap/ index.html].
9. Hahsler M, Hornik K, Buchter C: Getting Things in Order: An Introduction to the R Package seriation. Journal of Statistical Software 2008, 25:.
10. Kaiser S, Santamaria R, Sill M, Theron R, Quintales L, Leisch F: biclust: BiCluster Algorithms. Version 0.9.1 2009 [http://cran.r-project.org/web/ packages/biclust/index.html].
11. Bengtsson H, Simpson K, Bullard J, Hansen K: aroma.affymetrix: A generic framework in R for analyzing small to very large Affymetrix data sets in bounded memory. Tech. rep., Department of Statistics, University of California, Berkeley; 2008.
12. Bengtsson H, Irizarry R, Carvalho B, Speed TP: Estimation and assessment of raw copy numbers at the single locus level. Bioinformatics 2008,
24(6):759-767.
13. Hupé P, Stransky N, Thiery JPP, Radvanyi F, Barillot E: Analysis of array CGH data: from signal ratio to gain and loss of DNA regions.
Bioinformatics (Oxford, England) 2004, 20(18):3413-3422.
14. Fridlyand J, Snijders AM, Pinkel D, Albertson DG, Jain : Hidden Markov models approach to the analysis of array CGH data. Journal of Multivariate Analysis 2004, 90:132-153.
15. Venkatraman ES, Olshen AB: A faster circular binary segmentation algorithm for the analysis of array CGH data. Bioinformatics 2007,
23(6):657-663.
16. Durinck S, Moreau Y, Kasprzyk A, Davis S, De Moor B, Brazma A, Huber W:
BioMart and Bioconductor: a powerful link between biological databases and microarray data analysis. Bioinformatics 2005,
21(16):3439-3440.
17. Goldman A: EVENTCHARTS: Visualizing Survival and Other Timed-Events Data. The American Statistician 1992, 46:13-18.
Pre-publication history
The pre-publication history for this paper can be accessed here: http://www.biomedcentral.com/1755-8794/3/21/prepub
doi: 10.1186/1755-8794-3-21
Cite this article as: Gribov et al., SEURAT: Visual analytics for the integrated analysis of microarray data BMC Medical Genomics 2010, 3:21
Received: 11 March 2010 Accepted: 3 June 2010 Published: 3 June 2010
This article is available from: http://www.biomedcentral.com/1755-8794/3/21 © 2010 Gribov et al; licensee BioMed Central Ltd.
This is an Open Access article distributed under the terms of the Creative Commons Attribution License (http://creativecommons.org/licenses/by/2.0), which permits unrestricted use, distribution, and reproduction in any medium, provided the original work is properly cited.