O R I G I N A L A R T I C L E
Open Access
Adaptation effects in static postural control
by providing simultaneous visual feedback
of center of pressure and center of gravity
Kenta Takeda
1, Hiroki Mani
2, Naoya Hasegawa
1, Yuki Sato
1, Shintaro Tanaka
1, Hiroshi Maejima
2and Tadayoshi Asaka
2*Abstract
Background:The benefit of visual feedback of the center of pressure (COP) on quiet standing is still debatable. This study aimed to investigate the adaptation effects of visual feedback training using both the COP and center of gravity (COG) during quiet standing.
Methods:Thirty-four healthy young adults were divided into three groups randomly (COP + COG, COP, and control groups). A force plate was used to calculate the coordinates of the COP in the anteroposterior (COPAP)
and mediolateral (COPML) directions. A motion analysis system was used to calculate the coordinates of the
center of mass (COM) in both directions (COMAPand COMML). The coordinates of the COG in the AP direction
(COGAP) were obtained from the force plate signals. Augmented visual feedback was presented on a screen in
the form of fluctuation circles in the vertical direction that moved upward as the COPAPand/or COGAPmoved
forward and vice versa. The COP + COG group received the real-time COPAPand COGAPfeedback simultaneously,
whereas the COP group received the real-time COPAPfeedback only. The control group received no visual feedback. In
the training session, the COP + COG group was required to maintain an even distance between the COPAPand COGAP
and reduce the COGAPfluctuation, whereas the COP group was required to reduce the COPAPfluctuation while
standing on a foam pad. In test sessions, participants were instructed to keep their standing posture as quiet as possible on the foam pad before (pre-session) and after (post-session) the training sessions.
Results:In the post-session, the velocity and root mean square of COMAPin the COP + COG group were lower
than those in the control group. In addition, the absolute value of the sum of the COP−COM distances in the COP + COG group was lower than that in the COP group. Furthermore, positive correlations were found between the COMAPvelocity and COP−COM parameters.
Conclusions:The results suggest that the novel visual feedback training that incorporates the COPAP–COGAP
interaction reduces postural sway better than the training using the COPAPalone during quiet standing. That is,
even COPAPfluctuation around the COGAPwould be effective in reducing the COMAPvelocity.
Keywords:Center of gravity, Center of mass, Center of pressure, Static posture, Visual feedback training
* Correspondence:[email protected]
2Department of Rehabilitation Science, Faculty of Health Sciences, Hokkaido
University, N12-W5, Kita-ku, Sapporo, Hokkaido 060-0812, Japan Full list of author information is available at the end of the article
Introduction
The ability to maintain balance in static postures relies on the ability of the central nervous system to control movements or positional fluctuations by using the body’s center of mass (COM) so that it remains within safe boundaries above the base of support [1, 2]. If static bal-ance during quiet standing is controlled by shifting the center of pressure (COP) through the feet, the body will move as a single segment, often modeled as an inverted pendulum [3]. Previous studies have reported that the augmented visual feedback of the COP has been used for static balance training [4–6].
However, the benefits gained from visual feedback of the COP during quiet standing are still under debate [7, 8]. Kilby et al. reported that the real-time visual feedback of neither the COP nor the COM affected the postural motion of healthy adults during quiet standing [9]; in other words, neither the COP nor the COM velocities changed when conditions were altered between a pres-ence and lack of augmented visual feedback. In addition, the participants in the study of Lakhani et al. showed no postural stability learning effects when visual feedback training was using either as a vertical projection of the COM onto the ground (i.e., the center of gravity (COG)) or the COP during quiet standing [10]. In fact, under no feedback conditions did the root mean square values of the COP or COG change between the pre-training and post-training sessions.
The impact of the difference in position between the COP and COG (COP–COG distance) on postural stability in static balance has also been investigated [11]. A larger COP–COG distance has been shown to indicate greater body acceleration during quiet standing [12, 13]. During quiet standing, the COP–COG distance increases with age and depends on whether the participant’s eyes are closed or open [12, 14]. Postural instability may result from biased positioning of the COP relative to the COG, as this will result in a unidirectional moment acting on the COM [3]. In fact, Mani et al. reported that elderly participants were not able to maintain equilibrium standing on one leg when the position of the COP was biased relative to the COG, such as when the COP was located laterally in the direction of the supporting leg, while the younger group of participants experienced less difficulty [14]. In addition,
Ibuki et al. reported that the COP−COM distance de-creased and the COP fluctuated more evenly around the COM during one-legged standing in the ballet dancer group than in the control group [15]. These findings imply that feedback training incorporating the interaction between the COP and COG may be more effective for improving static balance than training using the COP or COG alone.
With this background in mind, the purpose of this study was to investigate the adaptive effects of augmented visual feedback training using both the COP and COG, as compared to training using only the COP, during quiet standing. The hypothesis was that novel balance training, which incorporates the interaction between the COP and COG using simultaneously the visual feedback of both, would reduce postural sway compared to training that used the COP alone without feedback. The findings of this study could contribute toward the development of an effective visual feedback training system for improving postural static balance.
Methods
Participants
Thirty-four healthy young adults without any known neurological, motor, or visual disorders or disabilities participated in this study. All the study protocols were approved by the ethics committee of the institution where the study was conducted, and written informed consent was obtained from all participants according to the Dec-laration of Helsinki. The age, sex, height, body weight, and foot length of each participant were recorded (Table 1). The participants were divided randomly into three groups. The first group, i.e., the COP group, received visual feed-back of their real-time COP during the training session. The second group, i.e., the COP + COG group, received real-time visual feedback of their COG as well as their COP during the training session. The third group, i.e., the control group, received no visual feedback and was instructed to focus on a fixed visual target.
Equipment
Kinematic data were collected using a six-camera 3D motion analysis system (Motion Analysis Corporation, Santa Rosa, CA, USA) at a sampling frequency of 200 Hz.
Table 1The characteristics of the COP, COP + COG, and control groups
COP (n= 11) COP + COG (n= 12) Control (n= 11)
Age (years) 23.2 ± 2.3 22.8 ± 1.6 22.3 ± 2.4
Sex Male 6, female 5 Male 8, female 4 Male 5, female 6
Height (cm) 165.7 ± 6.9 169.2 ± 7.6 164.5 ± 8.3
Body weight (kg) 56.8 ± 7.5 59.7 ± 9.0 57.0 ± 9.2
Foot length (cm) 24.2 ± 1.8 24.5 ± 1.6 23.2 ± 1.7
Twenty reflective markers were attached to the following bony landmarks: the acromioclavicular joint, the lateral epicondyle of the upper arm, the wrist, the head of the second metacarpal, the great trochanter of the femur, the lateral malleolus, the second metatarsal head, the calca-neus, and the C7, S1, and bilateral point of the external acoustic foramen. These markers were used to calculate the COM in the anteroposterior (AP) and mediolateral (ML) directions (COMAPand COMML), based on the 14
body segments and an anthropometrical model [3]. A force plate (Kistler, Winterthur, Switzerland) was used to calculate the coordinates of the COP in the AP (COPAP;
Appendix 1) and ML (COPML) directions. Force plate
sig-nals were collected at a sampling frequency of 1000 Hz and synchronized with the motion analysis system. The real-time COG in the AP direction (COGAP) was obtained
from the force plate signals (Appendix 2) [10, 12].
Augmented visual feedback was provided in the form of fluctuating circles moving vertically upward as the COPAP and COGAP moved forward and downward as
they moved backward. LabVIEW software (National In-struments, USA) was used to present this feedback on a screen (height 1.8 m, width 2.5 m) located approximately 5 m away from the participant. The vertical movement of the circles on the screen was 16 times greater than the true COPAPand COGAPdisplacements [16].
Procedures
The participants stood with both their feet placed on a foam pad (thickness 6.5 cm, SAKAI Medical, Japan) throughout the pre-training, training, and post-training sessions. Only the AP direction was applied to reduce feedback complexity and allow the participants to focus on minimizing COP and COG fluctuations along a sin-gle axis [10]. The distance of the two horizontal lines on the screen corresponded to the two standard deviations (SD) of the first COGAP displacement measurement.
The center point between the two lines identified the center of the force plate in the AP direction.
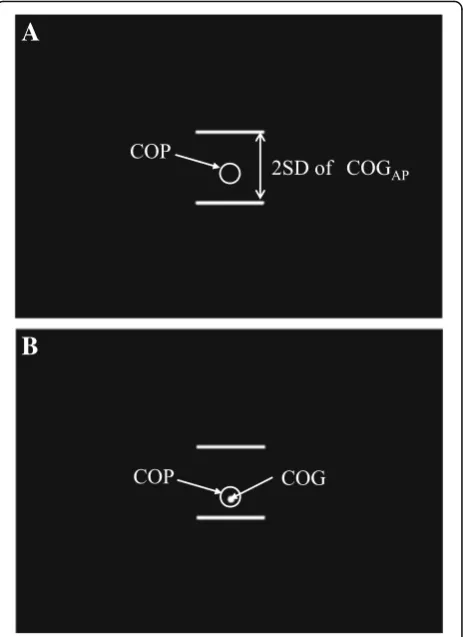
In the pre- and post-training test sessions (hereafter called pre-session and post-session, respectively), partici-pants were required to lock their eyes on the fixed visual target and stand as steadily as possible for 60 s. In the training session, participants in the COP group were re-quired to align the center of the blank circle (φ13.5 cm), which represented their COPAP, to the center of the two
horizontal lines for 40 s (Fig. 1a). The participants in the COP + COG group were required to align the center of the filled circle to the center of the horizontal lines and maintain an even distance in the up-down direction be-tween the blank and filled circles (φ4.5 cm), which re-spectively represented their COPAPand COGAP, for 40 s
(Fig. 1b). In practice, this required the participants to keep the filled circle inside the blank circle. The participants in
the control group were instructed to lock their eyes on a fixed visual target and stand as steadily as possible for 40 s.
The participants were instructed to stand barefoot with their arms across their chest in front of a visual tar-get located at an eye-level height on the screen. First, to measure the SD of the COGAPdisplacements, each
par-ticipant was instructed to stand quietly with both feet placed together on the force plate with their eyes open for 10 s. Horizontal lines, indicating the two SDs of each participant, were also projected on the screen during the training session (Fig. 1). Subsequently, the participants were required to stand on the foam pad, which was at-tached to the force plate with double-sided adhesive tapes, as steadily as possible with their feet placed to-gether. The position of the feet on the pad was stan-dardized: the center of the force plate in the sagittal plane was matched with the position of the feet 40%
Fig. 1Visual feedback on screen for theaCOP group andbCOP + COG group.Blank circlesrepresent the real-time COPAP, andfilled circle
represent the real-time COGAP. Thesecirclesmove in the vertical direction
16 times greater than the real amount of COPAPor COGAPmovements.
down the length from the heel [17]. The exact location where the feet were to be placed was marked on the pad to ensure that all the participants started with the same foot position in each trial. Each participant was asked to perform 12 trials with a 5-min rest after the first six trials. The break between trials was approxi-mately 1 min, while the time between the trials and pre- or post-sessions was 5 min.
Data and statistical analysis
All signals were processed offline using MATLAB soft-ware (MathWorks, Natick, MA, USA). The motion ana-lysis system data were filtered with a fourth-order 20-Hz low-pass zero-lag Butterworth filter, and the force plate data were filtered with a fourth-order 8-Hz low-pass zero-lag Butterworth filter. Although the signals ob-tained in the pre- and post-sessions had a duration of 60 s, only 50-s durations of the signals were analyzed, excluding the initial and final 5 s. The mean absolute velocities and root mean squares of both the COP and COM in the AP and ML directions (COPAP/ML velocity
and COMAP/MLvelocity, COPAP/MLRMS and COMAP/ML
RMS) were calculated to assess postural stability. Further-more, the mean absolute value of the COP−COM dis-tance (COP−COMclose, Eq. 1) and the absolute value of
the sum of the COP−COM distance (COP−COMeven,
Eq. 2) in the AP direction were calculated as follows:
COP−COMclose¼
XN
t¼1jCOPt−COMtj
N ð1Þ
COP−COMeven¼
XN
t¼1ðCOPt−COMtÞ
ð2Þ
where N is the total sampling number. Thus, a lower value of COP−COMclose indicated that movements of
the COP were held closer to the COM in the AP direc-tion. A shorter COP−COMeven indicated that the COP
position was more even, with fewer fluctuations around the COM in the AP direction. All parameters were nor-malized by the foot length (FL) of each participant.
Both one-way and two-way mixed-design ANOVA were used in each group (factorGroup: COP, COP + COG, and control); one-way ANOVA was used to identify and analyze differences in biomechanical characteristics, and two-way mixed-design ANOVA compared the group data to test sessions (factorTest Session: pre and post) to analyze possible differences in the value of the indices. A post hoc analysis was performed using Bonferroni pairwise compari-son, and Pearson’s correlation coefficient was used to iden-tify and analyze correlations between the COMAPvelocity
and COP−COM parameters. The statistical significance was set top< 0.05 for all tests.
Results
No significant differences were observed among the three groups in terms of age (F2, 31= 0.500, p= 0.611), height
(F2, 31= 1.170,p= 0.324), weight (F2, 31= 0.391,p= 0.680),
and foot length (F2, 31= 1.779,p= 0.186) (Table 1).
Figure 2 shows the characteristic data of COMAPand
COPAPvelocity profiles in the pre- and post-sessions for
each group. In the COP + COG group, the amplitude of the COMAP velocity during the post-session decreased
compared to the pre-session values, while the amplitude of the COPAP velocity did not change. Table 2 lists the
mean and SD of velocities and RMSs of both the COM and COP in the AP and ML directions.
No significant effect was observed on the COMAP
vel-ocity between Group factors (F2, 31= 0.946, p= 0.399).
However, the COMAPvelocity showed a significant change
betweenTest sessionfactors (F1, 31= 42.361,p< 0.001). A
significant interaction was observed between the Group and Test session factors in terms of the COMAP velocity
(F2, 31= 3.391,p= 0.047). The post hoc test revealed that
post-session COMAP velocity values were significantly
lower in the COP + COG group compared to those in the control group (p= 0.047). For both the COP + COG and control groups, the COMAP velocity in the post-session
was significantly lower than that in the pre-session (p< 0.001); however, no significant difference was observed
Fig. 2The typical data of COMAPand COPAPvelocity profiles. The
data of the COP + COG, COP, and control groups are represented from thetoptobottom columns, respectively. Thegray lines
represent velocities during the pre-test session, and theblack lines
in the COP group between the pre- and post-sessions (p= 0.117).
In terms of COMAP RMS, no significant main effect
was observed for the factor Test session(F1, 31= 0.979,
p= 0.330), nor was there a significant interaction (F2, 31=
1.036, p= 0.367). On the other hand, the COMAP RMS
showed a significant main effect for the factor Group (F2, 31= 4.158, p= 0.025). The post hoc test revealed
that the overall COMAPRMS of the COP + COG group
was significantly lower than that of the control group (p= 0.042), while there was no significant difference be-tween that of the COP and control groups (p= 0.068). The post-session COMAP RMS of the COP + COG
group was significantly lower than that of the control group (p= 0.022); however, there was no significant dif-ference in the pre-session (p= 0.154).
In terms of the COPAP velocity and COPAP RMS, no
significant differences were observed between theGroup (COPAP velocity F2, 31= 0.443, p= 0.646; COPAP RMS
F2, 31= 2.199, p= 0.128) and Test session factors
(COPAP velocity F1, 31= 2.544, p= 0.121; COPAP RMS
F1, 31= 3.106, p= 0.088). No significant interaction
(COPAP velocity F2, 31= 1.520, p= 0.235; COPAP RMS
F2, 31= 0.797,p= 0.460; Table 2) was observed.
With regard to COMML velocity and COMML RMS,
no significant main effect was observed for the factor Group(COMMLvelocityF2, 31= 2.329,p= 0.114; COMML
RMSF2, 31= 2.842,p= 0.074), nor was there a significant
interaction (COMML velocity F2, 31= 0.121, p= 0.887;
COMML RMS F2, 31= 2.049, p= 0.146). In contrast, the
COMML velocity and COMML RMS showed significant
main effects for the factor Test session(COMMLvelocity
F1, 31= 12.497, p= 0.001; COMML RMS F1, 31= 8.57,
p= 0.006). The post hoc test revealed that the post-session COMML velocity of the COP group was
signifi-cantly lower than that for the pre-session (p= 0.04). However, in the COP + COG and control groups, no
significant difference was observed between the sessions (COP + COG group, p= 0.125; control group, p= 0.056). Meanwhile, the post-session COMML RMS of the COP
group was significantly higher than that for the pre-session (p= 0.009). The COMMLRMS of the COP + COG
and control groups showed no significant difference be-tween the sessions (COP + COG group, p= 0.82; control group,p= 0.114).
With regard to COPMLvelocity, no significant main effect
was observed for the factor Group (F2, 31= 0.722, p=
0.494), nor was there a significant interaction (F2, 31= 0.526,
p= 0.596). On the contrary, the COPMLvelocity presented
a significant main effect for the factorTest session(F1, 31=
15.86,p< 0.001). The post hoc test revealed that the post-session COPMLvelocity of the COP group was
signifi-cantly lower than that for the pre-session (p< 0.001). However, in the COP + COG and control groups, no significant difference was found between the sessions (COP + COG group,p= 0.081; control group,p= 0.195).
Meanwhile, the COPMLRMS demonstrated no significant
differences between theGroup(F2, 31= 2.697,p= 0.083) and
Test session factors (F1, 31= 0.24,p= 0.628). No significant
interaction (F2, 31= 0.789,p= 0.463) was observed.
No significant differences were observed between the Group (F2, 31= 2.162, p= 0.132) or Test session factors
(F1, 31= 0.047, p= 0.829) in terms of COP−COMeven.
A significant COP−COMeveninteraction was observed
between the two factors (F2, 31= 3.517, p= 0.042;
Fig. 3a): The post hoc test revealed that the post-session COP−COMevenwas significantly smaller for the
COP + COG group than that for the pre-session (p= 0.002). On the other hand, no significant difference was observed between the pre- and post-sessions in the COP group (p= 0.234). Furthermore, the COP−COMeven for
the COP + COG group was significantly smaller than that for the COP group (p< 0.001) or control group (p= 0.033) in the post-session.
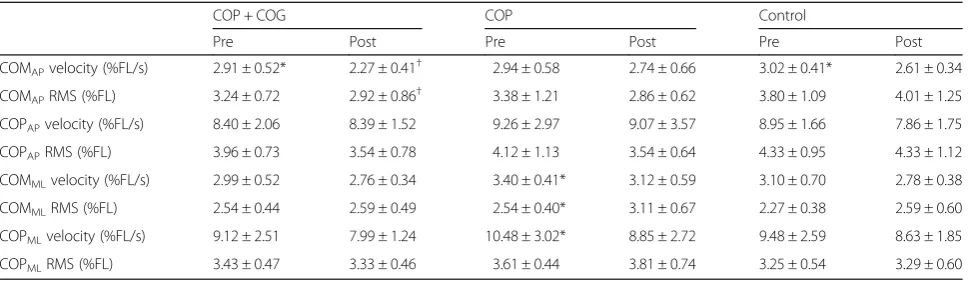
Table 2The results of postural stability
COP + COG COP Control
Pre Post Pre Post Pre Post
COMAPvelocity (%FL/s) 2.91 ± 0.52* 2.27 ± 0.41† 2.94 ± 0.58 2.74 ± 0.66 3.02 ± 0.41* 2.61 ± 0.34
COMAPRMS (%FL) 3.24 ± 0.72 2.92 ± 0.86† 3.38 ± 1.21 2.86 ± 0.62 3.80 ± 1.09 4.01 ± 1.25
COPAPvelocity (%FL/s) 8.40 ± 2.06 8.39 ± 1.52 9.26 ± 2.97 9.07 ± 3.57 8.95 ± 1.66 7.86 ± 1.75
COPAPRMS (%FL) 3.96 ± 0.73 3.54 ± 0.78 4.12 ± 1.13 3.54 ± 0.64 4.33 ± 0.95 4.33 ± 1.12
COMMLvelocity (%FL/s) 2.99 ± 0.52 2.76 ± 0.34 3.40 ± 0.41* 3.12 ± 0.59 3.10 ± 0.70 2.78 ± 0.38
COMMLRMS (%FL) 2.54 ± 0.44 2.59 ± 0.49 2.54 ± 0.40* 3.11 ± 0.67 2.27 ± 0.38 2.59 ± 0.60
COPMLvelocity (%FL/s) 9.12 ± 2.51 7.99 ± 1.24 10.48 ± 3.02* 8.85 ± 2.72 9.48 ± 2.59 8.63 ± 1.85
COPMLRMS (%FL) 3.43 ± 0.47 3.33 ± 0.46 3.61 ± 0.44 3.81 ± 0.74 3.25 ± 0.54 3.29 ± 0.60
Mean ± SD
*p< 0.05, between test sessions
In terms of COP−COMclose, no significant effects were
observed for the factor Group (F2, 31= 1.457, p= 0.248)
and no significant interaction (F2, 31= 1.267, p= 0.296)
was observed. On the other hand, the factor Test session showed significant discrepancies (F1, 31= 11.884,p= 0.002;
Fig. 3b).
In the post-session, significant positive correlations were observed between the COM velocity and COP−COMeven
in the COP + COG group (r= 0.729, p< 0.01) and the COP group (r= 0.526, p< 0.05). Significant positive correlations were observed between the COM velocity and COP−COMclosein the COP + COG group (r= 0.823,
p< 0.01) and the COP group (r= 0.843,p< 0.01). No sig-nificant correlations were observed between the COM vel-ocity and COP−COMeven(r=−0.291,p> 0.05) or COP
−COMclose (r= 0.457, p> 0.05) in the control group.
Significant positive correlations were observed be-tween the COM velocity and COP−COMeven(r= 0.670,
p< 0.01: Fig. 4a) as well as COP−COMclose(r= 0.798,p<
0.01: Fig. 4b) for the combined data of the COP + COG and COP groups.
Discussion
The mean absolute velocity of the COM has been proven to be a highly reliable and sensitive indicator of postural sway [18, 19]. The main finding of this study is that the COMAP velocity decreased after the training
session in the COP + COG and control groups, but not in the COP group. The COMAP velocity in the COP +
COG group was lower than that in the control group during post-session quiet standing (Table 2). Further-more, the COMAP RMS was significantly lower in the
COP + COG group compared to that in the control group following training. These results suggest that training con-ducted using simultaneous COPAP and COGAP visual
feedback increases postural stability compared to training using the COPAP alone under a no-feedback condition.
Therefore, the results of this study have confirmed the hypothesis.
The effects that were related to a decrease in the post-session COMAP velocity would be enhanced by even
Fig. 3Mean ± SD ofaCOP−COMevenandbCOP−COMclosefor
both groups in pre- and post-sessions. Thewhite circlesrepresent the COP group, thegray squaresrepresent the COP + COG group, and thedark gray trianglesrepresent the control group. COP−COMevenfor
the COP + COG group is seen to be significantly smaller than that for the COP group in the post-session (*p< 0.05). For the COP + COG group, COP−COMevenin the post-session was significantly smaller
than that in the pre-session (*p< 0.05). The data were normalized by the foot length (FL) for each participant
Fig. 4Relationship between the COMAPvelocity,aCOP−COMeven,
andbCOP−COMclose. A significant positive correlation was observed
between the COMAPvelocity and COP−COMeven(r= 0.670) and
COP−COMclose(r= 0.789). The data for COP + COG and COP
fluctuations of the COPAP around the COGAP (Fig. 3a)
because of the significant correlation between the COMAPvelocity and COP−COMeven(Fig. 4a).
Accord-ing to the inverted pendulum model, inertial forces produced by even fluctuations of the COP toward the COG restrain COM movements toward the center of its fluctuation range; this is because the COP−COM distance reflects the moment arm for inertial forces, such as propulsion toward the COM or braking against movements toward the COM [20, 21].
Interestingly, the COPAP velocity did not decrease
even though the COMAPvelocity decreased in the
post-session for each group (Table 2). In general, minimizing the COM displacement would be expected to result in a concurrent decrease in the COP displacement [22]. However, Carpenter et al. [23] and Murnaghan et al. [24] showed that COP displacements increased when COM movements were stabilized. They proposed that COP fluctuations played an exploratory role, gathering sensory information during quiet standing. The results of this study indicate that a decrease in the COMAP
vel-ocity do not result in a concurrent decrease in the COPAP velocity; as such, the COP and COM velocities
may realistically behave in different ways.
No significant differences of the velocity and the RMS of COM and COP between the pre- and post-sessions were found in the COP + COG group in the ML direc-tion. Therefore, the decreased postural stability in the ML direction after the training could not be confirmed in the COP + COG group. Interestingly, the COMML
and COPML velocities in the COP group decreased after
the training. However, the increased postural stability in the ML direction could not be confirmed because the COMML RMS in the COP group increased after the
training. The standing postural controls for the AP or ML direction are involved in two distinct ankle and hip mechanisms [3]. The possibility effects of the postural control during quiet standing between the two mecha-nisms by the feedback training should be further investi-gated in future studies [25].
We suspect that efforts to maintain the COPAPat an
even distance from the COGAP may have indirectly
contributed to reducing the COP−COM distance; however, no interaction was observed in terms of COP−COMclose. The quantitative results of this study
showed that the COMAP velocity was correlated to
COP−COMclose (Fig. 4b). Therefore, adding visual
targets indicating the COPAP and COGAP (e.g., two
other horizontal lines positioned along the centers of the blank circle representing the COPAPand the filled
circle representing the COGAP) and requiring
partici-pants to reduce the distance between these two hori-zontal lines may also be effective to decelerate the COMAP velocity.
The limitation of this study is that experiments were performed with a small sample size of participants. In addition, the adaptation effects of training may not be detected sufficiently with the small amount of training the participants underwent. Therefore, the training ef-fects in the COP group may not be detected, although the COMAPvelocity in the control group decreased after
training. Furthermore, the force under the feet may not be identical to that under the foam pad because the force or moment could spread in the pad. The learning effects of this novel balance training should be further investigated with a retention test and applied to individ-uals with postural instability in future studies.
Conclusion
Simultaneous visual feedback training that uses both the COPAPand COGAP, and focuses on their interaction,
re-duces postural sway during quiet standing better than the training designed to affect only the COPAPunder the
no-feedback condition. It can therefore be stated that even COPAP fluctuations around the COGAP would be
effective for maintaining postural static balance through an associated reduction in COMAPvelocity.
Appendix 1
The COPAPwas calculated as follows:
COPAP¼
Fyð−D0−DmatÞ þMx
Fz ð3Þ
whereFyand Fzdenote the force in the AP and vertical directions, respectively. Mxdenotes the moment around the lateral axis.D0andDmatdenote the thickness of the
force plate and the foam pad, respectively.
Appendix 2
If human posture during quiet standing can be approxi-mated as an inverted pendulum, the equation of motion can be described as follows:
Iθ€¼mgh sin θ−T ð4Þ
wheremis the mass of the body excluding feet, gis the gravitational acceleration coefficient, h is the distance between COM and the ankle joint, I is the moment of inertia of the body about the ankle joint, θ is the body angle to vertical axis,θ€ is the body angular acceleration, and T is the ankle torque produced about the partici-pant’s ankle joint. Assuming that the body sway ampli-tude is small, T≈mgCOP and mgh sin θ mgCOG. Thus, the right-hand side of Eq. (3) can be rewritten as −mg(COP−COG). Considering an additional ap-proximation of €θ≈COM€ =h¼ACC=h¼FY=mh, Eq. (3)
COGAP ¼ COPAP−
1 mgh
Fym0 ð5Þ
whereFyis the force in the AP direction.
m¼0:971M; ð6Þ
h¼ 0:547H; ð7Þ
I¼0:319MH2; ð8Þ
where M is the participant mass of body in kilograms and H is the participant height in meters.
The details of the derivation steps and the anthropo-metric estimation of body dimensions can be obtained from previous reports [3, 12].
Funding
This work was supported in part by a Japanese Grant-in-Aid for Scientific Research (25350747, 16K16420).
Availability of data and materials
The datasets during and/or analyzed during the current study are available from the corresponding author on reasonable request.
Authors’contributions
TA, KT, and HMan designed the study. TA and HMae supervised the project. KT, HMan, NH, YS, and ST recorded, analyzed, and interpreted the data. TA and KT wrote the manuscript. All authors read and approved the final manuscript.
Ethics approval and consent to participate
All participants gave written informed consent after a complete explanation of this study. This study was approved by the Institutional Review Board, Faculty of Health Sciences of Hokkaido University.
Consent for publication
All participants gave written informed consent for publication after a complete explanation of this study.
Competing interests
The authors declare that they have no competing interests.
Publisher’s Note
Springer Nature remains neutral with regard to jurisdictional claims in published maps and institutional affiliations.
Author details
1Graduate School of Health Sciences, Hokkaido University, N12-W5, Kita-ku,
Sapporo, Hokkaido 060-0812, Japan.2Department of Rehabilitation Science, Faculty of Health Sciences, Hokkaido University, N12-W5, Kita-ku, Sapporo, Hokkaido 060-0812, Japan.
Received: 20 December 2016 Accepted: 4 July 2017
References
1. Shumway-Cook A, Wollacott M. Motor control: translating research into clinical practice. 4th ed. Philadelphia: Lippincott Williams &Wilkins; 2011. 2. Riach CL, Starkes JL. Stability limits of quiet standing postural control in
children and adults. Gait Posture. 1993;1:105–11.
3. Winter DA. Biomechanics and motor control of human movement. 4th ed. Hoboken: Wiley; 2009.
4. Dault MC, de Haart M, Geurts ACH, Arts IMP, Nienhuis B. Effects of visual center of pressure feedback on postural control in young and elderly healthy adults and in stroke patients. Hum Mov Sci. 2003;22:221–36.
5. Zijlstra A, Mancini M, Chiari L, Zijlstra W. Biofeedback for training balance and mobility tasks in older populations: a systematic review. J Neuroeng Rehabil. 2010;7:58.
6. Halicka Z, Lovotkova J, Buckova K, Hlavacka F. Effectiveness of different visual biofeedback signals for human balance improvement. Gait Posture. 2014;39:410–4.
7. Geiger RA, Allen JB, O’Keefe J, Hicks RR. Balance and mobility following stroke: effects of physical therapy interventions with and without biofeedback/forceplate training. Phys Ther. 2001;81:995–1005.
8. Freitas SMSF, Duarte M. Joint coordination in young and older adults during quiet stance: effect of visual feedback of the center of pressure. Gait Posture. 2012;35:83–7.
9. Kilby MC, Slobounov SM, Newell KM. Augmented feedback of COM and COP modulates the regulation of quiet human standing relative to the stability boundary. Gait Posture. 2016;47:18–23.
10. Lakhani B, Mansfield A. Visual feedback of the centre of gravity to optimize standing balance. Gait Posture. 2015;41:499–503.
11. Corriveau H, Hebert R, Prince F, Raiche M. Postural control in the elderly: an analysis of test-retest and interrater reliability of the COP-COM variable. Arch Phys Med Rehab. 2001;82:80–5.
12. Masani K, Vette AH, Kouzaki M, Kanehisa H, Tukunaga T, Popovic MR. Larger center of pressure minus center of gravity in the elderly induces larger body acceleration during quiet standing. Neurosci Lett. 2007;422:202–6. 13. Yu E, Abe M, Masani K, Kawashima N, Eto F, Haga N, Nakazawa K. Evaluation
of postural control in quiet standing using center of mass acceleration: comparison among the young, the elderly, and people with stroke. Arch Phs Med Rehabil. 2008;89:1133–9.
14. Mani H, Hsiao SF, Takeda K, Hasegawa N, Tozuka M, Tsuda A, Ohashi T, Suwahara T, Ito K, Asaka T. Age-related changes in distance from center of mass to center of pressure during one-leg standing. J Mot Behav. 2015;47:282–90.
15. Ibuki A, Mani H, Takeda K, Hasegawa N, Yamamoto K, Maejima H, Asaka T: Characteristic relationship between the centre of pressure and the centre of mass during quiet standing in female ballet dancers. Int Phys Med Rehab J 2017; DOI: 10.15406/ipmrj.2017.01.00009
16. Cawsey RP, Cha R, Carpenter MG, Sanderson DJ. To what extent can increasing the magnification of visual feedback of the centre of pressure position change the control of quiet standing balance? Gait Posture. 2009;29:280–4.
17. Okuni I, Uchi M, Harada T. Sagittal-plane spinal curvature and center of foot pressure in healthy young adults. J Med Soc Toho Univ. 2006;53:254–60. 18. Raymakers JA, Samson MM, Verhaar HJ. The assessment of body sway and
the choice of the stability parameter(s). Gait Posture. 2005;21:48–58. 19. van Dieen JH, Koppes LL, Twisk JW. Postural sway parameters in seated
balancing; their reliability and relationship with balancing performance. Gait Posture. 2010;31:42–6.
20. Chang H, Krebs DE. Dynamic balance control in elders: gait initiation assessment as a screening tool. Arch Phs Med Rehabil. 1999;80:490–4. 21. Jian Y, Winter DA, Ishac MG, Gilchrist L. Trajectory of the body COG and
COP during initiation and termination of gait. Gait Posture. 1993;1:9–22. 22. Horak FB, MacPherson JM. Postural orientation and equilibrium. In: Rowell
LB, Shepherd JT, editors. Handbook of physiology, section 12, exercise: regulation and Integration of Multiple Systems. New York: Oxford University Press; 1996. p. 255–92.
23. Carpenter MG, Murnaghan CD, Inglis JT. Shifting the balance: evidence of an exploratory role for postural sway. Neuroscience. 2010;171:196–204. 24. Murnaghan CD, Horslen BC, Inglis JT, Carpenter MG. Exploratory
behaviour during stance persists with visual feedback. Neuroscience. 2011;195:54–9.