Application of Data Mining Technology Based on
Wireless Sensor Networks in Oceanographic Forecasting
https://doi.org/10.3991/ijoe.v14i04.8392
Wei Zhai
Xi'an Aeronautical University, Xi'an, China
Abstract—This paper aims to present a desirable prediction method for oceanographic trends. Therefore, an online monitoring scheme was prepared to collect the accurate oceanographic hydrological data based on wireless sensor network (WSN) and computer technology. Then, the data collected by the WSN were processed by support vector regression algorithm. To obtain the most im-portant parameters of the algorithm, the particle swarm optimization was intro-duced to search for the global optimal solution through the coopetition between the particles. After that, an oceanographic hydrological data collection and ob-servation system was created based on the hydrological situation of New York harbour. Then, the traditional support vector regression and the proposed meth-od were applied to predict the oceanographic trends based on water tempera-ture, salinity and other indices. The results show that the proposed algorithm enhanced the data utilization rate of the WSN, and achieved good prediction ac-curacy. The research provides important insights into the application of ad-vanced technology in oceanographic forecast.
Keywords—Oceanographic forecast, Wireless sensor network (WSN), Data mining, Support vector regression.
1
Introduction
Since its nascence in the late 1990s, the wireless sensor network (WSN) has devel-oped into a collaborative network capable of collecting and processing object infor-mation and transmitting the processed inforinfor-mation to users. The WSN usually con-sists of several sensors in ad hoc mode. Over the years, the network has been applied to various fields, such as environmental monitoring, traffic management, risk moni-toring, wildlife tracking, and security monitoring [1-2].
have been developed based on the WSN in foreign countries, namely, the EmNet of Heliosware (US) and the Fleck system of CSIRO (Australia) [5-6]. In China, scholars have also explored the WSN-based real-time monitoring systems for water resources [7].
Through the above analysis, it is not surprising that the WSN has also been intro-duced to the monitoring of oceanographic hydrological data. These data have long been the focal point in theoretical and empirical research. For instance, Wooley et al. employed data mining, classification and clustering techniques to process oceano-graphic hydrological data [8]. Guo et al. extracted and visualized the features of oceanographic hydrological data, and relied on them to detect the flow and vortex in the ocean [9]. Hun proposed a method to capture association results in remote sensing images, and created a phylogenetic tree structure of oceanographic hydrological data. To predict typhoons, Liu et al. analysed the typhoon images with various data mining techniques (e.g. principal component analysis, case-based learning, and similarity-based image retrieval) [11].
To sum up, many advanced data processing methods are yet to be applied to the management and utilization of oceanographic hydrological data. Therefore, this paper prepares an online monitoring scheme that can effectively collect oceanographic hy-drological data based on the WSN and computer technology. Then, the data collected by the WSN were processed by support vector regression algorithm. To obtain the most important parameters of the algorithm, the particle swarm optimization was introduced to search for the global optimal solution through the coopetition between the particles. After that, an oceanographic hydrological data collection and observa-tion system was created based on the hydrological situaobserva-tion of New York harbour. Then, the traditional support vector regression and the proposed method were applied to predict the oceanographic trends based on water temperature, salinity and other indices. The results show that the proposed algorithm enhanced the data utilization rate of the WSN, and achieved good prediction accuracy.
2
Wireless sensor networks for marine hydrology
2.1 Basic concept
The sensor node is at the forefront of data acquisition. It is responsible for the col-lection of environmental parameters, and then transmits the information to the user. Its structure is shown in Figure 1.
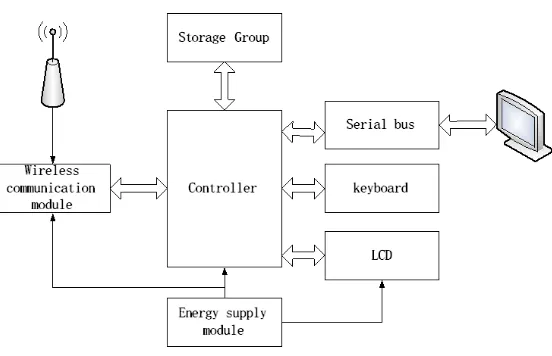
The sensor unit collects the characteristic signal of the object which is to be detect-ed. In general, each sensor unit contains a variety of sensors, and they work simulta-neously. The microcontroller is the control core of the sensor node, which is responsi-ble for the control of data collection and transmission, and the communication with the sink node. The sink node is the control center of the system, which is mainly composed of a wireless communication module, microcontroller, power supply mod-ule, keyboard and liquid-crystal display (LCD). The structure of the system is shown in Figure 2.
Fig. 1. Architecture of sensor node system
The sink node controls the data acquisition of wireless sensor nodes through the wireless communication module. Then, the collected data are transmitted to the host computer through the serial data bus, and a friendly monitoring interface is provided on the host computer. It forms the core part of the marine hydrological monitoring and analysis system.
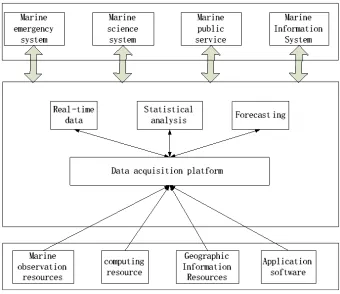
2.2 Real-time monitoring and analysis system for marine hydrology
The ultimate purpose of ocean observation is to understand the current situation of marine law, and even predict the future of the marine situation. This requires more precise data. A data quality control platform has been generated for this demand, and it plays a very important role in the real-time data management system of marine hydrological observation. The improvement of data quality is the basis of other work. If the data quality is not high, even if there are better models and methods, our predic-tions are inaccurate. The data quality control platform is scalable and can be imple-mented by adding new data quality control methods. Figure 3 is a real-time data man-agement system for marine hydrology.
3
Particle swarm optimization SVM algorithm
We start out by introducing the principle and improvements of particle swarm op-timization (PSO). There is a sample set: T=(xi, yi), 1, 2, L, n. Among them, xi is the ith input value in the n-dimensional sample set, and yi is the ith output value. Based on the support vector machine SVM learning process, it can be interpreted as the solution f(•) between the input and output. For any T=(xi, yi), 1, 2, L, n, it enables f(xi)=yi to be set up. Generally, f(•) can be expressed as:
( )
i i( )
f x
=
!"
x b
+
(1)In formula (1), ! is the weight, and b is called the threshold. The function of
!! !!! ! is to map the low dimensional input vector to the high dimensional feature space. In order to improve the prediction accuracy of the water level near the port, to obtain the appropriate parameters, and to minimize the structural risk, we can con-struct the empirical risk function as shown in formula (2):
1 1 m i R L = =
!
(2)Among them, L is called the loss function, and its expression is:
0 ( )
( )
( ) ( )
i i
i i i i
y f x
L y f x y f x
!
!
!
" # <
$
• = % # < # &
$' (3)
Where " is greater than 0. When learning samples are small, it is not appropriate to use empirical values to replace the actual risk value, so the support vector machine algorithm considers the generalization risk which is called the SRM criterion. Then, according to the SRM criteria, the selected nonlinear regression function is:
1
( ) sgn(m i i( ) ) i
f x
! "
x b=
=
#
+(4)
According to the principle of maximum interval of the SVM, the nonlinear regres-sion problem can be transformed into the following functional programming problem:
2 *
1 1
min + ( )
2
m i i i
C
!
" "
=
+
#
(5)
s.t . * * ( ) ( ) 0 0
i i i
i i i
i
i y f x f x y
! " ! " " " # $ + %
& # > +
&
' (
& & (
) (6)
In the above formula, the parameters !! and !!! are relaxation variables, and C is generally called the capacity factor. In general, formula (6) is transformed into the Lagrange dual problem to be solved:
*
( )
(
i i) ( , )
if x
=
#
! !
"
K x x b
+
(7)Among them, ai is a Lagrange multiplier, and K(•) is called a kernel function which satisfies the following formula:
( , )i j ( )i ( )j
K x x =
!
x •!
x (8)In this paper, the Gaussian kernel function is taken as the kernel function of SVM. That is:
2
( , ) exp( )
2
i i
x x K x x
!
"
=
(9)
In this paper, an improved PSO algorithm is adopted in the training process. The PSO algorithm is used to search for the global optimal solution through the coopera-tion and competicoopera-tion among the particles. Each particle represents a possible solucoopera-tion vector. For SVM training, it is possible to make the current position of the particle the current value of the parameter vector:
( , , )
x C
=
! "
(10)Then, the optimal position obtained by the optimization process is the optimal so-lution of the elements in the vector, that is, the optimal parameters of the correspond-ing SVM. The basic principle of the improved PSO can be expressed as:
1
1 1 2 2
1 1
( ) ( )
k k k k
i i pbest id gbest i
k k k
i i i
v v c r x x c r x x x x v
!
+
+ +
" = + # + #
$ %
= +
$& (11)
In formula (11), !!!!!vik+1is the current particle speed, !!!!! is the current position of the particle, r is a random constant, c is the learning factor, and
!
is the inertia weight. The function is as follows:max min max max k k
!
!
! !
= " "In formula (12), !!"# is considered to be the initial weight, !!"# is considered to be the final weight, k is expressed as the current number of iterations, and !!"# is the maximum number of iterations.
Next, we will introduce the methods and steps of using PSO to optimize the penal-ty parameter and kernel function parameter in the SVM algorithm.
4
Simulation experiment and result analysis
4.1 Preparation of data and description of correlation factors
Firstly, a set of WSN nodes are set up in the New York port and the upper reaches of the river and estuary, so as to construct an observation and prediction system for the harbor's oceanographic hydrological environment. The system combines the fixed point data collection, data fitting, and the prediction model of this paper to achieve the purpose of using hydrological indicators to predict the water level near the port.
Secondly, we give the water level diagram of New York Harbor near Red Hook at 0:00 local time on October 1, 2016 in Figure 4. As can be seen from Figure 4, the water level outside the port of the city is relatively low, while the water level inside the port is relatively high. The real-time control of the water level is a very meaning-ful thing, as it is conducive to enhancing the safety level near the port.
Thirdly, we illustrate the hydrological indicators of the marine environment. The real-time hydrological element data of the marine environment observation mainly include the temperature, salinity, and density of seawater, waves, currents and sea ice, water color, transparency, etc.
1. The water temperature is one of the basic physical factors of the ocean, and many marine phenomena and even the Earth's phenomena are related to the temperature of the seawater. The sea surface temperature depends on solar radiation, therefore, the seawater temperature is high in low latitudes, and low in high latitudes.
2. The seawater salinity is another important physical factor in the ocean. In addition to the salinity of various seas not being the same, the vertical distribution of the sa-linity is also different. The surface sasa-linity is low in cold sea areas, and the sasa-linity of seawater increases with depth.
3. All factors that affect the temperature and salinity of seawater will affect the densi-ty of seawater. The distribution of densidensi-ty of seawater is complex, and it varies with geographical location, the depth of the sea, and the time. There is a certain re-lationship between the density of seawater and temperature, and between the densi-ty of seawater and salinidensi-ty. It follows the law that the higher the salinidensi-ty, the higher the density, and the higher the temperature, the smaller the density.
To sum up, the salinity, atmospheric temperature, and sea surface temperature are chosen as sample data sets, and then they are put into the improved SVM prediction model which is established in this paper.
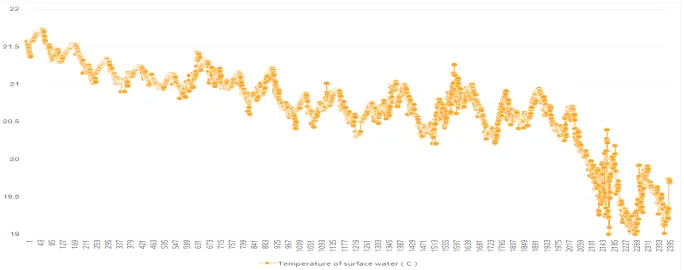
Finally, according to the WSN which is established in this paper, we can collect ocean hydrological data of the city port from October 1 to October 31, 2016. The data set is collected every four minutes by the WSN, and it contains a total of 2,400 data. Then, we use the data as a sample data set, and the specific situation is shown in Fig-ures 5, 6, 7.
Fig. 6. Salinity of water in New York Harbor near Red Hook
Fig. 7. Atmospheric surface temperature in New York Harbor near Red Hook
4.2 Experiment steps and result analysis
This paper uses the data of New York port from October 1 to October 10, 2016 as the sample data set. Then we use the SVM algorithm and the improved PSO optimiza-tion SVM algorithm proposed in this paper to predict the water level near the port in the next one day. Next, we will introduce the steps of the experiment, the experi-mental results, and the comparison of the experiexperi-mental results.
The improved PSO optimization SVM algorithm is used for classification and pre-diction.
The initial learning factor c1: The initial value is 2, which is used to control the lo-cal search ability of the PSO parameter;
The initial learning factor c2: The initial value is 2, which is used to control the global search ability of the PSO parameter;
The maxgen: The initial value is 100, which is used to control the maximum num-ber of evolutions;
The sizepop: The inietial value is 20, which is used to control the maximum num-ber of population;
K: The initial value is 0.6, which is used to control the relationship between speed and x;
Inertia weightw: The initial value is 1, !!"# is 0.8, and the !!"# is 1.2, which is the elastic coefficient in the velocity update formula;
The penalty parameter Cmax: The initial value is 100, which is used to control the maximum value of the SVM parameter C;
The penalty parameter Cmin: The initial value is 0.1, which is used to control the minimum value of the SVM parameter C;
The Gamma parameter gmax: The initial value is 100, which is used to control the maximum value of the SVM parameter g;
The Gamma parameter gmin: The initial value is 0.01, which is used to control the minimum value of the SVM parameter g;
The experimental results of the two methods are shown in Figure 8.
Figure 8 shows the results of the prediction of the New York Harbor's water level near Red Hook by the two different methods, as well as the results of the comparison between the calculated values and the observed values. From the 240 nodes, we can clearly see that the prediction error of this method is the smallest. In addition, it shows that the use of data is good and bad, not only related to the WSN, but also closely related to data mining technology.
5
Conclusions
In this paper, we present an online monitoring scheme by using WSN technology and computer technology, so as to collect hydrological data effectively. Moreover, this paper uses the method of support vector regression to process the data collected by the wireless sensor. Also, in order to obtain the most important parameters of the support vector regression algorithm, this paper uses the PSO algorithm to search for the global optimal solution through the cooperation and competition between the particles in the population. In the simulation experiment, a collection and observation system of New York Harbor is constructed based on the hydrological situation near the harbor. We use the traditional support vector regression method and the improved method to achieve our goal, namely, to use water temperature, salinity, and tempera-ture to predict changes in the water levels. The experimental results show that the proposed algorithm can improve the data utilization rate of WSNs and has good pre-diction accuracy.
6
References
[1]Ren, F.Y., Huang H.N., Lin C. (2003). Wireless Sensor Networks, Journal of software, 14(7), 1282-1291.
[2]Mainwaring, A., Polastre J., Szewczyk R. (2003). Wireless sensor networks for habitat monitoring, ACM International Workshop on Wireless Sensor Networks and Applications, 88-97.
[3]Jiang, P., Kong, Y.F. (2008). Design of wireless sensor network data video base station for water environment monitoring, Chinese Journal of sensor technology, 21(9), 1580-1585. [4]Du, X.M., Chen, Y. (2008). Research status and application of wireless sensor networks,
Journal of Beijing Technology and Business University (Natural Science Edition), 2008, 26(1), 41-44.
[5]EmNet.LLC.Technology[EB/OL].http://www.heliosware.com/technology.html, 2008-01-16.
[6]The CSIRO ICT Centre. Wireless Sensor Network Devices [EB/OL]. http://www.ict.csiro.au/page.phpcid=87,2008-01-16.
[7]Jiang, P., Huang, Q., Wang, J., Dai, X., Lin, R. (2006). Research on wireless sensor net-works routing protocol for water environment monitoring in wetlands, International Con-ference on Innovative, Computing, Information and Control, 251-254.
[8]Wooley, B., Bridges, S., Hodges, J., Skjellum, A. (2000). Scaling the Data Mining Step in Knowledge Discovery Using Oceanographic Data, IEA/AIE, 85-92.
[9]Guo, D., Evangelinos, C., Patrikalakis, N. (2004). Flow Feature Extraction in Oceano-graphic Visualization, Computer Graphics International, 162-173.
[10]Hun, C.X. (2002). Research progress of Marine Geographic Information System (MGIS), Marine geology letters, 18(1), 23-30.
7
Author
Wei Zhai is Xi'an Aeronautical University of China, Xi'an 710077, China, she is manly engaged in the research of electronics and communication.