Theorising Fuzzy Set Analysis
a Complementary Approach to Net-effect Models
Ernest F. Mabonesho1 1
The Institute of Finance Management – Tanzania
Correspondence: Ernest F. Mabonesho, The Institute of Finance Management – Tanzania
Received: February 17, 2018 Accepted: March 21, 2018 Online Published: April 2, 2018
doi:10.5430/afr.v7n2p183 URL: https://doi.org/10.5430/afr.v7n2p183
Abstract
Net-effect models assume that independent variables have a standalone impact on depended variables! As such the focus of net effect models is to examine the relationship between independent variables (causals) and dependent variables (outcome). I argue that this is not always true, independent variables may synergistically work together to bring impacts on a dependent variable, this allows researchers to examine if the independent variables are necessary or sufficient for an outcome of interest (dependent variable) to occur. This paper adopted a descriptive approach, I reviewed the literature on set-theoretic approach to understand how fuzzy set analysis can be viewed as a complementary approach to net-effect models in accounting and finance research. I note that Fuzzy set analysis has qualities that allow researchers to examine the necessity and sufficiency of independent variables to impacting dependent variables, this allows research to complement relationship studies with necessity and sufficiency studies. In addition, I note that the fuzzy set analysis allows researchers to identify core and supporting conditions for influencing an outcome of interest, this can complement examination of variables which have significant impact in the outcome of interest. In these contexts, I conclude that fuzzy set analysis complements examination of relationships and correlations between independent and dependent variables through examination of necessary and sufficient condition for an outcome of interest. This paper acknowledges that, although the proposed approach may lead to improved quality of the findings, the approach may suffer from subjectivity problems, especially when establishing the three benchmarks for scaling the original variables to fuzzy sets. It is suggested that substantial knowledge of the variables is highly required when determining the three benchmarks.
Keywords: fuzzy set analysis, complementary approach, net effect models
1. Introduction
This is a descriptive paper proposing for fuzzy set analysis (FSA) to be viewed as a complementary method to net-effect approaches. Critically the literature has been reviewed to appreciate the contribution of set-theoretic approach to complementing the weaknesses of regression analysis and other net-effect models.
The set-theoretic approach was primarily introduced in social science studies by Ragin, (1987) as a research method for understanding fundamental problems of complex causality that were overlooked in conventional net-effect models. Set-theoretic approach view cases (Note 1) as made up of different arrangements of variables. For example, a business firm is made up of many variables like assets (firm size), equity and liabilities (capital structure), asset tangibility and many other variables. These variables are used to differentiate firms due to differences in levels of memberships in these variables, firms which have more assets are relatively larger than others, this means, they have high memberships in large firm size “set” than others. Similarly, firms which have a large amount of debt in their capital structure, appear to have high memberships in high-leveraged firms. In net-effect modules if there is a significant positive relationship between firm size and profitability, this may be interpreted that as the firm increases in size the profit will also increase! This interpretation, however, may not tell us as to whether the large firm size is a necessary or sufficient condition for creating more profit. Furthermore, the results do not tell us as to whether firm size will bring similar impact in firms with different capital structure, different tangibility (asset structure) and different diversification levels.
variables) rarely operate in isolation/standalone from one another, but are more interdependence when influencing an outcome of interest. Third, a specific causal attribute may have different or even opposite effects on the outcome of interest depending on a context; this is an indicator of asymmetric causality (Note 2). These premises are hardly addressed using net-effect (linear) models, but a configuration approach (FSA) can (Fiss, 2011).
2. The Fuzzy Sets
Fuzzy sets are extensions of classical sets (Boolean or “crisp” sets) by allowing for degree of membership (Zadeh, 1965; Ragin, 2000; Ragin and Pennings, 2005; Fiss, 2011). The basic idea of fuzzy sets is to scale the original measures into membership scores that range between 0 and 1, as shown in Figure 1. Fuzzy sets are like continuous variables that have been intentionally calibrated to show the degree of membership in a specified set (variable) ranging between 0 and 1 (Ragin and Pennings, 2005). In fact, transformation of original variables to fuzzy sets is like scaling the variables to smaller and more manageable figures. Scaling variables to small figures is common practice in accounting and finance areas of research for example; normally firm size is scaled using natural logarithms of total sales or total sales. This implies that the process of calibrating original variables to fuzzy sets does not change the ranking, but does increase the quality of analysis by including the idea of memberships which is not easily determined using original measures (Fiss, 2011). Indeed, Ragin, (2000; 2008) asserts that calibrated variables are superior to uncalibrated measures because uncalibrated measures only show the position of one variable in relation to another while a fuzzy set value shows position in relation to another variable and the degree of a variable in relation to itself (Fiss, 2011).
2.1 Overview of Set Theoretic Approach
FSA uses configurations as units of analysis and fuzzy set values are used to assign degree of the memberships of cases in different variables (sets). Therefore, variables are measured to reflect memberships of cases in a set (Ragin, 2000). Basing on the qualities of FSA, researchers can do research to determine necessary and sufficient conditions for an outcome of interest instead of significant relationships between causes and outcome of interest especially when the causes are highly interactive.
Generally, firms are understood by examining configurations of their characteristics (differences and similarities) that influence an outcome of interest (Ragin, 2000). Ragin (2000) contends that differences and similarities of firms (cases) can be determined using memberships in their basic elements/attributes. These memberships are referred to as fuzzy sets (Ragin, 2000). Ragin, (1987), shows that for categorical variables, a case can either hold full membership or non-full membership, and he used 1 and 0 to denote the memberships respectively. For example, a person can be categorized as having full membership (1) or not-full membership (0) in a set of male persons. The dichotomisation of 1 and 0 is only important for categorical variables but not for continuous variables. In continuous variables, cases have gradual memberships ranging from full no membership (0) to full memberships (1). Consider, for example, we want to understand the level of firms’ business diversifications, we may note that there are firms which are highly diversified, moderately diversified or not diversified (focused firms). Table 1 and Figure 1 demonstrates gradual membership of seven firms which were taken from Mabonesho, (2013). These gradual memberships are defined as fuzzy sets (Ragin, 2000).
Table 1. Firms’ Memberships in a Set of Business Diversification
Company Name
Business Diversification
Memberships
Entropy Fuzzy sets Type
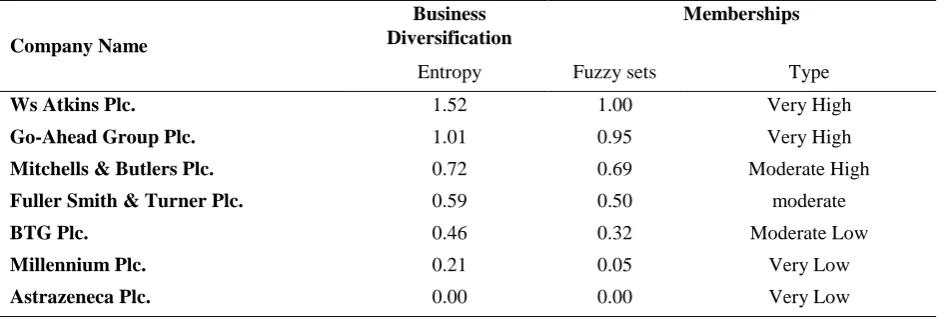
Ws Atkins Plc. 1.52 1.00 Very High
Go-Ahead Group Plc. 1.01 0.95 Very High
Mitchells & Butlers Plc. 0.72 0.69 Moderate High
Fuller Smith & Turner Plc. 0.59 0.50 moderate
BTG Plc. 0.46 0.32 Moderate Low
Millennium Plc. 0.21 0.05 Very Low
Table 1 indicates firms’ degree of business diversification using entropy index and their corresponding set theoretic memberships as indicated by fuzzy sets. Detail on how the Fuzzy set values were calculated is discussed later in this paper.
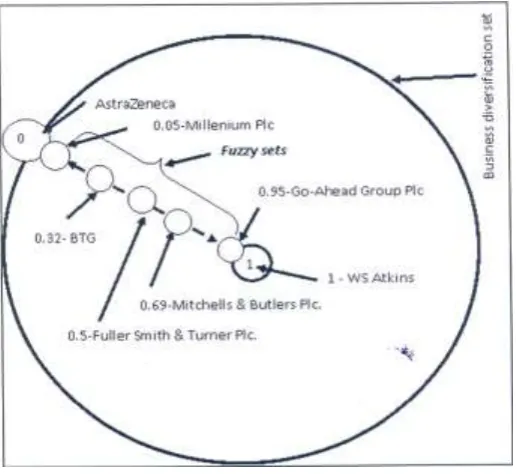
Figure 1. Illustration of Fuzzy Sets – Business Diversification Set.
Figure 1 is a Venn diagram (the set) that shows firms’ memberships in a set of high business diversified firms. The circles in a set represent the positions (memberships) of the respective firms in that set, whilst circles closer to the centre indicate higher memberships than those towards the edge of the set.
Basing on Figure 1, it appears that WS Atkins is the most diversified firm as it has full membership (1) in highly diversified firms which is equal to 1.52 and 1 entropy and fuzzy set measures respectively, followed by a Go-Ahead Group PLC, which has 0.95 memberships (1.01 entropy measure of diversification) and Millenium PLC and has AstraZeneca PLC have 0 and 0.05 memberships respectively this implies that the firms are not diversified as they have low memberships in highly diversified firms.
Since it is believed that diversification reduces business risks, then basing on net-effect module, one can argue that AstraZeneca PLC and Millenium PLC have the highest business risks! However, the question is what if the firms have different levels of size and capital structure, would the impact of diversification on business risk remaining the same? If the answer is yes, then standalone effect models do not need a complementary approach, but if the answer is no, then a complementary approach is required to understand when diversification is necessary for business risk reduction!
2.2 Key Features of Fuzzy Set Analysis Vs Regression Module
The key features of the FSA are: First, while conventional statistical approaches use linear and additive assumptions of causality that leads to unifinality and symmetric causality, FSA assumes “variable” interdependency and complex causality that leads to equifinality and asymmetric causality (Ragin, 2006; 2008; Fiss, 2007; 2011) (Note 3)
Second, most statistical research concentrates on quantitative measures of independent and dependent variables, while FSA requires the transformation of raw variable measures to fuzzy set values in order to allow for both inductive and deductive reasoning to apply at the same time (Ragin, 2000), and assign cases with set memberships across different sets. FSA uses sets in place of variables as used in traditional statistical approaches.
Forth, truth table is an important feature of FSA. It is the primary source of outputs for analysis. A truth table is a table that lists all possible configurations (Note 5) of causal conditions that might be associated with an outcome of interest (Ragin, 2000; 2008; Fiss, 2007; 2011; Crilly, 2011; Skaaning, 2011). The number of possible configurations depends on the number of causal variables involved in the study. The number of configurations is usually calculated as 2k where k stands for the number of causal variables used. If there are seven (7) causal variables, the truth table will display 128 (27) possible configurations. Since the theoretical number of configurations increases with the number of variables, it can be hard to provide meaningful analysis when the variables are many (Ragin, 2000; Fiss, 2007). In this context, the number of possible configurations can be reduced through the application of frequency and consistency cut-offs (Von Eye, 1990; Ragin, 2000). Frequency refers to the number of cases that share the same configurations while consistency refers to the percentage of cases sharing the same configurations that consistently display the outcome of interest. Higher frequency and consistency implies better results. Von Eye, (1990), suggested that the frequency of a certain configuration can be considered important for analysis if it is significantly greater than one divided by a total of possible configurations times the total cases involved in the analysis. The consistency cut-off according to fsQCA 2.0 software is 80%, which is usually used by many researchers (see for example Fiss, 2011). However, this usually depends on the number of cases involved in the analysis.
Fifth, multiple solutions, one of the key feature of FSA is multiple solutions of a truth table. The truth table usually provides three types of solutions: complex, parsimonious, and intermediate solutions. And, within these solutions there can be many different configurations leading to similar results. A complex solution is detail, and it is not based on theory, but on logical possible combinations of the causes, and does not use any counterfactual analysis, in this context this solution is less useful to research (Fiss, 2007). A parsimonious solution permits the use of easy and difficult counterfactuals; therefore, it has the least element in the configurations. The role of parsimonious solution is to identify core conditions in an intermediate solution. The intermediate solution is the solution obtained from the easy counterfactual analysis. It provides theoretical links between elements of a configuration and between configurations and the outcome. This is the most useful solution, and it is used for result presentation and analysis. Therefore, parsimonious and intermediate solutions are important, and they can be used to deal with limited diversity problems (Fiss, 2007; 2011) (Note 6). Limited diversity occurs when the observed logically possible combinations of causal conditions do not empirically exist (Ragin, 1987; 2000; Fiss, 2007; 2011). Similar to Thomson and Bebbington, (2004, p. 614) limited diversity can also be referred to as “limited situations” which means “those things that oppress different” users of financial information in obtaining information to use as sufficient indicators of favourable financial performance. Thomson and Bebbington, (2004), noted that the best method of addressing a limited situation in teaching accounting is to design a holistic program that takes into account “the complexity of interacting forces which exist at a point in time” (p. 614). In addition, it has been noted that accounting “should be viewed as a heuristic learning device” (Georgakopoulos and Thomson, 2005, p. 73).
Sixth, Core and Supporting Conditions, Fiss, (2011) define core conditions as conditions which are essential for an outcome to occur while supporting conditions are those that are less essential and “perhaps even expendable or exchangeable” in the configuration leading to an outcome of interest (p. 394). During the presentation of FSA results, core and supporting conditions are usually differentiated using size of dots (Fiss, 2011): large dots represent core conditions, and small dots represent supporting conditions.
Seventh, Consistency and Coverage, FSA use consistency and coverage in place of significance tests and R-Square of conventional statistical models respectively (Ragin, 2006; Fiss, 2011). Ragin, (2006, p. 291) noted that consistency is used to assess “the degree to which a subset relationship has been approximated” and coverage is used to assess “the empirical relevance of a consistency subset”. The concepts of consistency and coverage are based on the idea that a specific configuration constitutes one of several possible configurations (paths) to an outcome. Based on this idea, a fuzzy set-theoretic consistency is usually determined when causal conditions consistently appear to be a subset of the outcome, this means fuzzy set-theoretic consistency exists when the membership scores of causal conditions are consistently less or equal to their membership scores in the outcome.
Consistency is calculated using the following formula
Given that an outcome of interest may be achieved through several alternative configurations (Ragin, 2006), then logically, every configuration covers a certain proportion in the outcome. This proportion is usually referred to as set-theoretic coverage. Coverage is like R2 in regression models as it measures the empirical importance of a configuration in the outcome. High coverage implies that the configuration is important and low coverage means that the configuration is less important for an outcome to occur (Fiss, 2011). Coverage is therefore defined as the degree to which a “cause or causal combination accounts for instances of an outcome” (Ragin, 2008, p. 45).
Since there are many configurations to the same outcome, it is possible that the coverage of the configurations in the outcome may overlap. This implies that there is coverage that is unique to a particular configuration (unique coverage) and overlapped coverage that is coverage shared by other configurations (raw coverage). The coverage of all configurations together referred to as solution coverage (Ragin, 2006). Here is the formula for calculating coverage.
𝑪𝒐𝒗𝒆𝒓𝒂𝒈𝒆 (𝑿𝒊 ≤ 𝒀𝒊) = ∑(𝐦𝐢𝐧 (𝑿𝒊,𝒀𝒊)
∑(𝒀𝒊) (2)
Where: Xi represents membership scores in a combination of causal conditions, Yi represents membership scores in an outcome of interest, and min (Xi, Yi) indicates the lower of Xi and Yi. Note that the difference between coverage and consistency formula is the denominator. ∑Xi is used in consistency formula; ∑Yi is used in coverage formula
Consistency and coverage are usually presented in the truth table where every configuration indicates coverage and consistency which are important for “understanding reliability and importance” of different configurations for an outcome of interest (Ragin, 2006, p. 292; Fiss, 2011, p. 403). Furthermore, consistency and coverage are used to assess whether the configurations are necessary or sufficient for an outcome to occur.
2.3 Calibration of Original Variables to Fuzzy Sets
The calibration process refers to a process of transforming conventional (raw) variables to fuzzy set values. It is argued that the original variables need to be transformed to fuzzy set values in order to allow the assignment of firms into meaningful and objective set memberships (Ragin, 2000; 2008; Ragin and Pennings, 2005; Verkuilen, 2005; Greckhamer et al, 2008; Fiss, 2011; Campbel et al., 2016 ). Thus, in order to establish objective sets, it is necessary to calibrate the original variables in conformity with an “external standard” basing on three benchmarks (Ragin, 2008, p. 16). The three benchmarks (qualitative thresholds) for the calibration process are: full membership (fuzzy set value 0.95), cross over point (fuzzy set value 0.50), and full no membership (fuzzy set value 0.05). These benchmarks need to be objectively determined through theoretical and substantive understanding of the cases (Ragin, 2000; 2008). This means that the original variables are calibrated to fuzzy sets using external criteria depending on the researchers’ “conceptualization, definition, and labelling of the variables in question” (Ragin, 2008, p.85). The calibration process requires the identification of original variable values that matches the three qualitative thresholds, then the determined values are entered in fsQCA 2.0 software which calibrates the variables using the direct method or indirect method (Ragin, 2000; 2008; Fiss, 2011). Whichever method is used, the decision to assign the degree of membership in a set “should be based entirely on researchers’ substantive and theoretical knowledge” (Ibid). However, as noted in Greckhamer et al., (2008). In order to enhance objectivity, it is advised to use the existing literature to determine the benchmarks (Greckhamer et al., 2008, Fiss, 2011; Mabonesho, 2013 and Campbel et al., 2016).
2.4 Necessary and Sufficient Conditions
FSA examines necessary and sufficient conditions rather that relationships. According to Ragin, (2000, p. 203; 2008, p. 42), a causal condition or a configuration is considered necessary if it must be present for an outcome to occur, whilst, a cause is defined as sufficient if, by itself, it can produce an outcome. A condition is considered both necessary and sufficient if it is the only cause that produces the outcome in its singular form and not in combination with other causes (Ragin, 2000, p. 203). A causal condition is considered neither necessary nor sufficient if it only appears in a subset of the configurations that produce a certain outcome. A condition is considered necessary but not sufficient if it appears in all possible combinations capable of producing an outcome. Finally, a causal condition is sufficient but not necessary if capable of producing the outcome, but is not the only cause with this capacity. According to Ragin (2000; 2008), the existence of necessity and sufficiency depends on the theories that propose the cause-effect relationship.
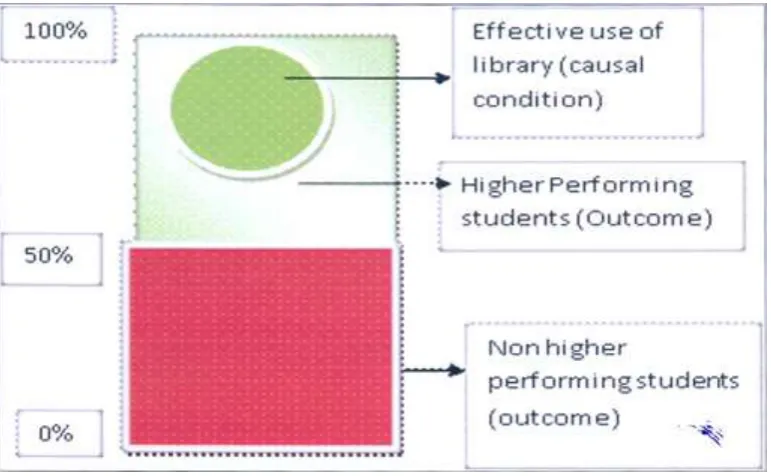
To make sense of definition of the necessary and sufficient condition, let us consider the following hypothetical example, we want to know whether attending library is a necessary or sufficient condition for passing exams. Figure 2 shows that all students who effectively used the library scored above the pass mark (assuming the pass mark is 50%) and therefore passed the exam. This indicates that when students effectively use the library they must pass the exams. However, it appears also that students who did not attend library had passed their exams, some passed with higher marks than those who effectively used the library as indicated in Figure 2. This implies that the effective use of the library is a sufficient condition to pass the exams, but it is not a necessary condition because, some of the students who are not library goers passed the examination as well. This implies that attending library is not the only factor for passing examinations.
Figure 2. Illustration of “necessary and sufficient” condition
It appears that there are many factors that may enable a student to pass the examinations, for example: cheating during the exams, high level of intelligence quotient (IQ), readiness to do the exams, better lecturers, and class/lecture attendances. It may not be surprising that these factors are interdependent and they only function as a configuration for producing better examination results (i.e., conjunctural causality), and that different configurations/combinations of these factors lead to better results (i.e., equifinality). Perhaps those students who effectively used the library also attended classes, or had good and competent lecturers, or cheated to pass the examinations. This indicates that there are other supporting conditions that combine with the core condition (library attendance) to sufficiently enable better examination results to occur. Thus, a combination of these factors is important for examining sufficient paths to better examination results. Therefore, it is not surprising to see that, attending library and ignoring the other factors may not lead to better results.
Based on the subset-superset relationships presented in the hypothetical examples above, the conclusion is drawn that a condition is necessary for an outcome to occur if an outcome is a subset of the causal condition. But when the causal condition appears to be a subset of the outcome, then a cause is sufficient for an outcome to occur (Ragin, 2000). According to Ragin, when fuzzy set scores of an outcome are consistently less than or equal to those of the causes, researchers can use this as evidence of necessity, but when fuzzy set scores of the causes are consistently less than or equal to those of an outcome, then researchers can use this as evidence of sufficiency.
3. Fitting Fuzzy Set Analysis into Accounting and Finance Research
Most of the common variables in accounting and finance research are highly interactive and they support one another for an outcome of interest to occur (Ragin, 2000; Fiss, 2011). For example, business and geographic diversification have been seen to complement one another in impacting financial performance (Hitt et al., 1997; Davies et al., 2001; Singh et al., 2003; Matraves and Rodriguez, 2005; Malone and Rose, 2006). Furthermore, researchers have confirmed that the impact of business diversification on financial performance depends on other firm characteristics like level of leverage (Li and Li, 1996), internal funds (Myers, 1977; Myers and Majluf, 1984; Jones and Danbolt., 2005); asset structure, and firm size, (Morck and Yeung, 1997). In addition, Singh et al., (2003), observed that financing choice of companies depends on asset structures, firm size, and diversification levels. This literature implies that firm’s attributes my do not always influence results of interest in isolations but sometimes in combination. Some of the attributes may appear core other supporting, but also some causal variables may appear necessary and or sufficient for an outcome of interest to occur. The core/supportive and necessary conditions for an outcome of interest to occur cannot be identified using net-effect models but fuzzy set can do.
Thus, it is high time to employ fuzzy set analysis to complement regression models in accounting and finance research areas. The application of fuzzy set analysis to deal with complex causality has started gaining acceptance by researchers in different fields such as political science (Schneider and Wageman, 2003), international business (Pajunen, 2008; Crilly, 2011), management science (Bozbura et al., 2007; Greckhamer et al., 2008; Fiss, 2011), corporate governance (Garcia-Castrol et al., 2013), mergers and acquisition (Campbell et al., 2016) and in accounting and finance (Kwak et al., 2003; Kwak et al., 2010, Wang and Lee, 2010; Mabonesho, 2013). For example, Kwak, et al, (2010), adopted a fuzzy set approaches to solve accounting and finance problems associated with international transfer pricing, human resource allocation in CPA firms, accounting information system allocations, and capital budgeting in different settings, and concluded that FSA is suitable for handing complex causality in accounting and finance problems.
Currently, researchers interested in organizational performance are also applying FSA to explore configurations for favourable financial performance (Pajunen, 2008; Greckhamer et al., 2008; Fiss, 2011; Garcia-Castrol et al., 2013; Campbell et al., 2016). Pajunen, (2008), employed FSA to address the problem of complex causality and diversity of institutional factors in multinational firms on influencing foreign direct investment (FDI) across 47 host countries for the period of five years (1999-2003). Specifically, Pajunen examined how and why countries with different memberships in institutional factors attract or do not attract FDI. The result shows that similar institutions experience different levels of FDI due to geographical categorization. Also, Pajunen noted that the presence or absence of a single institutional factor may lead to an increase or decrease of FDI attraction. Finally, it was found that there were several possible configurations to FDI attraction which can be captured through applications of FSA. In this context, Pajunen concluded that FSA offers greater opportunity for future researchers to explore configurations that sufficiently lead to the outcome of interest.
Greckhamer et al., (2008), examined the potential for interdependence and complexity of industry, corporate, and business-unit factors for determining favourable performance of business-unit by applying configuration approaches. They concluded that configuration approaches such as fuzzy sets analysis and crisp set analysis are ideal approaches for studying “sufficiency of combination of industry, corporate, and business-unit attributes for occurrence of superior and inferior business-unit performance” (p.696). They showed that there are interdependences among factors and that “corporate factors are important to understanding performance” (p.717), such that “any particular attribute may have different and even opposite effects depending on the presence or absence of other attributes” (p.720). In addition, their results indicated that different combinations of industry, corporate, and business-unit attributes may lead to similar performance of business-units. The key idea of Greckhamer and others was to understand whether the three (industry, corporate, and business-unit) attributes were likely to form a configuration that is sufficient to indicate favourable financial performance in business-units.
elements in a configuration are core while others are supporting. Furthermore, Fiss, (2011) observed that conditions in the configurations that lead “to very high performance are frequently different from those leading to merely high or average performance” (p.411). This is evidence of the existence of asymmetric causality (Ragin, 2008), which has been neglected in a linear relationship (net effect) models. Fiss, (2011), concluded that FSA provides better explanations on how causal conditions combine to create an outcome. FSA is a particularly useful tool for understanding both complement and substitute causal variables in the configurations. Furthermore, FSA is an appropriate method for understanding complex cause-effect relationship and variable interactions. As such, Fiss concluded that FSA can complement other standard approaches like cluster analysis, deviation score, and statistical analysis.
Garcia-Castrol, Aguilera, & Arino., (2013) intended to explore bundles of firm-level corporate governance practices (Board dependence, board information disclosure, remuneration disclosure, compensation, and employee royalty) to identify combination that would lead to high financial performance (ROE). They found that there are multiple bundles of firm-level governance practices leading to high ROE, this implies the presence of equifinality. Also, they observed that there are complementarities (interdependencies) among firm-level corporate governance attributes, this indicates the presence of conjuncture (complex) causality and asymmetric causality which are hard to be addressed through net-effect models, but FSA can complement this net-effect models’ weakness.
Recently, Campbell et al., (2016) addressed the issues on how market participants react to factors related to mergers and acquisition using fuzzy set analysis. They found that investors perceive and evaluate M&A not only holistically (that is, as a configuration) but also characterized by equifinality and asymmetric causality. These important findings cannot find a room in net-effect oriented studies, but FSA can do.
The literature above implies that the idea of “one size fit all” does not always exist in studies that use accounting and finance information. The weakness of net-effect models can be completed by configuration approaches.
4. Limitations of FSA Applications
Although, I am confident that FSA can examine complex relationships when causal variables are highly interractive and therefore complement regression analysis (Ragin, 2000; 2008; Fiss, 2011), some researchers do not agree as to whether configuration approaches provide improvements on net-effect approaches. For example, Seawright, (2005) argued that assumptions of causality and complex relationship proposed in configuration approaches; do not hold in the case of missing variables. Thus, Seawright noted that in the case of missing variables, configuration approaches are weaker than regression analysis. In this context, Seawright concluded that a configuration approach “is not an improvement over regression analysis” (p.25). I argue that Seawright was correct, because, the FSA is not intended to improve the net-effect, but to complement by taking into account the ignored facts from assumptions of regression analysis. For example, in regression models, independent variable with a zero measure contributes nothing in the outcome of interest. This may not always be correct because the absence of causal variable may lead to an outcome of interest to occur. For example, firms that have no debt in their capital structure are likely to have lower business risk and therefore can lead to higher value. Indeed Smithson, (2005), noted that the FSA and statistical methods can produce better results if they are used together.
5. Summary and Conclusion of the Chapter
References
Campbell, J. T., Sirmon, D. G., & Schijven, M. (2016), Fuzzy Logic and The Market: A Configurational Approach to Investor Perceptions of Acquisition and Announcements. Academy of Management Journal, 59(1), 163-187. https://doi.org/10.5465/amj.2013.0663
Crilly, D. (2011). Predicting Orientation in the Multinational Enterprise: A Mid-Range Theory. Journal of international Business, 42, 694-717. https://doi.org/10.1057/jibs.2010.57
Davies, S. W., Rondi, L., & Sembenelli, A. (2001). Are multinationality and diversification complementary or substitute strategies? An empirical analysis on European leading firms. International Journal of Industrial Organization, 19, 1315–1346. https://doi.org/10.1016/S0167-7187(00)00063-1
Fiss, P. C. (2007). A Set-Theoretic Approach to Organizational configulations. Academic Management Review, 32, 1180-1198. https://doi.org/ 10.5465/AMR.2007.26586092
Fiss, P. C. (2011). Building Better Causal Theories: A Fuzzy Set Approach to Typologies in Organization Research. Academy of Management Journal, 54(2), 393–420. https://doi.org/10.5465/AMJ.2011.60263120
García-Castro, R., Aguilera, R. V., Ariño, M, A. (2013). Bundles of Firm Corporate Governance Practices: A Fuzzy Set Analysis. Corporate Governance: An International Review, 21(4), 390–407. https://doi.org/10.1111/corg.12024
Georgakopoulos, G., and Thomson, I. (2005). Organic Salmon Farming: Risk Perceptions, Decision Heuristics and the Absence of Environmental Accounting. Accounting Forum, 29, 49-75. https://doi.org/10.1016/j.accfor.2004.12.002
Greckhamer, T., Misangyi, V. F., Elms, H., & Lacey, R. (2008). Using Qualitative Comparative Analysis in Strategic Management Research: An Examination of Combinations of Industry, Corporate, and Business-Unit Effects . Organizational Research Methods, 11(4), 695-726. https://doi.org/10.1177/1094428107302907
Hitt, M. A., Hoskisson, R. E., & Kim, H. (1997). International Diversification: Effects on Innovation and Firm Performance in Product Diversified Firms. Academy of Management Journal, 40, 767-798. https://doi.org/10.2307/256948
Jones, A. E. & Danbolt, J. (2005). Empirical Evidence on the Determinants of the Stock Market Reaction to Product and Market Diversification Announcements. Applied Financial Economics, 15(9), 623-629. https://doi.org/10.1080/09603100500065461
Kart, A., Hau, M. V., & Mahoney, J. (2005). Explaining the Great Reversal in Spanish America: Fuzzy Set Analysis Versus Regression Analysis. Sociological Methods & Research, 33(4), 539-573. https://doi.org/10.1177/0049124104266002
Kosko, B. (1994). Fuzzy Thinking: The New Science of Fuzzy Logic. London: Flamingo – Harper Collins publisher.
Kwak, W., Shi, Y., & Lee, C. F. (2010). The Fuzzy set and Data Mining Applications in Accounting and Finance. In C. F. Lee, Handbook of Quantitative Finance and Risk management (pp. 1307-1331). springer Science and Business media.
Kwak, W., Shi, Y., & Jung, K. (2003). Human Resource Allocation in a CPA Firm: A Fuzzy Set Approach. Review of Quantitative Finance and Accounting, 20, 277-290.
Li, D., and Li, S. (1996). A Theory of Corporate Scope and Financial Structure. Journal of Finance, 51, 691-709. https://doi.org/10.2307/2329376
Mabonesho, E. (2013). Diversification, Financial Performance, and the Destruction of Corporate Value? An Application of Fuzzy Set Analysis, Unpublished PhD thesis
Malone, C. B., & Rose, L. C. (2006). Intangible Assets and Firm Diversification. International Journal of Managerial Finance, 2(2), 136-153. https://doi.org/10.1108/17439130610657359
Matraves, C., & Rodriguez, P. (2005). Profitability, Diversification, and Multinationality in Leading German and UK Firms. International Journal of Business and Economics, 4(2), 87-105.
Miles, R. E., & Snow, C. C. . (1978). Organizational Strategy, Structure, and Process. New York: McGraw Hill.
Morck, R., & Yeung, B. (1997). Why investors Sometimes Value Size and Diversification The Internalization Theory on Synergy. Working Paper, Institute of Financial Research, University of Albata.
Myers, S. (1977). Determinants of Corporate Borrowing. Journal of Financial Economics, 5, 147-175. https://doi.org/10.1016/0304-405x(77)90015-0
Myers, S. & Majluf, N. (1984). Corporate Financing and Investment Decisions When Firms Have Informantiion that Investors Do not Have. Journal of Financial Economics, 13, 187-221. https://doi.org/10.3386/w1396
Pajunen, K. (2008). Institutions and inflows of foreign direct investment: a fuzzy-set analysis. Journal of International Business Studies, 39, 652–669. https://doi.org/10.1057/palgrave.jibs.8400371
Ragin, C. (1987). The Comparative method: Moving Beyond Qualitaive and Quantitative Strategies. Berkeley: University of California Press.
Ragin, C. C. (2000). Fuzzy-Set Social Science. Chicago: University of Chicago Press.
Ragin, C. C. (2006). Set Relations in Social Research: Evaluating Their Consistency and Coverage. Political Analysis, 14(3), 291-310. https://doi.org/10.1093/pan/mpj019
Ragin, C. C. (2008). Redesigning Social Inquiry: Fizzy Sets and Beyond,. Chicago,: University of chicago Press.
Ragin, C. C. (2008). User's Guide to Fuzzy-Set/Qualitative Comperative Analysis based on fsQCA 2.0 Software. University of Arisona.
Ragin, C. C., & Fiss, P. (2008). Net-Effect Versus Configurations An Emperical Demonstration. In C. C. Ragin, Redesigning Social Inquiry: Fuzzy Sets and Beyond (pp. 190-212). Chicago: University of Chicago.
Ragin, C. C., Drass, K, A., & Davey, S. (2003). Fuzzy-set/qualitative comparative analysis, version 2.0. www.u.arizona.edu/;cragin/fsQCA/download/Setup_fsQCA.exe.
Ragin, C. C., Drass, K. A., & Savey, S. . (2006). Fuzzy-Set/Qualitative Comparative Analysis 2.0. Tucson, Arizona: Department of Sociology, University of Arizona.
Ragin, C. C., & Pennings, P. (2005). Fuzzy Sets and Social Research. Sociological Methods & Research, 33(4), 423-430.
Rihoux, B., & Ragin, C. C. (2009). Configurational Comparative Analysis Methods: Qualitative Comparative Analysis (QCA) and Related Techniques. USA: Sage Publications, Inc.
Schneider, C. Q., & Wageman, C. (2003). Improving Infrerence With a Two-Step Approach Theory and limited Diversity in FS/QCA. San Domenico: Badia Fiesolana.
Seawright, J. (2005). Qualitative Comparative Analysis Vis-a-vis Regression . Studies in Comparative International Development, 40, 2-26. https://doi.org/10.1007/bf02686284
Singh, M., Davidson III, W. A., & Suchard, J. (2003). Corporate Diversification Strategies and Capital Structures. Quaterly Review of Economics and Finance, 43, 147-167.
Skaaning, E. S. (2011). Assessing the Robustness of Crisp-set and Fuzzy-set QCA Results. Sociological Methods & Research, 40, 391-408. https://doi.org/10.1177/0049124111404818
Smithson, M. (2005). Fuzzy Set Inclusion : Linking Fuzzy Set Methods With Mainstream Techniques. Sociological Methods & Research, 33, 431-461. https://doi.org/10.1177/0049124105274497
Thomson, I., and Bebbington, J. (2004). It Doesn’t Matter What you Teach? Critical Perspectives on Accounting, 15, 609-628. https://doi.org/10.1016/s1045-2354(03)00049-2
Verkuilen, J. (2005). Assigning Membership in a Fuzzy Set Analysis. Sociological Methods & Research, 33(4), 462-496. https://doi.org/10.1177/0049124105274498
Von Eye, A. (1990). Introduction to Configural Frequency Analysis: The Search for Types and Anttypes in Cross-Classifications. New York: Cambridge University Press.
Wang, S. Y., and Lee, C. F. (2010). Application of Fuzzy Set Theory to Finance Research: Method and Application. In C. F. Lee, Hand Book of Quantitative Finance and Risk Management (pp. 1183-1199). New York: Springer.
Notes
Note 1. The term case is referred to anything such as firm/company from which variables are determined. A case is basically seen as a combination of different variables that are defined as firm attributes.
Note 2. Asymmetric causality occurs when causes that lead to an outcome of interest are quite different from those that lead to absence of outcome. In asymmetric causality if presence of A causes presence of B, absence of A may not necessarily lead to absence of B, as it may also lead to presence of B. While in symmetric causality is that if condition A causes outcome B, then absence of A causes absence of B
Note 3. According to Fiss; (2007; 2011), equifinality occurs when different configurations from different causal conditions lead to the same outcome, while unifinality refers to a situation whereby different causal conditions can lead to different outcomes.
Note 4. See section 2.5 for definition of necessary and sufficient conditions
Note 5. Configurations refers to different combinations of causes for an outcome of interest or different paths to an outcome of interest.