Sensitivity to Secondhand Smoke Exposure Predicts
Future Smoking Susceptibility
WHAT’S KNOWN ON THIS SUBJECT: Passive exposure to cigarette smoke in children is toxic and associated with
susceptibility to cigarette smoking. In turn, smoking susceptibility predicts smoking initiation. These relationships suggest that exposure to cigarette smoke in childhood contributes to risk for future cigarette smoking.
WHAT THIS STUDY ADDS: Sensitivity to exposure to cigarette smoke may be a mechanism that helps explain the relationship between passive exposure and smoking susceptibility. Tobacco-naive preteens who report cigarette smoke as “unpleasant or gross” have substantially reduced susceptibility to smoking.
abstract
OBJECTIVE:Susceptibility to cigarette smoking in tobacco-naive youth is a strong predictor of smoking initiation. Identifying mechanisms that contribute to smoking susceptibility provide information about early targets for smoking prevention. This study investigated whether sen-sitivity to secondhand smoke exposure (SHSe) contributes to smoking susceptibility.
PARTICIPANTS AND METHODS:Subjects were high-risk, ethnically di-verse 8- to 13-year-old subjects who never smoked and who lived with at least 1 smoker and who participated in a longitudinal SHSe reduc-tion intervenreduc-tion trial. Reacreduc-tions (eg, feeling dizzy) to SHSe were as-sessed at baseline, and smoking susceptibility was asas-sessed at base-line and 3 follow-up measurements over 12 months. We examined the SHSe reaction factor structure, association with demographic charac-teristics, and prediction of longitudinal smoking susceptibility status.
RESULTS:Factor analysis identified “physically unpleasant” and “pleasant” reaction factors. Reported SHSe reactions did not differ across gender or family smoking history. More black preteens re-ported feeling relaxed and calm, and fewer rere-ported feeling a head rush or buzz compared with non-Hispanic white and Hispanic white counterparts. Longitudinally, 8.5% of subjects tracked along the trajec-tory for high (versus low) smoking susceptibility. Reporting SHSe as “unpleasant or gross” predicted a 78% reduction in the probability of being assigned to the high–smoking susceptibility trajectory (odds ratio: 0.22 [95% confidence interval: 0.05– 0.95]), after cova-riate adjustment.
CONCLUSIONS:Assessment of SHSe sensitivity is a novel approach to the study of cigarette initiation etiology and informs prevention inter-ventions.Pediatrics2011;128:254–262
AUTHORS:Christina N. Lessov-Schlaggar, PhD,aDennis R.
Wahlgren, MA,bSandy Liles, MPH,bMing Ji, PhD,c
Suzanne C. Hughes, PhD, MPH,bJonathan P. Winickoff, MD,
MPH,dJennifer A. Jones, MPH,bGary E. Swan, PhD,eand
Melbourne F. Hovell, PhD, MPHb
aDepartment of Psychiatry, Washington University School of
Medicine, St. Louis, Missouri;bCenter for Behavioral Epidemiology and Community Health andcDivision of Epidemiology and Biostatistics, Graduate School of Public Health, San Diego State University, San Diego, California; dMassachusetts General Hospital for Children, Harvard Medical
School, Boston, Massachusetts; andeCenter for Health Sciences, SRI International, Menlo Park, California
KEY WORDS
secondhand smoke, sensitivity, smoking susceptibility, trajectories, preteens
ABBREVIATION
SHSe—secondhand smoke exposure
Dr Lessov-Schlaggar conducted all analyses and wrote the article, Mr Wahlgren, Ms Jones, and Drs Hughes and Hovell designed and conducted the study; Mr Wahlgren served as the measurement coordinator for the overall trial, designed the study measures, and oversaw data collection; Mr Liles conducted poststudy data management and consulted on study design and statistical issues; Dr Ji consulted on analytical approaches; Drs Winickoff and Swan consulted on the scientific direction and approach; and Dr Hovell supervised all aspects of the study, analyses, and manuscript preparation. All coauthors provided extensive, critical edits and feedback throughout the writing process.
www.pediatrics.org/cgi/doi/10.1542/peds.2010-3156
doi:10.1542/peds.2010-3156
Accepted for publication May 4, 2011
Address correspondence to Christina N. Lessov-Schlaggar, PhD, Washington University School of Medicine, Department of Psychiatry, 660 S Euclid, Campus Box 8134, St Louis, MO 63110. E-mail: [email protected]
PEDIATRICS (ISSN Numbers: Print, 0031-4005; Online, 1098-4275).
Copyright © 2011 by the American Academy of Pediatrics
FINANCIAL DISCLOSURE:The authors have indicated they have no personal financial relationships relevant to this article to disclose.
Childhood secondhand smoke expo-sure (SHSe) is associated with adverse
health consequences1–5 and contrib-utes to medical problems into adult-hood.6–10 It also is associated with smoking susceptibility,11,12which is an independent predictor of smoking ini-tiation.13–15 SHSe is associated with symptoms of addiction in children who had never smoked16and with
progres-sion to weekly smoking in adulthood,17 independent of family and peer smok-ing. One mechanism that could ac-count for the relationship between SHSe and smoking behavior is genet-ics, because children who live with parents who smoke likely have an in-herited predisposition to smoking.18–21
A second mechanism is individual dif-ferences in sensitivity to SHSe,22which could be influenced by genetic predis-position to smoking, genetic predispo-sition in sensitivity to SHSe,23,24by cu-mulative SHSe, by existing medical conditions, or a combination of these
and other factors. A third mechanism is access to cigarettes and the model-ing of smokmodel-ing behavior to which ex-posed children are subject. Social re-actions to the child’s early imitations of their parents’ smoking may strongly influence smoking initiation.
We posited that individual differences in sensitivity to SHSe may represent markers for vulnerability to smoking behavior. Studies have shown that sub-jective reactions (eg, relaxed, dizzy) to
first-time smoking are related to esca-lation in smoking behavior and nico-tine dependence.25–27
We previously reported the assess-ment of sensitivity to SHSe, presented
psychometric findings of SHSe sensi-tivity, and predicted smoking suscepti-bility in cross-sectional analyses.28The current investigation extends our pre-vious findings by examining sensitivity to SHSe and smoking susceptibility longitudinally.
MATERIALS AND METHODS
All procedures were approved by the San Diego State University institutional review board.
Participants
Low-income families were recruited throughout San Diego County, Califor-nia, with a total of 18 673 recruitment contacts made over 3 years. A total of 1836 interested families were con-tacted by telephone between 2004 and 2007, identifying 618 potential families on the basis of child age (8 –13 years) and resident smoker status; 388 fami-lies qualified for an in-home baseline interview. Parents signed informed consent and preteens signed assents. Of 388 families, 211 families were eligi-ble for the randomized clinical trial if reported SHSe in the home was 2 or more cigarettes per day or if the pre-teen’s urine cotinine level (a bio-marker of SHSe) was 2.0 ng/mL or higher. Of these, 9 families refused to continue, 1 family was lost, and 201 families were randomly assigned to ei-ther the intervention or control and were followed at 5, 9, and 12 months.
Analysis in this study was limited to the longitudinal subsample of 201 pre-teens (1 from each family) who had never smoked at baseline and throughout the 12-month follow-up (n⫽182) and who had smoking sus-ceptibility data on at least 2 of 4 as-sessments (n⫽165).
Assessments
Sequential interviews were completed with the parent and preteen sepa-rately. The preteen interview included demographics; general health infor-mation; tobacco-use history; peer smoking behavior; SHSe in the home, school, church, and neighborhood; SHSe reactions; rules about smoking in the home; parenting and home envi-ronment; alcohol use; and popular-culture items. The parent interview
in-cluded race/ethnicity information and detailed family smoking history. Urine was collected from the preteen at baseline and follow-up measures.
Variables
Reactions to SHSe
Assessment of SHSe sensitivity was adapted from measures used to as-sess sensitivity to the first smoked cig-arette.29,30Preteens were asked to re-spond “yes” or “no” to the questions “When you have breathed other peo-ple’s smoke, did you ever feel any of the following?”: (1) “Did you feel dizzy?”; (2) “Did you feel like you wanted to throw-up?”; (3) “Did you think it was unpleas-ant or gross?”; (4) “Did your heart beat faster?”; (5) “Did you feel relaxed or calm?”; (6) “Did you feel a rush or buzz in your head?”; (7) “Did you think it was nice or pleasant?”; (8) “Did you like the smell?”; and (9) “Did you start cough-ing or chokcough-ing?” SHSe sensitivity was assessed at the baseline interview only.
Smoking Susceptibility
To be classified as nonsusceptible, subjects who never smoked had to re-spond with “definitely not” to the fol-lowing: “Do you think you will try a cig-arette soon?”, “Do you think you will be smoking one year from now?”, and “If one of your best friends were to offer you a cigarette, would you smoke it?” Otherwise, preteens were classified as susceptible.31Never smoking was de-fined as answering “no” to both “Have you ever smoked a cigarette?” and “Have you ever tried cigarette smok-ing, even a few puffs?” Smoking sus-ceptibility was assessed at baseline and at each follow-up interview.
Covariates
race/ethnicity, categorized as non-Hispanic white, non-Hispanic white, black, combined Native American, Asian, and Pacific Islander, and mixed. Nonwhite groups included both Hispanics and non-Hispanics; (4) parent education, categorized as less than high school, high school, and more than high school; (5) family smoking index, de-fined as the proportion of first- and second-degree relatives who ever smoked regularly relative to the total number of relatives (an expanded ex-planation can be found in ref 28 or re-quested from Dr Lessov-Schlaggar)33,34; (6) school grades in the past year (mostly As and Bs versus all others); (7) any friends who smoke (yes or no); (8) urine cotinine level (log transformed; analytic chemistry of urine cotinine has been described28,35); and (9) mem-bership in the experimental or control arms of the study.
Data Analysis
Factor analysis was used to investi-gate the pattern of correlations among SHSe reactions and to examine whether reactions cluster into “pleas-ant” and “unpleas“pleas-ant” dimensions. Factor analysis with promax rotation (allowing for correlated factors) was performed using SAS software version 9.1.36The choice of the final factor so-lution was based on (1) the common variance accounted for by each factor, (2) the scree plot, (3) at least 2 items with factor loadings 0.3 or higher, and (4) items with high loadings (ⱖ0.3) on 1 factor had to have lower loadings on all remaining factors.37
Association of SHSe reactions and de-mographic characteristics was inves-tigated in a series of regressions by using Stata 9,38where the dependent variable was either each reaction (lo-gistic regression) or a 3-category sum-mary score (ordinal logistic regres-sion). Pairwise comparisons between categories of the independent
vari-ables were computed using the Wald 2test. For the ordinal regression, the proportional odds assumption was tested using the Brant test. The as-sumption was not violated in any of the models.
Smoking susceptibility trajectories were estimated using a semipara-metric, multinomial-mixture model-ing approach that identifies the opti-mal number of trajectory growth curves in the population.34,39–41 The most parsimonious Bayesian informa-tion criterion42was used for model se-lection. Model building proceeded us-ing the general recommendation to add trajectory classes as long as the Bayesian information criterion contin-ued to decrease and the model was meaningful.41
Trajectory models were fit to the val-ues of the dichotomous smoking sus-ceptibility variable across the 4 as-sessments using a logit model. Time since baseline was the independent variable. Baseline was indexed as 0, 5-month and 9-month follow-ups were indexed as 0.417 and 0.75 fractions of 1 year, and 1 represented the 1-year follow-up. Trajectory analyses were conducted on data from preteens who never smoked throughout and who had susceptibility data from at least 2 of 4 assessments (finaln⫽165). Association of SHSe reactions and sus-ceptibility trajectories was investi-gated by using logistic regression pre-dicting trajectory class assignment from baseline SHSe reaction items and summary scores. Trajectory class as-signment was based on computation of a posterior probability of preteen assignment to each trajectory class modeled. Thus, if 2 trajectories were modeled, each individual had 2 poste-rior probabilities of trajectory class assignment. A person was assigned to the trajectory for which they had the higher posterior probability.
RESULTS
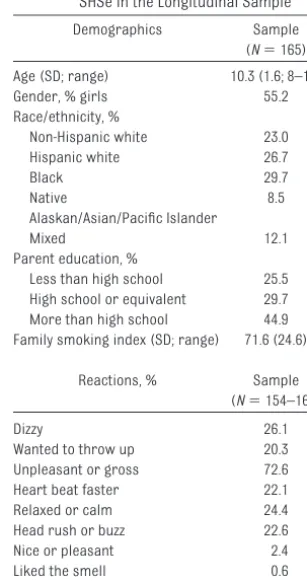
Demographics and prevalence of base-line SHSe reactions are shown in Table 1. Factor analysis of SHSe reactions re-sulted in 2 factors (Table 2). A total of 5 of 9 items had loadings of 0.30 or higher on the first “physical/unpleas-ant” factor. The item “unpleasant or gross” did not have a factor loading 0.30 or higher; however, it was in-cluded in the computation of the factor 1 summary score because it had a suf-ficiently high loading in the factor anal-ysis for the full sample (factor loading: 0.31) and was significantly related to smoking susceptibility.28 This 6-item factor had acceptable internal consis-tency (Cronbach␣⫽0.63). The factor accounted for 24.9% of the variance in these 6 items. None to all 6 of the “un-pleasant/physical reactions” were en-dorsed with a median of 2 and mean of 2.11 (SD: 1.57). To increase cell size for this quasicontinuous measure, a
dis-TABLE 1 Demographic Characteristics and Prevalence of Baseline Reactions to SHSe in the Longitudinal Sample
Demographics Sample
(N⫽165)
Age (SD; range) 10.3 (1.6; 8–13)
Gender, % girls 55.2
Race/ethnicity, %
Non-Hispanic white 23.0
Hispanic white 26.7
Black 29.7
Native 8.5
Alaskan/Asian/Pacific Islander
Mixed 12.1
Parent education, %
Less than high school 25.5 High school or equivalent 29.7 More than high school 44.9 Family smoking index (SD; range) 71.6 (24.6)
Reactions, % Sample
(N⫽154–165)
Dizzy 26.1
Wanted to throw up 20.3
Unpleasant or gross 72.6
Heart beat faster 22.1
Relaxed or calm 24.4
Head rush or buzz 22.6
Nice or pleasant 2.4
Liked the smell 0.6
crete variable was defined capturing roughly the lower one-third (scores 0 and 1 [39.9%]), median (score 2 [24.2%]), and upper one-third (score ⱖ3 [36.0%]) of the distribution (Table 2).
Feeling relaxed or calm and thinking that SHSe is nice or pleasant loaded on a second factor. The internal consis-tency of this “pleasant” factor was low (Cronbach␣⫽0.44), and it accounted for 21.7% of the variance in the 2 items. The summary score captured endorse-ment of neither of these 2 items (score: 0) or either or both of them (score: 1 or 2). Factors 1 and 2 were weakly correlated (r⫽0.10).
Associations of baseline SHSe reac-tions and summary scores with demo-graphic characteristics are shown in Table 3. Overall, more 8- to 9-year-old subjects, relative to older age-groups, reported wanting to throw up, feeling relaxed or calm, and coughing or chok-ing, and more endorsed 3 or more “physical/unpleasant” reactions and
any “pleasant” reactions. Relative to TABLE
3 Relationship of Baseline SHSe Reactions and Factor Score Categories With Baseline Demographic Characteristics in the Longitudinal Sample of Prete ens Who Never Smoked ( N ⫽ 165) Gender Age-Groups Race/Ethnicity Parent Education Male ( N ⫽ 67–74) Female ( N ⫽ 87–91) 8–9 y ( N ⫽ 52–53) 10–11 y ( N ⫽ 62–69) 12–13 y ( N ⫽ 40–43) Non-Hispanic White ( N ⫽ 37–38) Hispanic White ( N ⫽ 42–44) Black ( N ⫽ 44–49) Native Alaskan, Asian, or Pacific Islander ( N ⫽ 13–14) Mixed ( N ⫽ 18–20) Less Than High School ( N ⫽ 40–42) High School or
Equivalent (N
⫽ 49) More Than High School ( N ⫽ 65–74) Reactions, % endorsed Dizzy 24.3 27.5 35.9 23.2 18.6 26.3 29.6 22.5 28.6 25.0 28.6 30.6 21.6 Wanted to throw up 18.9 21.4 32.7 1 14.7 2 14.0 2 21.6 25.0 14.6 21.4 20.0 31.0 1 20.4 13.9 2 Unpleasant or gross 68.9 75.6 69.8 72.1 76.7 76.3 70.5 72.9 78.6 65.0 71.4 69.4 75.3 Heart beat faster 22.4 21.8 28.9 19.4 17.5 24.3 14.3 20.5 30.8 33.3 25.0 24.5 18.5 Relaxed or calm 28.8 20.9 34.6 1 21.7 16.3 2 13.2 1 14.0 1 40.8 2 21.4 30.0 29.3 22.5 23.0 Rush or buzz in head 24.3 21.1 28.3 20.6 18.6 31.6 1 29.6 1 8.3 2 21.4 25.0 28.6 22.5 19.2 Nice or pleasant 2.7 2.2 7.6 0.0 0.0 0.0 0.0 4.1 7.1 5.0 0.0 2.0 4.1 Liked smell 1.4 0.0 1.9 0.0 0.0 0.0 0.0 2.0 0.0 0.0 0.0 2.0 0.0 Coughing or choking 54.1 48.9 62.3 1 48.5 41.9 2 62.2 43.2 51.0 57.1 45.0 46.3 53.1 52.7 Factor score categories, n 67–73 86–91 51–52 62–69 40–43 36 42 44 13 18 40 49 64 F1 low (score 0 or 1), % 41.7 38.3 27.5 46.8 45.0 36.1 42.9 38.6 30.8 50.0 30.0 38.8 46.9 F1 medium (score 2), % 16.4 30.2 23.5 21.0 30.0 19.4 19.1 36.4 38.5 5.6 25.0 24.5 23.4 F1 high (score ⱖ 3), % 41.8 31.4 49.0 1 32.3 2 25.0 2 44.4 38.1 25.0 30.8 44.4 45.0 36.7 28.7 F2 low (score 0), % 71.2 79.1 65.4 78.3 83.7 86.8 86.1 59.2 78.6 70.0 70.7 77.5 77.0 F2 high (score 1 or 2), % 28.8 20.9 34.6 1 21.7 16.3 2 13.2 1 13.9 1 40.8 2 21.4 30.0 29.3 22.5 23.0 Different sample sizes are a result of a different number of missing values across SHSe reactions. Factor scores have a lower sample size in some cases c ompared with individual items because if an individual has missing data for just 1 of the items that are summed across to create the factor score, that individual will be dropped from the total factor score. Prevalence estimates with different su perscripts are significantly different from each other at P ⬍ .05. F1 indicates factor 1 (unpleasant factor); F2, factor 2 (pleasant factor). Mixed respondents are those who endorsed 2 or more racial/ethnic categories.
TABLE 2 Factor Analysis of Baseline Reactions to SHSe in the Longitudinal Sample
Reactions Factor
Loadings
F1 F2
Dizzy 0.52 ⫺0.02
Wanted to throw up 0.64 0.05 Unpleasant or gross 0.27a 0.06
Heart beat faster 0.46 0.08
Relaxed or calm ⫺0.03 0.53
Head rush or buzz 0.61 ⫺0.1
Nice or pleasant 0.25 0.39
Liked the smell ⫺0.08 0.11
Coughing or choking 0.40 ⫺0.21
Cronbach␣ 0.64 0.44
Interfactor correlation 0.10 Summary score categories, %
F1 low (score 0 or 1)a 39.9 F1 medium (score 2) 24.2 F1 high (scoreⱖ3) 36.0
F2 low (score 0) 75.6
F2 high (score 1 or 2) 24.4
F1 indicates factor 1 (unpleasant factor); F2, factor 2 (pleasant factor).
aThe unpleasant or gross item was included in the computation
of the F1 summary score because it loaded significantly in the
non-Hispanic white and Hispanic white preteens, significantly more black preteens reported feeling re-laxed or calm and any “pleasant” reactions, and significantly fewer re-ported a rush or buzz. More preteens with parents who had less than a
high school education reported wanting to throw up compared with preteens with more highly educated parents. There were no differences by gender or family smoking index (data not shown) across SHSe reac-tions or summary score categories.
The Bayesian information criterion
val-ues of models estimating 1, 2, and 3 trajectories were ⫺243.72, ⫺224.54, and ⫺228.90, respectively. The best-fitting susceptibility trajectory model
by Bayesian information criterion was the 2-class solution (Fig 1), character-ized by high (8.5%) and low (91.5%) sus-ceptibility trajectories. In
covariate-adjusted analyses, experiencing SHSe as “unpleasant or gross” predicted a 78% reduction in the probability of be-ing assigned to the high smokbe-ing
sus-ceptibility trajectory compared with the low smoking susceptibility trajec-tory (Table 4) (odds ratio: 0.22 [95% confidence interval: 0.05– 0.95]). There
was a trend for reduced risk for as-signment to the high susceptibility tra-jectory, given endorsement of 3 or
0 0.1 0.2 0.3 0.4 0.5 0.6 0.7 0.8
0 5 9 12
Susceptibility probability
Months of follow-up
Low, n = 151, 91.5%
High, n = 14, 8.5%
FIGURE 1
Smoking susceptibility trajectories in 8- to 13-year-old preteens who have never smoked.
TABLE 4 Relationship of SHSe Reactions and Summary Score Categories With Smoking Susceptibility Trajectories (Low Susceptibility Trajectory Is the Referent Category)
Reactions by Trajectory Group Association With Trajectories Covariates
Low (N⫽140–151) High (N⫽14) Unadjusted Odds Ratio (95% Confidence Interval)
Adjusted Odds Ratio (95% Confidence Interval)
Reactions, %
Dizzy 25.8 28.6 1.15 (0.34–3.87) 0.75 (0.16–3.45) Native Alaskan/Asian/Pacific
Islandera; School gradesb Wanted to throw up 20.1 21.4 1.08 (0.28–4.12) 0.63 (0.12–3.31) Native Alaskan/Asian/Pacific Islandera; School gradesb Unpleasant or gross 74.7 50.0 0.34 (0.11–1.03)a 0.22 (0.05–0.95)b Native Alaskan/Asian/Pacific Islandera; School gradesb Heart beat faster 22.1 21.4 0.96 (0.25–3.65) 0.79 (0.13–4.80) Native Alaskan/Asian/Pacific Islandera; School gradesb
Relaxed or calm 24.0 28.6 1.27 (0.37–4.28) 2.28 (0.43–12.0) Native Alaskan/Asian/Pacific
Islandera; School gradesb Head rush or buzz 23.3 14.3 0.55 (0.12–2.56) 0.28 (0.05–1.74) Native Alaskan/Asian/Pacific Islandera; School gradesb
Nice or pleasant 2.0 7.1 3.79 (0.37–39.1) 2.73 (0.09–80.5) Native Alaskan/Asian/Pacific
Islandera; School gradesb
Liked the smell 0.7 0.0 Native Alaskan/Asian/Pacific
Islandera; School gradesb Coughing or choking 52.7 35.7 0.50 (0.16–1.56) 0.34 (0.08–1.40) Native Alaskan/Asian/Pacific Islandera; School gradesb Summary score categories,n 139–150 14
F1 low (score 0 or 1), % 38.3 57.4 1.00 1.00
F1 medium (score 2), % 25.2 14.3 0.38 (0.08–1.89) 0.26 (0.04–1.83)
F1 high (scoreⱖ3), % 36.7 28.6 0.52 (0.15–1.83) 0.20 (0.03–1.14)a Native Alaskan/Asian/Pacific Islandera; School gradesb
F2 low (score 0), % 76.0 71.4 1.00 1.00
F2 high (score 1 or 2), % 24.0 28.6 1.27 (0.37–4.28) 2.28 (0.43–12.0) Native Alaskan/Asian/Pacific Islandera; School gradesb
Adjusted for age, gender, race, parent education, family smoking history, school grades, smoking friends, urine cotinine levels, and intervention group. F1 indicates factor 1 (unpleasant factor); F2, factor 2 (pleasant factor); NA, not applicable.
more “physical/unpleasant” SHSe re-actions. Approximately one-half of the preteens in each of the 2 trajectories had been assigned to the intervention arm of the SHSe reduction trial. As a consequence, group assignment to intervention or control was not sig-nificantly associated with trajectory class assignment. Preteens of Native American, Asian, or Pacific Islander background were more likely to be in the high susceptibility trajectory. Having grades of As and Bs in school was associated with a lower risk for assignment to the high susceptibility trajectory.
DISCUSSION
This longitudinal study, together with our previous cross-sectional analysis, investigated a research question that has not been previously addressed. In particular, we examined whether re-ported reactivity to exposure to SHS in high-risk preteens predicts suscepti-bility to cigarette smoking. Subjective reactivity to the first smoked cigarette has been shown to predict risk for to-bacco dependence26,43and to be have some genetic basis.23,24Both longitudi-nal and cross-sectiolongitudi-nal investigation showed that experiencing SHS as “un-pleasant or gross” is protective against smoking susceptibility, sug-gesting that it may reflect a mecha-nism for targeted prevention efforts. In this longitudinal study, reactions to SHSe seemed to capture “physical/un-pleasant” and ““physical/un-pleasant” dimensions, consistent with results for subjective reactions to the first cigarette.27 How-ever, in the full baseline sample, reac-tions like feeling relaxed or calm, thinking SHSe was nice or pleasant, or liking the smell did not load on a sec-ond “pleasant” factor,28 which might reflect little or no “positive reinforc-ing” reactions to SHSe, at least in the way that such reactions were as-sessed in this study.
There were differences in endorse-ment rates of some SHSe reactions by age, race/ethnicity, or parent educa-tion but no differences by gender or family smoking history. Results sug-gest decreasing sensitivity to both un-pleasant and un-pleasant reactions to SHSe as preteens get older. This de-creased sensitivity cannot be ex-plained by decreased SHSe because there was no significant relationship between urine cotinine levels (a bio-marker of exposure) and age (r ⫽
0.005). In addition, urine cotinine did not predict susceptibility trajectory as-signment (odds ratio: 1.15 [95% confi-dence interval: 0.76 –1.75];P⫽.498). It could be that the interpretation of SHSe reactions is different across age-groups. Because reactions to SHSe were asked in relation to lifetime expo-sure (“When you have breathed other people’s smoke, did youeverfeel any of the following?”) and not specifically to recent exposure, it is possible that older preteens forgot reactions to ex-posures when they were younger or are simply recalling their more recent experiences rather than their lifetime experiences. Lower endorsement rates could also reflect changes in social-reinforcement contingencies and adaptations to cigarette smoke, where contingencies lead to more ex-posure, and overexposure episode ad-aptation takes place where one no lon-ger reacts as negatively and/or downplays the negative effects of SHSe. It could also be that cumulative exposure is associated with decreas-ing sensitivity, perhaps through devel-opment of tolerance to SHSe over time. It is not possible to evaluate this possi-bility in this study, but because lifetime exposure would be difficult to assess, assessment of reported sensitivity to SHSe may be a practical alternative.
The prevalence of feeling relaxed or calm was 3 times higher in black pre-teens, and the prevalence of a head
rush or buzz was 3 and one-half times lower compared with non-Hispanic white and Hispanic white groups. Ap-proximately 75% of black smokers smoke mentholated cigarettes, com-pared with 23% to 30% of non-Hispanic white and white smokers.44,45It is pos-sible that black preteens are more commonly exposed to the smoke from mentholated cigarettes, compared with preteens of other racial/ethnic groups, and menthol-flavored smoke may be experienced as more pleasant (feeling more relaxed or calm and less of a head rush or buzz) compared with SHSe from nonmentholated cigarettes. There is evidence that cigarette smoke from mentholated cigarettes is associ-ated with sensations of coolness in the mouth and throat of smokers.46These results may have implications for Food and Drug Administration regulation of menthol cigarettes, which currently are exempt from regulation.47
Significantly more preteens with lower-educated parents reported wanting to throw up. It could be that preteens in such homes are exposed to greater amounts of SHS because lower educational achievement is as-sociated with higher rates of cigarette smoking.48–51 Baseline urine cotinine levels did not systematically differ across parent education levels, al-though cotinine levels were signifi-cantly lower in preteens whose par-ents had less than a high school education compared with those whose parents had a high school or equivalent education (P⫽.047), sug-gesting that SHSe at the time of as-sessment could not explain preva-lence differences.
and ethnic diversity, preteen smoking susceptibility was low overall. The mean age of preteens in the high (mean age: 10.2, SD: 2.2, and range: 8 –13) versus low (mean age: 10.3, SD: 1.6, and range: 8 –13) trajectories were the same, suggesting that those at high susceptibility risk were not simply older. Experiencing SHSe as “unpleasant or gross” was the only action that predicted a significant re-duction in risk for assignment to the high smoking susceptibility trajectory. In cross-sectional analyses,28this item showed a trend for a significant 40% reduction in smoking susceptibility risk. The combined results suggest that this reaction may be a marker for mechanisms that protect against smoking susceptibility. Among the co-variates, the strongest protective fac-tor for smoking susceptibility was hav-ing grades of As and Bs in school. This finding may have important implica-tions for future intervention strategies that focus on behavior change to en-courage good school performance by preteens along with providing strate-gies for limiting or eliminating SHSe.
The results from this study may not be generalizable to children younger than 8 or older than 13 years of age or to children at lower smoking risk, such as those who do not live with smokers. Assessment of SHSe reactions needs to be refined to include items that are specific to secondhand smoke rather
than reactions more related to the ex-perience of the first smoked ciga-rettes. The small portion of item vari-ance explained by the factor structure makes evident the need for refine-ment. Low endorsement rates of the “pleasant” reactions to SHSe pre-cluded identification of statistically significant associations between these items and smoking susceptibility. Larger samples would be needed to detect the effects of low prevalence measures. Longitudinal follow-up through the age period of risk for smoking initiation would be very im-portant and informative for under-standing how sensitivity to SHSe re-lates to smoking initiation.
CONCLUSIONS
This investigation, together with our previous cross-sectional analysis, sug-gest that (1) experiencing SHSe as “unpleasant or gross” may be a pheno-typic marker for mechanisms associ-ated with protection against smoking susceptibility; (2) identifying sub-groups of individuals with different smoking susceptibility profiles over time allows for better resolution of the relationship between SHSe reactions and smoking susceptibility; (3) even in this high-risk diverse sample of sub-jects aged 8 to 13 years who never smoked, smoking susceptibility was low, suggesting that this age range may represent an opportune window for targeted intervention to keep
sus-ceptibility low and to decrease smok-ing initiation risk; and (4) sensitivity to SHSe is a measure of importance in tobacco-use etiology, in terms of flag-ging early risk or protective factors for smoking susceptibility and, possibly, in turn, smoking initiation. This study provides empirical support for more expansive designs to determine the combination of factors that most reli-ably predict smoking susceptibility. In-cluding measures of early exposure to smoke and sensitivity to exposure in language competent children (eg, ages 3– 4 years) within the longitudinal Na-tional Children’s Study may enable val-idation of these measures in relation to future smoking risk. This analysis should be replicated with youth repre-sentative of the general population. If results are replicated, intervention studies should test prevention of to-bacco initiation with children who are “at risk of initiation” as well as those who are not to determine the utility of using the measures as bases for pre-vention programs.
ACKNOWLEDGMENTS
This work was supported by National Institutes of Health Grants HL066307 (to Dr Hovell), DA027046 (to Dr Lessov-Schlaggar), and DA018019 (to Dr Swan) and discretionary funds from the Center for Behavioral Epidemiol-ogy and Community Health (to Dr Hov-ell, director).
REFERENCES
1. California Environmental Protection Agency. Proposed Identification of Environmental Tobacco Smoke as a Toxic Air Contaminant. Sacramento, CA: California Environmental Protection Agency, Office of Environmental Health Hazard Assessment; 2005
2. Landau LI. Parental smoking: asthma and
wheezing illnesses in infants and chil-dren. Paediatr Respir Rev. 2001;2(3): 202–206
3. Tager IB. The effects of second-hand and direct exposure to tobacco smoke on asthma and lung function in adolescence.
Paediatr Respir Rev. 2008;9(1):29 –37; quiz 37–28
4. US Department of Health and Human Ser-vices.The Health Consequences of Involun-tary Exposure to Tobacco Smoke: A Report of the Surgeon General. Washington, DC: US Department of Health and Human Services,
Centers for Disease Control and Prevention, National Center for Chronic Disease Preven-tion and Health PromoPreven-tion, Office on Smok-ing and Health; 2006
5. World Health Organization. Monographs on the Evaluation of Carcinogenic Risks to
Hu-mans. Lyon, France: International Agency for Research on Cancer Press; 2004
6. David GL, Koh WP, Lee HP, Yu MC, London SJ. Childhood exposure to environmental to-bacco smoke and chronic respiratory symptoms in non-smoking adults: the Sin-gapore Chinese Health Study.Thorax. 2005;
60(12):1052–1058
the MESA-lung study. Am J Epidemiol. 2010;171(1):54 – 62
8. Olivo-Marston SE, Yang P, Mechanic LE, et al. Childhood exposure to secondhand smoke and functional mannose binding lectin polymorphisms are associated with increased lung cancer risk.Cancer Epidemiol Biomarkers Prev. 2009;18(12): 3375–3383
9. Svanes C, Omenaas E, Jarvis D, Chinn S, Gulsvik A, Burney P. Parental smoking in childhood and adult obstructive lung disease: results from the European Com-munity Respiratory Health Survey.Thorax. 2004;59(4):295–302
10. Wang FL, Love EJ, Liu N, Dai XD. Childhood and adolescent passive smoking and the risk of female lung cancer.Int J Epidemiol. 1994;23(2):223–230
11. Centers for Disease Control and Prevention. Exposure to secondhand smoke among stu-dents aged 13–15 years: worldwide, 2000 –2007.MMWR Morb Mortal Wkly Rep. 2007;56(20):497–500
12. Seo DC, Torabi MR, Weaver AE. Factors in-fluencing openness to future smoking among nonsmoking adolescents. J Sch Health. 2008;78(6):328 –336; quiz 356 –328
13. Gritz ER, Prokhorov AV, Hudmon KS, et al. Predictors of susceptibility to smoking and ever smoking: a longitudinal study in a tri-ethnic sample of adolescents.Nicotine Tob Res. 2003;5(4):493–506
14. Jackson C. Cognitive susceptibility to smok-ing and initiation of smoksmok-ing dursmok-ing childhood: a longitudinal study.Prev Med. 1998;27(1):129 –134
15. Unger JB, Johnson CA, Stoddard JL, Nezami E, Chou CP. Identification of adolescents at risk for smoking initiation: validation of a measure of susceptibility. Addict Behav. 1997;22(1):81–91
16. Bélanger M, O’Loughlin J, Okoli CT, et al. Nic-otine dependence symptoms among young never-smokers exposed to secondhand to-bacco smoke. Addict Behav. 2008;33(12): 1557–1563
17. Becklake MR, Ghezzo H, Ernst P. Childhood predictors of smoking in adolescence: a follow-up study of Montreal schoolchildren. CMAJ. 2005;173(4):377–379
18. Boardman JD. State-level moderation of ge-netic tendencies to smoke. Am J Public Health. 2009;99(3):480 – 486
19. Han C, McGue MK, Iacono WG. Lifetime to-bacco, alcohol and other substance use in adolescent Minnesota twins: univariate and multivariate behavioral genetic analyses. Addiction. 1999;94(7):981–993
20. Kendler KS, Schmitt E, Aggen SH, Prescott CA. Genetic and environmental influences on alcohol, caffeine, cannabis, and nicotine use from early adolescence to middle adult-hood. Arch Gen Psychiatry. 2008;65(6): 674 – 682
21. Maes HH, Woodard CE, Murrelle L, et al. Tobacco, alcohol and drug use in eight- to sixteen-year-old twins: the Virginia Twin Study of Adolescent Behavioral Develop-ment.J Stud Alcohol. 1999;60(3):293–305
22. Anthonisen N, Murray R. A new childhood pathway for transmission of an increased likelihood of smoking?CMAJ. 2005;173(4): 382–383
23. Ehringer MA, Clegg HV, Collins AC, et al. As-sociation of the neuronal nicotinic receptor beta2 subunit gene (CHRNB2) with subjec-tive responses to alcohol and nicotine.Am J Med Genet B Neuropsychiatr Genet. 2007; 144B(5):596 – 604
24. Ehringer MA, McQueen MB, Hoft NR, et al. Association of CHRN genes with “dizziness” to tobacco.Am J Med Genet B Neuropsychi-atr Genet. 2010;153B(2):600 – 609
25. Chen X, Stacy A, Zheng H, et al. Sensations from initial exposure to nicotine predicting adolescent smoking in China: a potential measure of vulnerability to nicotine. Nico-tine Tob Res. 2003;5(4):455– 463
26. DiFranza JR, Savageau JA, Fletcher K, et al. Recollections and repercussions of the first inhaled cigarette.Addict Behav. 2004;29(2): 261–272
27. Hu MC, Davies M, Kandel DB. Epidemiology and correlates of daily smoking and nico-tine dependence among young adults in the United States.Am J Public Health. 2006; 96(2):299 –308
28. Lessov-Schlaggar CN, Wahlgren DR, Liles S, et al. Sensitivity to secondhand smoke expo-sure predicts smoking susceptibility in 8 to 13 year-old never smokers. J Adolesc Health. 2011;48(3):234 –240
29. Meliska CJ, Gilbert DG. Hormonal and sub-jective effects of smoking the first five ciga-rettes of the day: a comparison in males and females.Pharmacol Biochem Behav. 1991;40(2):229 –235
30. Pomerleau OF. Individual differences in sen-sitivity to nicotine: implications for genetic research on nicotine dependence. Behav Genet. 1995;25(2):161–177
31. Pierce JP, Choi WS, Gilpin EA, Farkas AJ, Mer-ritt RK. Validation of susceptibility as a pre-dictor of which adolescents take up smok-ing in the United States.Health Psychol. 1996;15(5):355–361
32. Kaufman NJ, Castrucci BC, Mowery PD,
Ger-lach KK, Emont S, Orleans CT. Predictors of change on the smoking uptake continuum among adolescents.Arch Pediatr Adolesc Med. 2002;156(6):581–587
33. Drobes DJ, Munafo MR, Leigh F, Saladin ME. A family smoking index to capture genetic influence in smoking: rationale and two val-idation studies.Nicotine Tob Res. 2005;7(1): 41– 46
34. Milne BJ, Moffitt TE, Crump R, et al. How should we construct psychiatric family his-tory scores? A comparison of alternative approaches from the Dunedin Family Health History Study. Psychol Med. 2008;38(12): 1793–1802
35. Johnson-Kozlow M, Wahlgren DR, Hovell MF, et al. Adolescents validly report their expo-sure to secondhand smoke. J Clin Epide-miol. 2010;63(8):914 –919
36. SAS Institute.SAS/STAT User’s Guide Ver-sion 9. Cary, NC: SAS Institute; 2004
37. Tabachnick GB, Fidell LS.Using Multivariate Statistics. 5th ed. Upper Saddle River, NJ: Pearson Education; 2007
38. Stata Statistical Software[computer pro-gram]. Release 9.0. College Station, TX: Stata Corporation; 2005
39. Jones BL, Nagin D, Roeder K. A SAS proce-dure based on mixture models for estimat-ing developmental trajectories. Sociol Methods Res. 2001;29(3):374 –393
4 0 . N a g i n D . A n a l y z i n g d e v e l o p m e n t a l trajectories: semi-parametric, group-based approach.Psychol Methods. 1999; 4(2):139 –177
41. Nagin DS, Tremblay RE. Analyzing develop-mental trajectories of distinct but related behaviors: a group-based method.Psychol Methods. 2001;6(1):18 –34
42. Schwarz G. Estimating the dimension of a model.Ann Statistics. 1978;6(2):461– 464
43. Kandel DB, Hu MC, Griesler PC, Schaffran C. On the development of nicotine dependence in adolescence.Drug Alcohol Depend. 2007; 91(1):26 –39
44. Giovino GA, Sidney S, Gfroerer JC, et al. Epi-demiology of menthol cigarette use. Nico-tine Tob Res. 2004;6(suppl 1):S67–S81
45. Substance Abuse and Mental Health Ser-vices Administration Office of Applied Stud-ies.The NSDUH Report: Use of Menthol Cig-arettes. Rockville, MD: Substance Abuse and Mental Health Services Administration; 2009
47. Curfman GD, Morrissey S, Drazen JM. The FDA and tobacco regulation.N Engl J Med. 2008;359(10):1056 –1057
48. Centers for Disease Control and Prevention. Disparities in secondhand smoke exposure-United States, 1988 –1994 and 1999 –2004. MMWR Morb Mortal Wkly Rep. 2008;57(27): 744 –747
49. Kandel DB, Griesler PC, Schaffran C. Educa-tional attainment and smoking among women: risk factors and consequences for offspring. Drug Alcohol Depend. 2009; 104(suppl 1):S24 –S33
50. McCaffery JM, Papandonatos GD, Lyons MJ, Niaura R. Educational attainment and the heritability of self-reported
hypertension among male Vietnam-era t w i n s . P s y c h o s o m M e d. 2 0 0 8 ; 7 0 ( 7 ) : 781–786
51. Siegel D, Faigeles B. Smoking and socioeco-nomic status in a population-based inner city sample of African-Americans, Latinos and whites.J Cardiovasc Risk. 1996;3(3): 295–300
IS THERE A DOCTOR ON-BOARD?:“Is there a doctor on the plane?” I was on a long flight home from east Africa and finally asleep when these words filtered through my consciousness. Evidently, the same call a few minutes earlier had gone unanswered. I roused myself and with some trepidation presented myself to the flight attendants. They were somewhat dubious. I began my travels the previous day in rural Uganda and made long layovers in Entebbe and Addis Ababa and was now somewhere over the eastern Atlantic. I was rumpled and my breath could peel paint. After confirming that I was indeed a physician, the attendants asked if I could take care of a child with breathing problems. I breathed a huge sigh of relief. I had dreaded the prospect treating an adult with
chest pain. As reported inThe New York Times(Health: May 23, 2011), during
airline travel physicians are routinely called upon to treat ill passengers that have problems clearly outside their area of expertise. Nobody knows how many in-flight emergencies occur as airlines do not need to report this data. However, a company that provides medical advice for 60 airlines managed approximately 19 000 in-flight medical emergencies in 2010. Most were not life-threatening, but 442 required diverting the plane to another destination and in 94, passengers died. While flight attendants on U.S. carriers want to know if the plane needs to be diverted, my African flight crew did not offer that option. U.S. carriers are required to carry a medical kit but the content of the medical kit is not stan-dardized. In my case, the child had croup and was in moderate distress. I asked the flight attendants if they had a medical kit and they produced a case that had a laryngoscope and a single adult sized ET tube (but no anesthesia bag). Amidst medications used to treat diabetes, seizures, and angina, I found a vial of hy-drocortisone. Unfortunately, the only needles in the case were truly massive (even by adult standards). After reassuring the parents (yet again) that I was indeed a pediatrician, I told them that the injection would hurt but the child would feel better in a few hours. The injection did indeed hurt like the dickens but a few hours later, the child was breathing better, drinking, and the parents were both happy and grateful. I wrote a brief note for both parents and the airline (although that is not required) and while the child looked fine, banked on the fact that my services were protected by Good Samaritan laws. While physi-cians receive no payment for their services, occasionally they are rewarded by the airline. As for me, the attendants were quite happy and they gave me a toothbrush and some toothpaste.
DOI: 10.1542/peds.2010-3156 originally published online July 11, 2011;
2011;128;254
Pediatrics
Hovell
F.
C. Hughes, Jonathan P. Winickoff, Jennifer A. Jones, Gary E. Swan and Melbourne
Christina N. Lessov-Schlaggar, Dennis R. Wahlgren, Sandy Liles, Ming Ji, Suzanne
Services
Updated Information &
http://pediatrics.aappublications.org/content/128/2/254 including high resolution figures, can be found at:
References
http://pediatrics.aappublications.org/content/128/2/254#BIBL This article cites 44 articles, 6 of which you can access for free at:
Subspecialty Collections
http://www.aappublications.org/cgi/collection/smoking_sub Smoking
http://www.aappublications.org/cgi/collection/substance_abuse_sub Substance Use
following collection(s):
This article, along with others on similar topics, appears in the
Permissions & Licensing
http://www.aappublications.org/site/misc/Permissions.xhtml in its entirety can be found online at:
Information about reproducing this article in parts (figures, tables) or
Reprints
DOI: 10.1542/peds.2010-3156 originally published online July 11, 2011;
2011;128;254
Pediatrics
Hovell
F.
C. Hughes, Jonathan P. Winickoff, Jennifer A. Jones, Gary E. Swan and Melbourne
Christina N. Lessov-Schlaggar, Dennis R. Wahlgren, Sandy Liles, Ming Ji, Suzanne
Susceptibility
Sensitivity to Secondhand Smoke Exposure Predicts Future Smoking
http://pediatrics.aappublications.org/content/128/2/254
located on the World Wide Web at:
The online version of this article, along with updated information and services, is
by the American Academy of Pediatrics. All rights reserved. Print ISSN: 1073-0397.