EFFECTIVE GENE SELECTION TECHNIQUES FOR CLASSIFICATION OF GENE EXPRESSION DATA
YEO LEE CHIN
EFFECTIVE GENE SELECTION TECHNIQUES FOR CLASSIFICATION OF GENE EXPRESSION DATA
YEO LEE CHIN
A thesis submitted in fulfilment of the requirements for the award of the degree of
Master of Science (Computer Science)
Faculty of Computer Science and Information Systems Universiti Teknologi Malaysia
ACKNOWLEDGMENTS
I would like to express my sincere thanks to Professor Safaai Deris, my supervisor, for his encouragement, patient guidance, and valuable advices. Despite of his busy schedule, he was always available to support my research work during my years at UTM. He corrected my work patiently, taught me how to improve it, encouraged me to report the results of my research, perhaps the part that I like less.
My sincere appreciation also goes to all the colleagues and friends not only for their continuous help, but also for their friendship.
ABSTRACT
ABSTRAK
Pembangunan teknologi microarray membolehkan penyelidik mengawal beribu-ribu tahap ekspresi gen dalam satu eksperimen microarray. Pengkelasan sampel tisu kepada tisu tumor atau tisu biasa merupakan salah satu aplikasi teknologi
microarray. Semasa pengkelasan sampel tisu, pemilihan gen memainkan peranan
penting. Dalam penyelidikan ini, beberapa teknik pemilihan gen sedia ada telah dikaji dan teknik yang lebih baik telah dicadangkan dan dibangunkan. Pendekatan cadangan dilakukan dengan pertamanya kumpulkan gen yang profail ekspresinya sama dalam gugusan yang sama, kira kualiti setiap gugusan, kira nilai diskriminasi setiap gen dengan menggunakan teknik statistik, dan akhirnya pilih gen berdasarkan kualiti gugusan dan nilai diskriminasi. Gen terpilih kemudiannya digunakan untuk melatih algoritma pengkelas supaya mendapat peraturan yang dapat mengkelaskan sampel tisu baru. Untuk mengumpulkan gen, beberapa algoritma gugusan k-means
dan algoritma gugusan model-based telah dicadangkan. Teknik statistik yang digunakan adalah Fisher Criterion, Golub Signal-to-Noise, Mann-Whitney Rank Sum Statistic dan traditional t-test. Support Vector Machine (SVM) dan k-nearest
neighbour (k-nn) digunakan untuk tujuan pengkelasan. Prestasi teknik cadangan
disahkan dengan menggunakan teknik leave one out cross validation (LOOCV).
Receiver operating characteristic (ROC) digunakan untuk menganalisa keputusan
TABLE OF CONTENTS
CHAPTER TITLE PAGE
DECLARATION DEDICATION
ACKNOWLEDGMENTS ABSTRACT
ABSTRAK
TABLE OF CONTENTS LIST OF TABLES LIST OF FIGURES LIST OF APPENDICES LIST OF ABBREVATIONS
ii iii iv v vi vii xi xiii xvii xviii 1 INTRODUCTION 1.1 Introduction
1.2 The Background of Microarray 1.3 Motivations of the Research 1.4 Objectives of the Study 1.5 Scope of the Study 1.6 Thesis Outline
1 1 4 8 10 11 12
2 LITERATURE REVIEW
2.1 Introduction 2.2 Gene Selection
2.2.1 Filter Approach 2.2.2 Wrapper Approach
2.3 Tissue Classification
2.4 Validation and Evaluation of the Results 2.5 Summary
20 22 22
3 METHODOLOGY
3.1 Introduction
3.2 Research Framework
3.2.1 Data Collection and Preparation 3.2.2 Gene Selection
3.2.2.1 Gene Selection using Statistical Techniques
3.2.2.2 Gene Selection using Combination of Clustering
Algorithms and Statistical Techniques
3.2.3 Tissue Classification and Validation 3.3 Summary
24 24 24 26 27 27 30 34 35
4 STATISTICAL TECHNIQUES FOR GENE
SELECTION AND CLASSIFICATION OF GENE EXPRESSION DATA
4.1 Introduction
4.2 Statistical Techniques for Gene Selection and Classification of Gene Expression Data
4.2.1 The Procedure for Gene Selection and Classification
4.2.2 Statistical Techniques for Gene Selection 4.2.3 Tissue Classification
4.2.3.1 Support Vector Machines for Tissue Classification
4.2.3.2 k-nearest neighbor for Tissue Classification
4.2.4 Results Evaluation Method
4.3 Results and Discussion
4.3.1 Importance of Gene Selection Technique Prior to Tissue Classification
4.3.2 Classification Performance between Different Classifiers
4.3.3 Classification Performance between Different Statistical Techniques 4.4 Summary 42 43 44 49 51
5 COMBINATION OF K-MEANS CLUSTERING
ALGORITHM AND STATISTICAL TECHINQUES FOR GENE SELECTION AND CLASSIFICATION OF GENE EXPRESSION DATA
5.1 Introduction
5.2 Combination of k-means Clustering Algorithm and Statistical Techniques for Gene Selection and Classification of Gene Expression Data
5.2.1 The Procedure for Gene Selection and Classification
5.2.2 k-means Clustering Algorithms 5.3 Results and Discussion
5.3.1 Classification Performance between Different Combinations of the Gene Selection Technique
6 COMBINATION OF MODEL-BASED
CLUSTERING ALGORITHM AND STATISTICAL TECHINQUES FOR GENE SELECTION AND CLASSIFICATION OF GENE EXPRESSION DATA 6.1 Introduction
6.2 Combination of Model-Based Clustering Algorithms and Statistical Techniques for Gene Selection and Classification of Gene Expression Data
6.2.1 The Procedure for Gene Selection and Classification
6.2.2 Model-Based Clustering Algorithms for Gene Selection
6.3 Results and Discussion 6.3.1 BIC Score
6.3.2 Classification Performance Comparison
6.4 Overall Results Discussion 6.5 Summary 68 68 69 70 70 79 79 80 84 86
7 CONCLUSION AND FUTURE WORK
7.1 Introduction
7.2 Research Conclusion 7.3 Research Contributions 7.3 Future Work
7.5 Closing 88 88 88 90 91 92
REFERENCE 93
LIST OF TABLES
TABLE NO. TITLE PAGE
1.1 Causes of death due to cancer among medically certified deaths in Malaysia in 1998 (% of medically certified deaths)
8
2.1 An example of the gene expression data (sorted t-test
p-value)
17
2.2 Correlation score for the example data in Table 2.1 17
4.1 Summary for classification performance by using SVMs with different kernels after gene selection by using statistical techniques
46
4.2 Summary for classification performance by using different k-nn after gene selection by using statistical techniques
47
5.1 Example of the experiment parameters combination 60
5.2 Four combinations of various k-means clustering algorithm
5.3 Summary for classification performance by using different combination of k-means clustering algorithm and statistical techniques and the performance for the experiment without using clustering algorithm
63
6.1 The model number and the covariance criterion 72
6.2 Model-based clustering algorithm (Martinez and Martinez, 2004)
73
6.3 The probabilities for the five genes belonging to three clusters
78
6.4 The cluster quality calculation example 78
6.5 Average BIC score for the four models 80
6.6 Summary for the results from best combination of the third gene selection technique (i.e. by using model-based clustering), Chapter IV and Chapter V
82
6.7 The comparison of the classification performance with the cited literature
LIST OF FIGURES
FIGURE NO. TITLE PAGE
1.1 Central Dogma of biology 2
1.2 Alteration of certain genes in different cells (Sebastiani et al., 2002)
3
1.3 Microarray analysis cycle 5
1.4 An example of microarray experiment (Diagram courtesy of Jeremy Buhler.
6
1.5 Sample Image 7
2.1 The difference between filter approach and wrapper approach (Yang and Honavar, 1997)
15
3.1 Research Framework 25
3.2 Gene selection using statistical techniques 28
3.3 Overview of the gene selection using statistical techniques
3.4 Illustration of gene selection technique using statistical techniques based on the example of gene expression data in Table 2.1
30
3.5 Gene selection using combination of clustering algorithm and statistical techniques
31
3.6 Overview of the gene selection using combination of clustering and statistical techniques based on the example of gene expression data in Table 2.1
32
3.7 Illustration of the gene selection using combination of clustering and statistical techniques based on the example of gene expression data in Table 2.1
33
3.8 The LOOCV process (Jaegar et al., 2003) 35
4.1 The procedure for the gene selection using statistical techniques
38
4.2 Classification performance by using all genes and genes selected by statistical techniques
43
4.3 Classification performance by using SVMs with different kernels after gene selection by using statistical techniques
45
4.4 Classification performance by using different k-nn after gene selection by using statistical techniques
4.5 Classification performance between different classifiers after gene selection using statistical techniques (the best classifier is selected from SVM and k-nn)
48
4.6 Classification performance between different statistical techniques (the best classifier is used)
50
5.1 The procedure for the gene selection technique using k-means clustering algorithm and statistical
techniques
55
5.2 Basic k-means clustering algorithm 56
5.3 Classification performance between different combinations of the gene selection technique
62
5.4 Classification performance between combination of best clustering algorithm and the statistical
techniques in 3D plot
64
5.5 Classification performance between combination of best clustering algorithm and the statistical
techniques in 2-D plot
66
6.1 The procedure for the gene selection technique using model-based clustering algorithm and statistical techniques
71
6.2 Flowchart illustrates the model-based clustering procedure
74
6.4 Classification performance for the results from Chapter IV and Chapter V and best combination of the gene selection using model-based clustering algorithm
82
6.5 Classification performance between combination of best model-based clustering algorithm and the statistical techniques
LIST OF APPENDICES
APPENDIX TITLE PAGE
A The Data 99
B The Resuts 104
LIST OF ABBREVIATIONS
AUC – Area Under the Curve
BIC – Bayesian Information Criterion
cDNA – Complementary Deoxyribonucleic Acid
DNA – Deoxyribonucleic Acid
EM – Expectation Maximization
EST – Expressed Sequence Tags
E-step – Expectation-step
GA – Genetic Algorithm
k-nn – k-nearest neighbor
LOOCV – Leave One Out Cross Validation
mRNA – Messenger Ribonucleic Acid
M-step – Maximization-step
p-value – Probability-value
RNA – Ribonucleic Acid
ROC – Receiver Operatoring Characteristic SOM – Self Organizing Map
CHAPTER 1
INTRODUCTION
1.1 Introduction
Almost every cell in the body of an organism contains an identical copy of the deoxyribonucleic acid (DNA) (Avers, 1985). Genes are segment of this DNA that carry genetic information for encoding specific cellular ribonucleic acid (RNA) and proteins. Central dogma of biology states that the coded genetic information in DNA is transcribed into messenger ribonucleic acid (mRNA), which is then
Figure 1.1: Central Dogma of biology
Figure 1.2: Alteration of certain genes in different cells (Sebastiani et al., 2002)
The recent introduction of microarray technology (Lander, 1999; Schena, 2002; Schena, et al., 2003; Stears et al., 2003) allows researchers to monitor gene expression levels in a microarray experiment. Therefore, microarray experiments can be constructed to measure the gene expression level, and the data from microarray experiments can be further analyzed in order to select genes which are responsible for the tumor from the normal tissue (Aliferis et al., 2003; Bhattacharjee et al., 2001; Ben-Dor et al., 2000; Bittner, 2000; Furey et al., 2000; Lu and Han, 2003; Mukherjee et al., 1999). In computer science, selecting informative genes for tissue separation (or classification) can be solved by using machine learning
techniques, in which selecting subset of informative genes which are responsible for the tumor from the normal tissue is referred to as feature selection or the gene selection problem and classifying the tissue into tumor or normal is referred to as tissue classification problem.
presented. The goal and objectives of the research is presented in Section 1.4 and the scope of the research is presented in Section 1.5. The thesis outlines for the
following chapters closes the chapter in Section 1.6.
1.2 The Background of Microarray
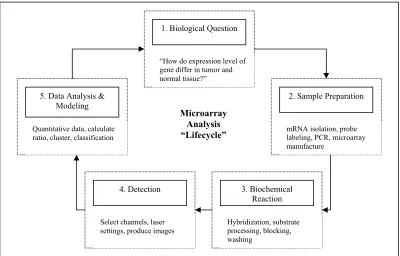
On a typical microarray, there are several thousands of genes or expressed sequence tags (ESTs) spotted on a microarray (Affymetrix spots 20 matching and 20 mismatching oligonucleotides from one gene, other arrays usually only spot one longer oligonucleotide or a complete complementary deoxyribonucleic acid (cDNA)) (Schena, 2002). This microarray is used for the experiment and data is gathered for further analysis. The experimental design can be simplified by the five steps in the microarray analysis cycle (Schena, 2002): 1) biological question, 2) sample
Figure 1.3: Microarray analysis cycle
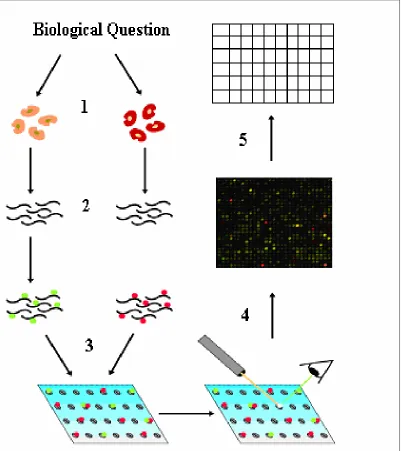
Figure 1.4 illustrates an example of microarray experiment. Firstly, the biological question is asked and then the sample of interest is prepared, then the mRNA is extracted and copied into cDNA in Step 2. This cDNA will be
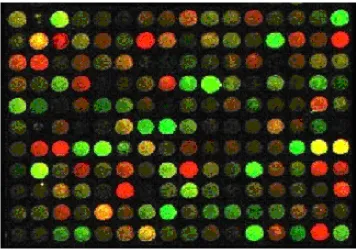
radioactively or fluorescently labeled and poured over the microarray in Step 3 for the biochemical reaction to happen. After a certain annealing time, the rest of the probe mixture is washed away and only the cDNA complimentary to the genes spotted will remain on the array and detected. The main idea here is that the more complimentary cDNA present in the probe, the more cDNA will anneal and the brighter the spot will be. The microarray will then be put in a scanner or on a screen as in Step 4; the data is collected in the form of a digital picture of the microarray. For an example of the image, refer to Figure 1.5. Image analysis software then reads in the picture, tries to identify the spots, and outputs the intensities and colors for these spots in numerical data in Step 5. These values might be corrected for the surrounding background and overflowing spots (Yang et al., 2000).
1. Biological Question
“How do expression level of gene differ in tumor and normal tissue?”
2. Sample Preparation
mRNA isolation, probe labeling, PCR, microarray manufacture 3. Biochemical Reaction Hybridization, substrate processing, blocking, washing
5. Data Analysis & Modeling
Quantitative data, calculate ratio, cluster, classification
4. Detection
Select channels, laser settings, produce images
Figure 1.5: Sample Image
A final step called data normalization takes place after obtaining the numerical data from the image. The purpose of this step is to counter systematic variation (e.g. difference in labeling efficiency for different dyes) and to allow a comparison between different microarrays (Yang et al., 2002).
1.3 Motivations of the Research
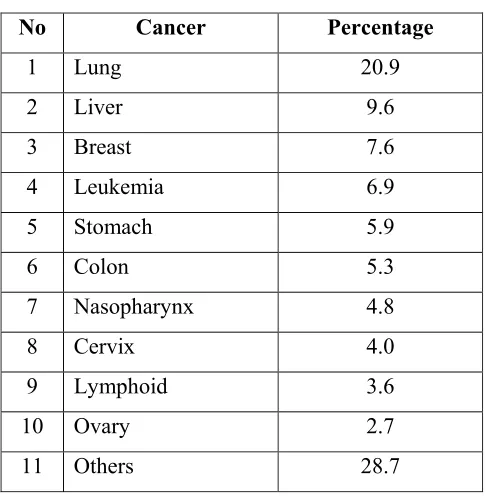
Cancer constitutes 10.3% of medically certified deaths, which is the fourth leading cause of death in Malaysia (Table 1.1) (Lim, 2002). The proportion of deaths due to cancer would very likely be higher if all deaths had been medically certified. In a regional cancer registry survey, the 10 leading cancers among males were lung, nasopharynx, stomach, urinary bladder, rectum, non-Hodgkin’s
lymphoma, larynx, liver, colon and esophagus and in females cervix, breast, ovary, lung, nasopharynx, esophagus, thyroid, colon, rectum and non-Hodgkin’s lymphoma. A fast and reliable experiment and data analysis tool is needed for identification of the onset of the tumor cells before any further treatment and diagnosis is carried out.
Table 1.1: Causes of death due to cancer among medically certified deaths in Malaysia in 1998 (% of medically certified deaths)
No Cancer Percentage
1 Lung 20.9
2 Liver 9.6
3 Breast 7.6
4 Leukemia 6.9
5 Stomach 5.9
6 Colon 5.3
7 Nasopharynx 4.8
8 Cervix 4.0
9 Lymphoid 3.6
10 Ovary 2.7
11 Others 28.7
cells based on the gene expression profiles provided by the microarray experiments. Not only can microarray technology helps to identify and select genes which are related to the cancers, the information and knowledge gathered can be further used to identify/classify future unknown tissue sample into normal or tumor tissue. Since the expression of all genes in an organism can be studied simultaneously in a microarray experiment, microarray experiment is creating a wealth of gene expression data. Typically these datasets have a high dimensionality corresponding to the large number of probes used in the technology and there are often comparatively few examples, leading to a curse of dimensionality problem. Many of the data are redundant and are irrelevant to the experiments. They might also contain noise and are unclassifiable. Moreover, genes are only expressed at certain times, in certain environmental conditions, and in certain cell types, not all genes are responsible for the targeted tissue. Without computer, selecting the informative genes manually is time consuming. Therefore, there is a great need to develop analytical methodology to select informative genes that have the biggest impact on separating the tissue sample and drop the genes with little or no effect by using the advancement of computer technology (Liu et al., 2002; Xing et al., 2003).
experiment for all trials in order to select the best parameter settings. Different dataset has different properties, thus, the parameter settings for one dataset might not be suitable for the use of another dataset. In the wrapper approach, some techniques like forward searching, branch and bound or genetic algorithm have been employed together with the classifiers to evaluate each and every possible subset of genes that provide the best results. Therefore, wrapper approach is computational expensive to run.
In the tissue classification problem, several machine learning techniques like Support Vector Machines (SVMs) (Mukherjee et al., 1999; Furey et al., 2000), Neural Network, k-nearest neighbor (k-nn), Self-Organizing Map (Cho and Won, 2003) and so on are being applied. The classification performance of these
classifiers depends greatly on the input. The input here is the genes. Therefore, gene selection plays a very important role prior to the tissue classification problem. Thus, in this research, the focus is on developing better gene selection techniques that can improve the classification performance. For more details about the existing gene selection techniques and their problems, refer to Chapter 2 of this thesis.
1.4 Objectives of the Study
The goal of this research is to develop better gene selection techniques for selecting informative genes. The selected subset of genes can then be used to train the classifiers in order to construct a rule to classify future unknown tissue sample into tumor or normal tissue. To realize the goal, several specific objectives need to be achieved:
ii) To develop better gene selection techniques using combination of clustering and statistical techniques
iii) To train the classifiers and to construct decision rules for classification of future unknown tissue sample by using the selected genes
iv) To assess the resultant decision procedure by estimation of the overall error rate from a test sample
1.5 Scope of the Study
This research focuses on tumor and normal colon tissue classification. The data is already background-corrected and normalized from the image from
microarray experiment, and these problems are not the focus in this research. Full dataset is needed for the experiment and no missing data is allowed.
1.6 Thesis Outline
This section gives a general description of the contents of subsequent chapters in this thesis. Chapter 2 gives a review of the various techniques used for the gene selection and classification problem. Chapter 3 describes the methodology adopted to achieve the objectives of this research. In Chapter 4, the design,
implementation and evaluation of the statistical techniques as the gene selection technique is presented. Chapter 5 presents the design, implementation and evaluation of the combination of k-means clustering algorithm and statistical techniques as the gene selection technique while Chapter 6 presents the design, implementation and evaluation of the combination of model-based clustering
REFERENCE
Albertson, D.G., Collins, C., McCormick, F. and Gray, J.W. (2003).
Chromosome Aberrations in Solid Tumors, Nature Genetics. pp. 369 – 376. Aliferis, G.F., Tsamardinos, I., Massion, P.P., Statnikov, A., Fananapazir, N. and
Hardin, D. (2003). Machine Learning Models For Classification Of Lung Cancer and Selection of Genomic Markers Using Array Gene Expression Data. (to appear in: FLAIRS 2003, special track AI in Medicine).
Alon, U., Barkai, N., Notterman, D.A., Gish, K., Ybarra, S., Mack, D. and Levine, A.J. (1999). Broad Patterns of Gene Expression Revealed by Clustering Analysis of Tumor and Normal Colon Cancer Tissues Probed by Oligonucleotide Arrays. PNAS.(96):6745 – 6750.
Avers, C.J. (1985). Molecular Cell Biology, California: Addison-Wesley Publishing Company.
Banfield, J.D. and Raftery, A.E. (1993). Model-Based Clustering Gaussian and Non-Gaussian Clustering. Biometrics. (49):803 – 821.
Ben-Dor, L., Bruhn, N., Friedman, I., Nachman, M., Schummer, M. and Yakhini, Z. (2000). Tissue Classification with Gene Expression Profiles. J. Comput Biol. pp. 559 – 584.
Bhattacharjee, A., Richards, W.G., Staunton, J., Li, C., Monti, S., Vasa, P., Ladd, C., Beheshti, J., Bueno, R., Gillette, M., Loda, M., Weber, G., Mark, E., Lander, E.S., Wong, W., Johnson, B.E., Golub, T.R., Sugarbaker, D.J. and Meyerson, M. (2001). Classification Of Human Lung Carcinomas By mRna Expression Analysis Reveals Distinct Adenocarcinoma Subclasses. Proc. Natl. Acad. Sci. (98):13790 – 13795.
Wang, E., Marincola, F., Gooden, C., Lueders, J., Glatfelter, A., Pollock, P., Carpten, J., Gillanders, E., Leja, D., Dietrich, K., Beaudry, C., Berens, M., Alberts, D., Sondak, V., Hayward, N. and Trent, J. (2000). Molecular Classification Of Cutaneous Malignant Melanoma By Gene Expression Profiling. Nature.(406):536 – 540.
Boer, J.M., Huber, W.K., Sultmann, H., Wilmer, F., von Heydebreck, A., Haas, S., Korn, B., Gunawan, B., Vente, A., Fuzesi, L., Vingron, M. and Poustka. A. (2001). Identification And Classification Of Differentially Expressed Genes In Renal Cell Carcinoma By Expression Profiling On A Global Human 31,500-Element Cdna Array. Genome Res. 11(11):1861 – 70. Broberg, P. (2003). Statistical Methods For Ranking Differentially Expressed
Genes. Genome Biol. 4(6):R41.
Brown, P.O. and Botstein, D. (1999). Exploring the New World of the Genome with DNA Microarrays. Nat Genet. 21(1 Suppl):33 – 7.
Brown, M.P.S., Grundy, W.N., Lin, D., Cristianini, N., Sugnet, C.W., Furey, T.S., Ares M. and Haussler, Jr. D. (2000). Knowledge-based Analysis of Microarray Gene Expression Data by Using Support Vector Machines.
Proc. Natl. Acad. Sci. USA, (97): 262 – 267.
Burges, C.J.C. (1998). A Tutorial on Support Vector Machines for Pattern Recognition. Data Mining and Knowledge Discovery. 2(2):121 – 167. Callow, M.J., Dudoit, S., Gong, E.L., Speed, T.P. and Rubin, E.M. (2000).
Microarray Expression Profiling Identifies Genes with Altered Expression In HDL-Deficient Mice. Genome Res. 10(12):2022 – 9.
Chen, X.W. (2003). Gene Selection for Cancer Classification Using Bootstrapped Genetic Algorithms and Support Vector Machines. Proceedings of the
Computational Systems Bioinformatics (CSB'03). IEEE.
Chen, Y., Dougherty, E.R. and Bittner, M.L. (1997). Ratio-Based Decisions and the Quantitative Analysis of cDNA Microarray Images. Journal Of
Biomedical Optics. 2(4):364 – 374.
Cho, So. and Won, H. (2003). Machine Learning in DNA Microarray Analysis for Cancer Classification. APBC. (2003):189-198.
Cristianini, N. and Shawe-Taylor, J. (2000). An Introduction to Support Vector
Cambridge University Press.
Domura, D., Nakamura, H., Tsutsumi, S., Aburatani, H. and Ihara, S. (2002). Characteristics of Support Vector Machines in Gene Expression Analysis.
Genome Informatics. (13):264 – 265.
DeRisi, J., Penland, L., Brown, P. O., Bittner, M. L., Meltzer, P., Ray, M., Chen, Y., Su, Y. and Trent, J. (1996). Use of a cDNA Microarray to Analyze Gene Expression Patterns in Human Cancer. Nature Genetics. (14):457 – 460.
Dempster, A.P., Dempster, N., Laird, M. and Rubin, D.B. (1977). Maximum Likelihood for Incomplete Data via The EM Algorithm. Journal of the Royal Statistical Society. (39):1-38.
Dettling, M. and Bühlmann, P. (2003). Boosting for Tumor Classification with Gene Expression Data. Bioinformatics. pp.1061 – 1069.
Devore, J.L. (1995). Probability and Statistics for Engineering and the Sciences.
4thedition, California: Duxbury Press.
Dudoit, S., Fridlyand, J. and Speed, T. P. (2002). Comparison Of Discrimination Methods For The Classification Of Tumors Using Gene Expression Data.
Journal of the American Statistical Association. 97(576): 77 – 87.
Dudoit, S., Yang, Y.H., Callow, M.J. and Speed, T.P. (2002). Statistical Methods for Identifying Differentially Expressed Genes in Replicated cDNA
Microarray Experiments. Statistica Sinica. (12):111 – 139.
Eft'on, B. and Tibshirani, R. (1995). Cross-Validation and the Bootstrap: Estimating the Error Rate of a Prediction Rule. tech. rep., Standford University.
Eisen, M.B., Spellman, P.T., Brown, P.O. and Botstein, D. (1998). Cluster Analysis and Display of Genome-Wide Expression Patterns. Proc Natl Acad Sci. USA, (95):14863 – 8.
Everitt, B.S. (1993). Cluster analysis.New York: Edward Arnold.
Fraley, C. (1998). Algorithm for Model-Based Gaussian Hierarchical Clustering.
SIAM Journal on Scientific Computing. (20):270 – 281.
Fraley, C. and Raftery, A.E. (2002). Model-Based Clustering, Discriminant Analysis and Density Estimation. J. of the American Statistical Association. (97):611 – 631.
Friedman, M. and Kandel, A. (1999). Introduction to Pattern Recognition.
London: Imperial College Press.
Furey, T., Cristianini, N., Duffy, N., Bednarski, D., Schummer, M. and Haussler, D. (2000). Support Vector Machine Classification And Validation Of Cancer Tissue Samples Using Microarray Expression Data. Bioinformatics. pp. 906 – 914.
Golub, T.R., Slonim, D.K., Tamayo, P., Huard, C., Gaasenbeek, M., Mesirov, J.P., Coller, H., Loh, M.L., Downing, J.R., Caliguiri, M.A., Bloomfield, C.D. and Lander, E.S. (1999). Molecular Classification of Cancer: Class Discovery and Class Prediction by Gene Expression Monitoring. Science. (286):531 – 537.
Hartigan, J.A. (1975). Clustering Algorithms. New York: John Wiley & Sons. Irizarry, R.A., Parmigiani, G., Guo, M., Dracheva, T. and Jen, J. (2001). A
Statistical Analysis of Radiolabeled Gene Expression Data. In Proceedings of the 33rd Symposium on the Interface: Computing Science and Statistics.
Fairfax Station, VA, Interface Foundation of North America.
Jaeger, J., Sengupta, R. and Ruzzo, W.L. (2003). Improved Gene Selection for Classification of Microarrays. Pacific Symposium on Biocomputing. (8):53 – 64.
Joachims, T. (1998). Text Categorization with Support Vector Machines: Learning with Many Relevant Features. In Proceedings of the 10th
European Conference on Machine Learning (ECML). Springer Verlag.
Kohavi, R. and John, G. (1997). Wrappers for Feature Subset Selection. Artificial Intelligence. 97(1 – 2): 273 – 324.
Lander, E.S. (1999). Array of Hope. Nature Genetics Supplement. pp. 3 – 4. Lee, M.T., Kuo, F.C., Whitmore, G.A. and Sklar, J. (2000). Importance Of
Replication In Microarray Gene Expression Studies: Statistical Methods And Evidence From Repetitive Cdna Hybridizations. PNAS. 97(18):9834 – 9839.
Oncology. (32):S37 – S42.
Liu, H. and Motoda, H. (1998). Feature Selection for Knowledge Discovery And
Data Mining. USA: Kluwer Academic.
Liu, H., Li, J. and Wong, L. (2002). A Comparative Study on Feature Selection and Classification Methods Using Gene Expression Profiles and Proteomic Patterns. Genome Informatics.(13): 51 – 60.
Lu, Y. and Han, J.W. (2003). Cancer Classification Using Gene Expression Data.
Information System. (28)4: 243 – 268.
Martinez, A.R. and Martinez, W.L. (2004). Model-based Clustering Toolbox for MATLAB.
Mukherjee, S., Tamayo, P., Slonim, D., Verri, A., Golub, T., Mesirov, J.P. and Poggio, T. (1999). Support Vector Machine Classification of Microarray Data. S. Technical Report 182. AI Memo 1676, CBCL.
Newton, M.A., Kendziorski, C.M., Richmond, C.S., Blattner, F.R. and Tsui, K.W. (2001). On Differential Variability of Expression Ratios: Improving Statistical Inference about Gene Expression Changes from Microarray Data. J Comput Biol. 8(1):37 – 52.
Pan, W. (2002). A Comparative Review Of Statistical Methods For Discovering Differentially Expressed Genes In Replicated Microarray Experiments.
Bioinformatics. 18(4):546 – 54.
Pavlidis, P., Weston, J., Cai, J. and Grundy, W.H. (2000). Gene Functional Analysis from Heterogeneous Data. Submitted for publication.
Schena, M. (2002). Microarray Analysis.New York: John Wiley & Sons, Inc. Schena, M., Shalon, D., Davis, R. W. and Brown, P. O. (1995). Quantitative
Monitoring of Gene Expression Patterns with a Complementary DNA Microarray. Proc. Natl. Acad. Sci.. 93):10614 – 10619.
Schena, M., Shalon, D., Heller, R., Chai, A., Brown, P.O. and Davis, R.W. (1996). Parallel Human Genome Analysis: Microarray-Based Expression Monitoring Of 1000 Genes. Proc. Natl. Acad. Sci.. USA. pp.10614 – 10619. Sebastiani, P., Gussoni, E., Kohane, I. and Ramoni, M. (2002). Statistical
Challenges in Functional Genomics (with discussion). Statistical Science. In press.
Microarray Data Analysis. Methods Mol Biol.(224):111 – 136. Stears, R.L., Martinskt, T. and Schena, M. (2003). Trends in Microarray
Analysis. Nature Medicine. pp. 140 – 145.
Tsai, C.A., Chen, Y.J. and Chen, J. J. (2003). Testing For Differentially Expressed Genes With Microarray Data. Nucleic Acids Res. 31(9):e52. Wang, J., Bo, T.H., Jonassen, I., Myklebost, O. and Hovig, E. (2000). Tumor
Classification and Marker Gene Prediction by Feature Selection and Fuzzy
c-means Clustering using Microarray Data, BMC Bioinformatics. pp. 60 – 71.
Xing, E.P., Berrar, D.P., Dubitzky, W. and Granzow, M. (2003). Feature Selection in Microarray Analysis. Understanding And Using Microarray
Analysis Techniques: A Practical Guide. USA: Kluwer Academic.
Xiong, M.M., Fang, X.Z. and Zhao, J.Y. (2001). Biomarker Identification by Feature Wrappers. Genome Research. (11):1878 – 1887.
Yang, Y. H., Dudoit, S., Luuc, P. and Speed, T. P. (2002). Normalization for cDNA Microarray Data. SPIE.
Yang, Y.H., Buckely, M.J., Dudoit, S. and Speed, T.P. (2000). Comparison of Methods for Image Analysis on cDNA Microarray Data. Technical Report.
Yang, J. and Honavar, V. (1997). Feature Subset Selection Using a Genetic Algorithm. Proceedings of the Genetic Programming Conference.Stanford, CA. 380 – 385.