Quantitative Analysis Of The Expression Of P53 Gene In Colorectal
Carcinoma By Using Real – Time PCR
Hayder Tawfeeq Qaddoori M.Sc. Biochemistry
University College of Science, Department of Bio-Chemistry Osmania University, Hyderabad, India
Email:- [email protected]
Dr. Raju Padiya, M.Sc., Ph.D., Assistant Professor
University College of Science, Department of Bio-Chemistry Osmania University, Hyderabad, India
Abstract
The established role of P53 is in Base Excision Repair of adenine residues that have been
misincorporated opposite guanine or 8-oxoG (7, 8-dihydro-8-oxoguanine). The BER pathway
plays a significant role in the repair of mutations caused by reactive oxygen species that are
generated during aerobic metabolism Mutations in this gene affect the ability of cells to correct
mistakes made during DNA replication biallelic mutations have been shown to predispose to an
attenuated form of familial adenomatous polyposis (FAP)2 called P53. Most CRCs (colorectal
cancers) are thought to develop from pre-existing adenomas, and CRC risk is increased in
patients who have multiple adenomatous polyps in the colorectum. In the present work, the role
of P53 gene in colon cancer has been evaluated. For this colon cancer HT 29 Colon cancer cells
and MRC-5 fibroblast cells is collected. First the total RNA extraction is done, this total RNA is
converted to cDNA to further carry out Real Time PCR analysis of the gene expression. As a
result of the present study, it was observed that the gene expression levels of P53 are
considerably decreased in colon cancer cell lines as compared to the normal cell lines. This result
supports the previously carried out work on the role of P53 gene in colon cancer and
predisposition to cancer in case of mutations in P53 gene.
Keywords: Adenocarcinoma, Blastoma, Carcinoma, Leukemia, Lymphoma, Myeloma Sarcoma, Carcinogens, Colon
INTRODUCTION Cancer
National Cancer Institute has defined Cancer as a group of diseases in which abnormal cells
the body through the blood and lymph systems. Cancer is a genetic disorder involving
dynamic changes in the genome leading to uncontrolled cell growth, cell division, ability to
invade to distant organs through lymph or blood and metastasize. Cancer has been associated
with uncontrolled cell proliferation in which apoptotic defects have been the underlying
mechanisms in carcinogenesis. The failure of the apoptosis mechanism is due to changes in
the cellular phenotype cause by mutation of the genes [1]. This abnormal cellular response
creates an environment for genetic instability and the accumulation of DNA mutations which
can further increase malignancy [2]. There are more than 100 different types of cancer. Most
cancers are named for the organ or type of cell in which they start - for example, cancer that
begins in the in colon proximal is called polyps, cancer that begins in colon is called colon
cancer; cancer that begins tumor of the colon is called polyps [3]. Human cancer is a genetic
disease. The first implications of a genetic basis for cancer are endorsed to David Hansemann
and Theodor Boveri. They both observed abnormal numbers of chromosomes arising by
multipolar mitoses and suggested that this abnormality is the cause of tumor formation [4][5].
Figure 1: Growth from normal cell to abnormal cell (Source: www.cancerreseachuk.org)
these, 56% of the cases and 64% of the deaths occurred in the economically developing world [14]. A total of 1,596,670 new cancer cases and 571,950 deaths from cancer are projected to occur in the United States in 2011. Overall cancer incidence rates were stable in men in the most recent time after decreasing by 1.9% per year from 2001 to 2005; in women, incidence rates have been declining by 0.6% annually since 1998. Cancer is predicted to be progressively an important cause of morbidity and mortality all over the world. Global human population is expected to reach up to 7.5 billion by 2020. Out of these, about 15 million new cancer cases will be diagnosed, and approximately 12 million cancer patients will die [16] will rise to 21.4 million by 2030 [17]. Although, overall incidence rate of cancer in developing countries is half to that of the developed world, but it is increasing rapidly because of population aging and growth as well as an adoption of cancer-associated lifestyle choices.
Types of Cancer
Most accepted classification of cancer is based on type of tissue on which it originates and the location where it developed at first.
Adenocarcinoma: It is the type of cancer that originating in glandular tissue. This tissue is also part of a larger tissue category known as epithelial. Epithelial tissue includes, but is not limited to, skin, glands and a variety of other tissue that lines the cavities and organs of the body. To be classified as adenocarcinoma, the cells do not necessarily need to be part of a gland, if they have secretory properties.
Blastoma: It originates in the embryonic tissue of organs. A tumour composed of embryonic tissue that has not yet developed a specialized function. It mostly consists of immature and undifferentiated cells. The term of “blastoma” is commonly used as part of the name for tumor as, for examples in glioblastoma and medulloblastoma (types of brain tumors), hepatoblastoma (a liver tumor), nephroblastoma (Wilms tumor of the kidney), neuroblastoma (a childhood tumor of neural origin), osteoblastoma (a bone tumor) and retinoblastoma (a tumor of the retina).
Carcinoma: Malignant out growth arising from epithelial cells is called as carcinoma. It has
the property to invade adjacent tissues and organs and may metastasize, or spread, to lymph nodes and other tissues.
Leukemia: Originates in tissues that form blood cells. It is cancer of the blood or bone
marrow (which produces blood cells). A person who has leukemia suffers from an abnormal production of blood cells, generally leukocytes (white blood cells).
Lymphoma: Lymphoma is a type of cancer that begins in immune system cells called
Myeloma: Multiple myeloma, also known as myeloma or plasma cell myeloma, is cancer of the plasma cells - a kind of white blood cell which is present in the bone marrow. It is a cancer of plasma cells that, thus, make excessive amounts of antibody (termed paraprotein or 'M' band).
Sarcoma: A sarcoma is a type of cancer that develops from certain tissues, like bone or
muscle. Sarcomas generally develop in soft tissues like fat, muscle, nerves, fibrous tissues, blood vessels, or deep skin tissues. They can be found in any part of the body. Most of them develop in the arms or legs. They can also be found in the trunk, head and neck area, internal organs, and the area behind the abdominal cavity.
CARCINOGENS
A carcinogen is anything that causes cancer in humans or animals. Carcinogens can be chemical or physical agents or radiation. A carcinogen is an agent that causes cancer and hence is mainly active during the initiation phase and possibly during promotion phase. These substances are directly involved in damaging DNA, encouraging or promoting cancer. 1,2 dimethylhydrazine (DMH), 2-amino-1-methyl-6-phenylimidazo[4,5-b] pyridine (PhIP), N, N- Dimethylnitroso urea (DEN) and N-nitrosomethyl urea (NMU) are known colon carcinogens. The fumes of the metals cadmium, nickel, and chromium are known to cause lung cancer. Carbon tetrachloride (CCl4) and Vinyl chloride cause hepatocellular carcinomas and liver sarcomas respectively. Ferric nitrilotriacetate (Fe-NTA) causes renal cancer, TPA causes skin cancer etc.
Physical Carcinogens
Physical carcinogens are highly variable in their chemical structure, and many of them are poorly understood. Those carcinogens include fibers, particulate matter, hard and soft synthetic materials and gels. Some physical carcinogens are naturally occurring, while others are synthetic. Furthermore, the method by which they because cancer is even more mysterious. No specific pathway has been isolated that correctly identifies the way physical agents cause cancer. No specific pathway as been isolated that appropriately identifies the way physical agents cause cancer. Most likely, cancer can be caused by a variety of different pathways. Most widely accepted mechanism of action of physical carcinogen is by attacking DNA and disturbing normal replication process.
More restrictively, however, the term is ordinarily used to define solid and gel materials, water-insoluble or slightly soluble, that are capable of producing cancer. Physical carcinogens include hard and soft materials, fibrous particles, non-fibrous particles, and gel materials]. The most well-known physical carcinogen is asbestos.
Chemical Carcinogens
metabolic pathways of activation and detoxication, although some reactive environmental chemicals can act directly. The basic biological action of a chemical leading to cancer is thought to be an attack on DNA, to produce a change that is not repaired by the body's DNA repair mechanisms, and which is then passed from cell to cell during division. Such heritable changes are known as 'mutations'. Alkylating agents interact directly with DNA and other macromolecules, but most carcinogens (PAHs, aromatic amines, etc.) do not do so until they undergone one or more metabolic changes to yield an 'ultimate carcinogen'.
Genotoxic Agents
Many chemicals other than known carcinogens have long been known to induce mutations in biological systems i.e., are “mutagens”. Recognition of the importance of metabolism of carcinogens to active agents suggested a close relationship between mutagens and carcinogens, and is the basis of many short-term tests (particularly the Ames bacterial test) being used as indicator of chemicals that may also be carcinogenic. Substances active in such tests are termed “genotoxic”. Genotoxic agents are a broad category of substances that induce changes to the structure or number of genes via chemical interaction with DNA and/or non-DNA targets. The term genotoxicity is generally used unless a specific assay for mutations is being discussed. Exposures to these genotoxicants cause carcinogenicity and embryogenecity.
Biological carcinogens
Certain viruses, fungals and bacteria are known to cause cancer in animals but role of these viruses and bacteria in genesis of the human cancer is still incomplete understood. It is difficult for the scientists to prove that viruses have a causative role in the human cancer. For example, 90 per cent cases of nasopharyngeal carcinoma are found to have antigens of Epstein-Barr virus (EBV). Further, Viruses of Hepatitis B and Hepatitis C are known to enhance risk of the hepatocellular carcinoma. Human immuno-deficiency virus (HIV) is associated with the non-Hodgkin’s lymphoma, Kaposi’s sarcoma and cancers of the cervix and the anus. Aflatoxin B1, which is produced by the fungus Aspergillus flavus growing on stored grains, nuts and peanut butter, is an example of a potent, naturally occurring microbial carcinogen.
STAGES OF CARCINOGENESIS
Studies of neoplasic pathogenesis are a complex process which can be divided into three distinct stages, from an operational point of view. These are: initiation, promotion and progression. The induction of neoplasia in rodents by chemical and physical agents involves a multistage process.
remaining balanced. During progression, this balance is modified and from there malignancy arises.
Figure 2: Chemical carcinogenesis stages and occurrences involved in each one
(Oliveira, P. A., Colaço, A., Chaves, R., Guedes-Pinto, H., De-La-Cruz, P., Luis, F., & Lopes, C. (2007). Chemical carcinogenesis. Anais da Academia Brasileira de Ciências, 79(4), 593-616.)
Human life is led under very different conditions from these experimental procedures. Although the process of carcinogenesis is similar for man and experimental animals, the different chemical compounds to which humans are exposed throughout their lives alter the speed of the process the frequency of mutation, the speed of cell growth and the phenotypical expression of the changed genes. On the other hand, the individual's susceptibility and their protective mechanisms have their own interaction, which modifies each of the neoplasic stages.
Initiation
Initiation is the first step in the two-stage model of cancer development. Initiators, if not already reactive with DNA, are altered (frequently they are made electrophilic) via drug-metabolizing enzymes in the body and are then able to cause changes in DNA (mutations). This is the first step of carcinogenesis and involves mutation of cellular DNA which in turn leads to activation of oncogene and inactivation of tumor suppressor genes. It usually consists of single gene mutation caused mostly by environmental genotoxic agent such as chemicals, radiations and viruses and is thought to be irreversible process. DNA adducts formation that causes either the activation of proto-oncogene or the in activation of a tumor-suppressor gene, can be categorized as tumor initiating event. Chromosomal translocation and gene amplifications can also activate these oncogenes. Emdad, (2005) reported that studies in human point towards the fact that carcinogenic process involves multiple genetic alterations in a staged fashion. The first stage of colon carcinogenesis (DMH) has been reported initiation since 1975 .
non-lethal, but heritable mutation. This initiating mutation may give the initiated cell the growth advantage needed in the second stage of promotion. In contrast to its surrounding cells, the initiated cell can escape the cellular regulatory mechanisms. It is kinetically and pharmacologically compatible with a simple mutational event, possibly involving as few changes as a single base alteration. Initiating agents include chemical, physical or biological agents which are capable of being converted directly or after metabolism to highly reactive metabolite, attacking and binding covalently to positively charged molecules of cellular components including DNA, RNA, proteins, thiols, and polysaccharides resulting in their structural distortion, mutation, translocation etc. Initiating agents and their metabolites are mutagenic to DNA. Thus, carcinogen administration at particular doses does not induce neoplasia but are capable of initiating cells in experimental models of multistage carcinogenesis (Figure 2).
Promotion
This stage is an epigenetic event and it involves the selective clonal expansion of the initiated cell through an increase in cell growth either through an increase in cell proliferation and/or a decrease in apoptosis in the target cell population. The events of this stage are dose dependent and reversible upon removal of the tumor promotion stimulus. The promoter is administered after initiation and cause enhancement of the neoplastic process. It is the process whereby an initiated tissue or organ develops focal proliferation and acts as precursors for subsequent steps in carcinogenesis. Promotion occupies the greater part of the latent period of carcinogenesis and can be divided into two steps: conversion and propagation. In the conversion step, the initiated cell is brought into an altered state so that its proliferative advantage over normal cells is expressed in the propagation step, which leads to the formation of a visible tumor. The biochemical responses to tumor promoters include increased synthesis of DNA, RNA, proteins, phospholipids and prostaglandins, increased phosphorylation of histone, increased activity of protein kinase C, histidine decarboxylase and protease. The essential feature of promotion is to develop mitogenic environment that imposes a differential effect on initiated cells without affecting surrounding cells. Promoters include agents such as various chemicals, drugs, plant products and hormones that do not directly interact with host cellular DNA but somehow influence the expression of genetic information encoded in the cellular DNA. Promoters are often specific for a tissue or species due to their interaction with receptors that are present in different amounts in different tissue types. (Figure 2)
Progression of Cancer:
carcinogenesis [23]. The concept of genetic instability implies that while environmental genotoxic agents generally cancer initiation, the additional new mutations required for neoplastic progression may be attributed to endogenous reactions and factors such as detoxifications and removal of damaged cells by programmed cell death. Genetic instability may happen due to the errors in DNA replication, spontaneous hydrolytic alterations of DNA such as depurination and deamination in combination with an impaired ability of premalignant cells to repair DNA damage or due to oxidative DNA damage. Modified DNA bases, especially 8-hydroxi-2’- deoxiguanosine, produced by oxygen free radical have been implicated in the genesis of cancer. Two possible mechanisms have been proposed for the induction of cancer. In one, an increase in DNA synthesis and mitosis by a non-genotoxic carcinogen may induce mutations in dividing cells through miss-repair. With continual cell division, mutations will result in an initiated preneoplastic cell that may clonally expand to a neoplasm. In addition, non-genotoxic agents may serve to stimulate the selective clonal growth of already “spontaneously initiated cells”. These changes contribute to tumor growth until conversion occurs, when the growing tumor grows malignant and possibly metastatic. (Figure 2)
TNF Alpha:
Tumors necrosis factor is a polypeptide cytokine involved in inflammation and proinflammatory cytokine and a powerful activator of immune responses of the innate immune system including cytokine production and activation, immune-cell proliferation, expression of adhesion molecules and induction of inflammatory processes. Originally, it was identified as a factor inducing tumors necrosis but shortly it was found that TNF-α have pro-tumoral functions. It is produced by immune cells such as macrophages, monocytes, NK cells, B- and T-cell and non-immune cells like fibroblasts, smooth muscle and tumor cells. Tumor necrosis factor-α (TNF-α) is a proinflammatory cytokine produced by a variety of cell types [46]. This soluble factor was first isolated from the serum of Bacillus-Calmette-Guerin-infected mice treated with endotoxin, and shown to replicate the ability of endotoxin to induce haemorrhagic tumour necrosis. It triggers cell proliferation, cell death, or inflammation through two distinct receptors: TNF receptor (TNFR) I and II .
pro-apoptotic pathway that is induced by binding caspase-8 to FADD; an anti-pro-apoptotic program that is activated by the binding of cellular inhibitor of apoptosis protein-1 (cIAP- 1) to TRAF2; AP-1 activation which is mediated through TRAF2 via a JNK-dependent kinase cascade; and NF-kB activation by RIP .
CHRONIC INFLAMMATION
Chronic inflammation is induced by biological, chemical, and physical factors and is in turn associated with an increased risk of several human cancers [55]. The fact that constant irritation over long periods of time can result in cancer had already been described in the traditional Ayurvedic medical system, written as far back as 5000 years ago[56]. Whether this irritation is the same as what Rudolf Virchow referred to as inflammation in the 19th century is uncertain [57]. This chronic inflammation is now considered as one of the culprit for diseases such as cancer. For example, inflammatory bowel diseases such as Crohn disease and ulcerative colitis are associated with increased risk of colon cancer and chronic pancreatitis is related to an increased rate of pancreatic cancer.
Chronic inflammation can be elicited by various stimuli and it enhances the risk of developing cancer. Such stimuli include microbial infections (for example, infection with Helicobacter pylori is associated with gastric cancer and gastric mucosal lymphoma), autoimmune diseases (for example, inflammatory bowel disease viz., crohn’s disease and ulcerative colitis is associated with colon cancer) and inflammatory conditions of unknown origin (for example, prostatitis is associated with prostate cancer). Consequently, treatment with non-steroidal anti-inflammatory agents (NSAIDs) decreases the incidence and the mortality that results from several types of tumour .
The hallmarks of chronic inflammation include the presence of inflammatory cells and inflammatory mediators (for example, chemokines, cytokines and prostaglandins) at the site of inflamed tissues, tissue remodelling and angiogenesis. These signs of chronic inflammation are also present in tumors, which supports the firm causal relationship between cancer and inflammation. Among the panoply of inflammatory mediators, TNF-α and NF-kB are the key factors involved in cancer-related inflammation [65]. In inflammatory cells as well as in cells at risk of transformation by carcinogens, NF-kB mediates the transactivation of genes encoding inflammatory cytokines (viz., TNF-α), anti-apoptotic factors (viz., BCL-2), cyclooxygenase-2 (COXBCL-2), inducible nitric oxide synthase (iNOS) and angiogenic factors.
OXIDATIVE STRESS AND CANCER
Recent published reports have shown vital role of reactive oxygen species in tumor development. ROS can be produced from endogenous sources, such as from peroxisomes, mitochondria and inflammatory cell activation and exogenous sources, including environmental agents, pharmaceuticals, radations and industrial chemicals.
mutation, and modulation of cell growth that ultimately leads to cancer. Some important sources of free radical formation are:
UV radiations, X-rays, gamma rays and microwave radiation.
Metal-catalyzed reactions.
Oxygen free radicals in the atmosphere considered as pollutants.
Inflammation initiates neutrophils and macrophages to produce ROS and RNS.
In mitochondria-catalyzed electron transport reactions, oxygen free radicals produced as by product.
ROS formed from several sources like mitochondrial cytochrome oxidase, xanthine oxidases, and neutrophils and by lipid peroxidation.
ROS generated by the metabolism of arachidonic acid, platelets, macrophages and smooth muscle cells.
Interaction with chemicals, automobile exhausts fumes, smoking of cigarettes, cigars, beedie.
Burning of organic matter during cooking, forest fires, volcanic activities.
Industrial effluents, excess chemicals, alcoholic intake, certain drugs, asbestos, certain pesticides and herbicides, some metal ions, fungal toxins and xenobiotics. Figure 5
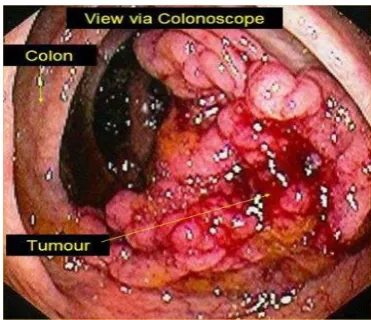
COLON AND CANCER
Figure 3: Different layers of the normal human colon. (Source: www.penncancer.org)
The colon cancer: Colorectal cancer (CRC) is the most common cause of cancer-related mortality, with an estimated over 1.2 million new diagnoses and 608,700 deaths worldwide . Outcomes for patients with advanced CRC remain poor, with the median survival of still less than 2 years. Colon cancer is a multistep process involving both epigenetic changes in signal transduction pathways and genetic alterations in oncogenes and tumor suppressor genes, resulting in progressive disregulation of cell proliferation and survival mechanisms. Colorectal cancer (CRC) is the third most common cancer in men (663,000 cases, 10.0% of the total cancers) and the second in women (570,000 cases, 9.4% of the total cases) worldwide. Colorectal cancer accounts for about a third of deaths related to chronic inflammation, polyps, ulcer, colitis and risk depends on disease duration. Crohn’s colitis is also associated with increased risk of colorectal cancer; the relative risk is similar to that for ulcerative colitis. (Figure 7)
Figure 1.8: colon cancer (Source: heallthinessbox.com)
p53 is a nuclear phosphoprotein of about 53 kDa implicated in the regulation of cell division and malignant transformation. p53 was first detected in rodent cells transformed with SV40. SV40 (Simian Virus 40) is a double stranded DNA tumor virus, replicates in permissive primate cells and transforms non-permissive rodent cells. Upon infection, it expresses a protein of 94 kDa, the large T antigen and a protein of 20.5 kDa, the small t antigen. These two proteins arise through alternate splicing from its early region. In SV 40 transformed cells, the levels of p53 is higher by fifty-fold. Apart from SV 40 transformed cells, elevated expression of p53 was detected in several chemically induced sarcomas, leukemias, spontaneously transformed fibroblasts and cells transformed with murine sarcoma virus and these observations formed the basis for the interest in understanding the function/association of p53 in cellular transformation.
Interaction of p53 with other proteins: The cellular protein p53 exists in monomeric form as well as high molecular weight oligomeric complexes. The p53 oligomers are disassembled into monomers in a calcium dependent manner by S 100b, a member of the S 100 protein family expressed during the late G 1 phas). Apart from SV 40 large T antigen, p53 interacts with several other virally coded proteins such as the large T antigens of BK, JC (names of the patients) and LPV (lymphotropic papovavirus) the adenovirus type 5 E1b-55 kDa protein and ~he E6 proteins of the human papilloma virus’s HPV -16 and HPV -18 Since, all these proteins are oncogene products, it was speculated that p53 might be in some way involved in the malignant transformation.
In normal cells, p53 associates with three protein kinases, namely the cdc-2 protein kinase casein kinase II and protein kinase C. MDM2, an oncoprotein, which is over expressed in sarcomas, was reported to associate with p53. In addition, two cellular proteins of 58 kDa and 80 kDa are reported to bind p53 in cells transfected with temperature-sensitive p53 and activated ras. However, the significance of these interactions is not yet known.
Several mutant p53 proteins have been shown to form high molecular weight complexes with the members of the 70 kDa heat shock protein (hsp70). The hsp70 proteins are molecular chaperones that help in the proper folding of other proteins. Since the mutated p53 exists in a different conformation compared to the normal p53, it is possible that hsp70, may play a role in the proper folding of the mutated p53 protein.
Expression of p53:
Messenger RNA level:
affect the stability of the GM-CSF mRNA (Granulocyte macrophage-colony stimulating factor) (Shaw and Kamen, 1986). However, as of now there is no evidence to support that the p53 mRNA stability is affected by this motif.
The mRNA levels of p53 are very low in normal cells except spleen. Elevated levels of p53 mRNA have been reported in actively dividing cells in vitro, in several transformed cells and in the undifferentiated embryonal carcinoma cell line F9 (Reich et al., 1983). Although more p53 mRNA is detected in spleen, the levels of the p53 protein present in the spleen is same as in other cells and this is due to decreased half life of the protein (t112 = 6 min) (Rotter, 1983). Increased levels of p53 mRNA have been observed during the mouse organogenesis (day 9-11) and during the embryonic development of chicken. However, mice deficient in p53 develop normally. Mouse lymphocytes stimulated by concanavalin A show increased p53 transcription which coincides with the transition from GO to S phase of the cell cycle. An antisense RNA, complementary to the first intron of the mouse p53, is involved in the maturation of the p53 mRNA during the induced differentiation of erythroleukmia cells.
MATERIALS AND METHODS
CELL CULTURE:
Autoclave:
Fill the water in the autoclaved chamber and pour it until the heater is completely immersed, then switch on the chamber.
Preheat it by closing the lid.
Meanwhile we need to keep the micro tip boxes (wrapped with paper or keep it in autoclaved covers), milliQ water for autoclaving.
All these should be kept in the autoclave and need to close the lid by keeping the safety valves open and lock the autoclave.
When uniform steam comes out we need to close the safety valve and wait until the pressure is build up.
Once it comes to the required pressure (15lb) maintain the pressure for 15minutes and turn off the autoclave.
Leave it till the pressure comes down and can open the lid and remove the autoclaved materials.
Caution:
Before entering in to the lab need to wear apron, face mask, gloves and head masks.
Wipe the hands and legs (foot) with Spirit.
Repeated washing with spirit avoids contamination.
Fumigation:
Then to a beaker add potassium permanganate powder (5gms) and dissolve in milliQ water.
Keep the beaker in the middle of the room and add formaldehyde (around 40ml) and immediately come out of the room.
Fumes are formed and fumes are due to formic acid.
HCHO + KMnO4 HCOOH + KMnO3 Formic acid (Fumes formed) Allow it to stand for 8hours and then remove the beaker from the room Neutralization:
Neutralization is carried out with ammonia.
In a beaker add 40ml of ammonia and leave it for 8hours.
After 8hrs remove the beaker and close the room
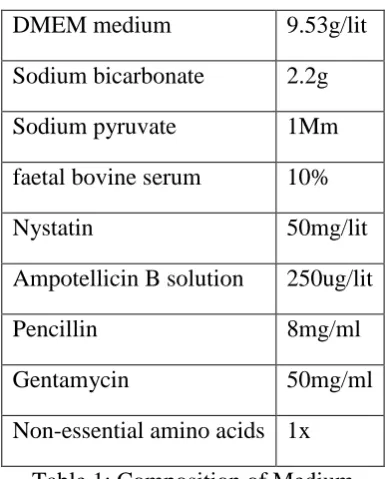
Composition of Medium:
DMEM medium 9.53g/lit
Sodium bicarbonate 2.2g
Sodium pyruvate 1Mm
faetal bovine serum 10%
Nystatin 50mg/lit
Ampotellicin B solution 250ug/lit
Pencillin 8mg/ml
Gentamycin 50mg/ml
Non-essential amino acids 1x
Table 1: Composition of Medium
Preparation of Medium:
In a beaker, add 9.53g of DMEM medium in 500ml of milliQ water and dissolve it completely.
Then add sodium bicarbonate and sodium pyruvate and dissolve it completely and adjust pH to 6.9 (6.9 to 7.1)
Make up the medium to 900ml with milliQ water.
When medium is about to use at that time need to add 10%FBS, non-essential amino acids and antibiotics in required amounts.
Splitting or Culturing the Cells:
Discard the medium from the flask and to the flask add 2ml of plain medium (without FBS) and after few minutes of vortexing, discard the medium.
Then add 1ml of Trypsin and EDTA to the flask and keep it in an incubator at 37°C for few minutes and we need to observe under microscope.
If the cells are circularize then immediately discard the trypsin solution into the flask.
To the flask add 2ml of medium (containing FCS) and flap the flask so that the adhere cells comes in to the solution.
Pour this solution in to a centrifuge tube and centrifuge at 1800rpm for 4 minutes.
Discard the supernatant and collect the pellet.
Dissolve the pellet in few ml of medium and make it to 5ml and keep the flasks in the CO2 incubator.
Cell Viability Test:
0.4% of Trypan blue is dissolved in phosphate buffered saline
10ul of the dye and 10ul of the sample solution is poured on to the eppendorf tube and need to mix once.
Pour the solution on to the slide and place the cover slip, observe under microscope.
Dead cells take up the dye where as live cells they can’t.
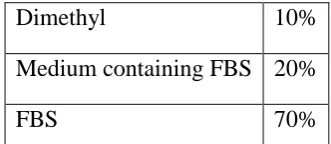
Composition of Preservation Medium:
Dimethyl 10%
Medium containing FBS 20%
FBS 70%
Table 2: Composition of Preservation Medium
RNA ISOLATION:
Principle:
RNA is present in living cells and many viruses which contain a single strand of Nitrogen bases like adenine, guanine, cytosine and Uracil bonded with phosphate and ribose sugars. It is also used in protein synthesis and carries genetic information in many viruses. The isolation of RNA is done by using Trizol Reagent. Trizol helps in maintaining RNA integrity during tissue homogenization and even cell disrupting and break down of cells. After addition of chloroform and centrifugation the solution separates into aqueous phase and organic phases. RNA remains only in the aqueous phase. After transferring the aqueous phase, RNA can be recovered by precipitation with isopropyl alcohol. But the DNA and proteins can recover by sequential separation after the removal of aqueous phase. Precipitation with ethanol requires DNA from the interphase, and an additional precipitation with isopropyl alcohol requires proteins from the organic phase. Total RNA extracted by Trizol Reagent is free from the contamination of protein and DNA.
Rinse the cells with ice cold PBS once. Lyse cells directly in a culture dish by adding 1 ml of TRIZOL Reagent per 3.5 cm diameter dish and scraping with cell scraper.
Pass the cell lysate several times through a pipette. Vortex thoroughly. The amount of TRIZOL reagent added is based on the area of the culture dish (1 ml per 10 cm2) and not on the number of cells present.
Shake vigorously and incubate at room temperature for 2-3 minutes.
Add 0.2 ml of chloroform per 1 ml of TRIZOL Reagent. Cap sample tubes securely. Vortex samples vigorously for 15 seconds and incubate them at room temperature for 2 to 3 minutes.
Centrifuge the samples at 14,000 rpm for 15 minutes.
Following centrifugation, the mixture separates into lower red, chloroform phase, an interphase, and a colorless upper aqueous phase. RNA remains exclusively in the aqueous phase. Transfer upper aqueous phase carefully without disturbing the interphase into fresh tube. Measure the volume of the aqueous phase.
RNA PRECIPITATION: Precipitate the RNA from the aqueous phase by mixing with
isopropyl alcohol. Use 0.5 ml of isopropyl alcohol per 1 ml of TRIZOL Reagent.
Incubate samples at -20˚C for 20 minutes and centrifuge at 14,000 rpm for 20 minutes. The RNA precipitate, often invisible before centrifugation, forms a gel-like pellet on the side and bottom of the tube.
RNA WASH: Remove the supernatant completely. Wash the RNA pellet once with 75%
ethanol, adding 1 ml of 75% ethanol per 1 ml of TRIZOL Reagent used for the initial homogenization. Mix the samples by vortexing and centrifuge at 8,000 rpm for 5 minutes. Remove all leftover ethanol.
REDISSOLVING RNA: Air-dry RNA pellet for 5-10 minutes. Do not dry the RNA
pellet by centrifuge under vacuum. Dissolve RNA in DEPC-treated water by passing solution a few times through a pipette tip.
AGAROSE GEL ELECTROPHORESIS:
Principle of Agarose Gel Electrophoresis:
Electrophoresis is a technique used to separate proteins and nucleic acids that differ in size and charge. When electricity is supplied charged molecules gets separated and they migrate towards either positive pole or negative pole based on their charge. Whereas for proteins they have either a net positive charge or net negative charge. Nucleic acids move to the negative charge because of their phosphate backbone and they migrate towards anode. Nucleic acids are electrophoresed with in the gel. The gel is made in the form of a thin slab and wells for loading the sample and the gel is kept in the electrophoresis buffer that provides buffers to maintain pH at a constant value.
Physical principle of Agarose Gel Electrophoresis:
strength of the field
size and shape of the molecules
relative hydrophobicity of the samples
Ionic strength and temperature of the buffer in which the molecules are moving.
To completely understand the separation of charged particles in gel electrophoresis, it is important to look at the simple equations relating to electrophoresis. When a voltage is applied across the electrodes, a potential gradient, E, is generated and can be expressed by the equation:
E = V/d
Where V, measured in volts, is the applied voltage and d the distance in cm between the electrodes.
When the potential gradient, E, is applied, a force, F, on a charged molecule is generated and is expressed by the equation:
F = Eq
Whereq is the charge in coulombs bearing on the molecule. It is this force, measured in Newtons that drives a charged molecule towards an electrode. There is also a frictional resistance that slows down the movement of charged molecules. This frictional force is a function of:
hydrodynamic size of the molecule
shape of the molecule
pore size of the medium in which electrophoresis is taking place
viscosity of the buffer
The velocity v of a charged molecule in an electric field is a function of the potential gradient, charge and frictional force of the molecule and can be expressed by the equation:
v = Eq / f (Where f is the frictional coefficient)
The electrophoretic mobility, M, of an ion can then be defined by the ion’s velocity divided by the potential gradient:
by the sample ions. The relationship between current I, voltage V, and resistance R is expressed as in Ohm’s law:
R = V / I
This equation demonstrates that for a given resistance R, it is possible to accelerate an electrophoretic separation by increasing the applied voltage V, which would result in a corresponding increase in the current flow I. The distance migrated will be proportional to both current and time. However, the increase in voltage, V, and the corresponding increase in current, I, would cause one of the major problems for most forms of electrophoresis, namely the generation of heat. This can be illustrated by the following equation in which the power, W, (measured in Watts) generated during the electrophoresis is equal to the product of the resistance times the square of the current:
W = I2
Since most of the power produced in the electrophoretic process is dissipated as heat the following detrimental effects can result:
an increased rate of diffusion of sample and buffer ions leading to broadening of the separated samples
formation of convection currents, which leads to mixing of separated samples;
thermal instability of samples that are rather sensitive to heat (e.g. denaturation of DNA)
A decrease of buffer viscosity hence a reduction in the resistance of the medium
REAL-TIME PCR FLUORESCENCE DETECTION SYSTEMS:
Real-time fluorescent PCR Chemistries
Figure 4: 5’nuclease Assay
Before PCR begins, the TaqMan probe is intact and has a degree of flexibility. While the probe is intact, the reporter and quencher have a natural affinity for each other, allowing FRET to occur
Figure 5: The FRET phenomenon.
A representation of Taq DNA polymerase. Each colored sphere represents a protein domain.
(A) FRET occurs when a green light emitting fluorescent dye is in close proximity to a red light emitting fluorescent dye. (B) FRET does not occur when the two fluorescent dyes are not in close proximity.
During PCR, the primers and probe anneal to the target. DNA polymerase extends the primer upstream of the probe. If the probe is bound to the correct target sequence, the polymerase’s 5’nuclease activity cleaves the probe, releasing a fragment containing the reporter dye. Once cleavage takes place, the reporter and quencher dyes are no longer attracted to each other; the released reporter molecule will no longer be quenched.
MELTING CURVE ANALYSIS:
Melting Curve Analysis and Detection Systems:
SYBR Green I or SYBR GreenER dye can be subjected to melting curve analysis. Dual-labeled
probe detection systems such as TaqMan probes are not compatible because they produce an irreversible change in signal by cleaving and releasing the fluorophore into solution during the PCR; however, the increased specificity of this method makes this less of a concern. The level of fluorescence of both SYBR Green I and SYBR GreenER dyes significantly increases upon binding to dsDNA. By monitoring the dsDNA as it melts, a decrease in fluorescence will be seen as soon as the DNA becomes single-stranded and the dye dissociates from the DNA.
Melting curve analysis and primer dimers
Primer-dimers occur when two PCR primers (either same sense primers or sense and antisense primers) bind to each other instead of to the target. Melting curve analysis can identify the presence of primer-dimers because they exhibit a lower melting temperature than the amplicon. The presence of primer-dimers is not desirable in samples that contain template, as it decreases PCR efficiency and obscures analysis. The formation of primer-dimers most often occurs in no-template controls (NTCs), where there is an abundance of primer and no template. The presence
of primer-dimers in the NTC should serve as an alert to the user that they are also present in reactions that include template. If there are primer-dimers in the NTC, the primers should be redesigned. Melting curve analysis of NTCs can discriminate between primer-dimers and spurious amplification due to contaminating nucleic acids in the reagent components.
RT-PCR CONDITIONS:
STEPS Temperature Time
Initial Denaturation 95ºC 3mins
Denaturation 95ºC 30Sec
Annealing 58ºC 40Sec
Extension 72ºC 1min30Sec
Final Extension 72ºC 10mins
Table 3: rt-pcr conditions
HT 29 Colon cancer cells and MRC-5 fibroblast cells were grown and RNA was isolated from the Cell lines.
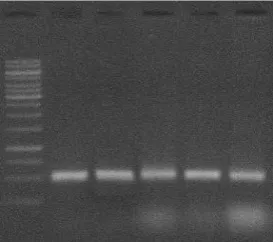
TOTAL RNA EXTRACTION:
Total RNA extraction was done by conventional Trizol method from MRC-5 fibroblast cells and HT 29 cell lines. Further the RNA confirmation was done by Agarose Gel Electrophoresis with 1% agarose concentration.
Figure 6: RNA Confirmation – Agarose Gel Electrophoresis: Lane 1: Marker: Lane
2,3,4,5,6 – MRC-5 Fibroblast cells:
Analyzing RNA isolated from samples, to evaluate purity & RNA samples details agarose gel electrophoresis was carried out using % Agarose µl & sample loaded on each cell and stained with E/Bv.
Figure 7: RNA Confirmation – Agarose Gel Electrophoresis: Lane 1: Marke: Lane 2,3,4,5,6 – HT 29 Cell lines.
With agarose gel electrophoresis procedure, the extraction of total RNA from both MRC-5 fibroblast cells and HT 29 cell lines was confirmed. Next step in the study is to estimate the RNA qualitatively and quantitatively using A260/A280 ratio in nanophotometer instrument.
QUALITATIVE AND QUANTITATIVE ESTIMATION OF TOTAL RNA:
Table 4: Quantitative Estimation of RNA in Nanophotometer of MRC-5 Fibroblast cells and HT-29 Cells
S.No. Sample A260/A280 Concentration (µg/µl)
2 HT 29 Sample 1 1.97 1.89
3 MRC-5 Sample 2 1.92 1.78
4 HT 29 Sample 2 1.88 1.68
5 MRC-5 Sample 3 2.01 1.74
6 HT 29 Sample 3 1.99 1.89
7 MRC-5 Sample 4 1.89 2.03
8 HT 29 Sample 4 1.06 1.82
9 MRC-5 Sample 5 1.78 2.87
10 HT 29 Sample 5 1.95 1.68
CONVERSION OF RNA TO CDNA:
The extracted total RNA was converted to cDNA by TAKARA cDNA Synthesis Kit.
These conversions of RNA to cDNA was confirmed by running a PCR setup using cDNA as template and GAPDH forward and reverse primers.
Figure 8: cDNA Synthesis: Agarose Gel Electrophoresis: Lane 1: Marker : Lane 2,3,4,5,6 : HT29 Cells.
Figure 9: cDNA Synthesis: Agarose Gel Electrophoresis: Lane 1: Marker : Lane 2,3,4,5,6 - MRC-5 fibroblast cells. Same as in the case of HT 29 cell lines, in case of MRC-5 fibroblast
cells also RNA got converted to cDNA as confirmed by the PCR.
QUANTITATIVE ESTIMATION OF CDNA:
After presence of RNA and conversion into cDNA was confirmed, cDNA was estimated quantitatively to know its concentration and to know the requirement of any dilutions of cDNA to attain appropriate concentration for RTPCR reaction.
Table 5: Quantitative Estimation of cDNA in Nanophotometer
S.No. Sample Concentration (µg/µl)
1 MRC5 Sample 1 1.97
2 HT 29 Sample 1 2.98
3 MRC5 Sample 2 1.07
4 HT 29 Sample 2 1.89
5 MRC5 Sample 3 2.67
6 HT 29 Sample 3 1.77
7 MRC5 Sample 4 0.96
8 HT 29 Sample 4 0.67
9 MRC5 Sample 5 1.23
10 HT 29 Sample 5 2.98
Each sample is diluted by adding 100µl of Rnase Free Water. The volume which corresponds to 100ng concentration is taken from each sample for RTPCR.
RTPCR ANALYSIS:
Table 6: Ct Values of MRC-5 and HT-29 Samples. Data are Mean ± S.E. (n = 3).
Sl.No Sample Ct values Ct values Ct values Mean±SD
2 HT 29 Sample 1 25.66 25.29 25.58 25.51±0.194 3 MRC-5 Sample 2 25.21 25.26 25.35 25.27±0.070 4 HT 29 Sample 2 23.02 23.55 23.46 23.34±0.283 5 MRC-5 Sample 3 22.95 22.76 22.65 22.78±0.151
6 GAPDH 20.60 19.7 20.94 20.14±0.420
Fig 10: p53 Gene Expression levels of MRC-5 and HT-29 Cells Table 11: Ct Values of MRC-5 and HT-29 Samples. Data are Mean ± S.E. (n = 3).
Sl.No Sample Ct values Ct values Ct values Mean±SD
Figure 12: p53 Gene Expression levels of MRC-5 and HT-29 Cells p53 gene expression were more in HT29 Cell lines when compared to MRC cell lines
DISCUSSION
Over the past decade, numerous studies have demonstrated that the neo-vascularity of tumors correlates with aggressiveness and metastatic potential. Several laboratories, including our own, have demonstrated that microvessel counts are strong prognostic factors in human colorectal cancer. Previous studies demonstrating that VEGF expression correlates with microvessel count suggest that VEGF may be involved in regulating human colon cancer angiogenesis. Other studies have demonstrated the importance of VEGF in the growth and metastasis of human colon cancer; e.g., neutralizing VEGF antibodies given to mice bearing human colon cancer xenografts decreases tumor growth and inhibits experimental metastasis formation. It appears that VEGF is one of the critical factors in determining the angiogenic phenotype in a majority of human colon cancers.
immuno-histochemical techniques, which indirectly represents expression of the mutated p53 protein, is associated with VEGF expression and, in turn, angiogenesis.
Our studies show that the immuno-histochemical detection of p53 in human colon cancer specimens is associated with a higher VEGF expression than in tumors in which p53 is not detectable. Furthermore, the intensity of staining of p53 protein in tumor specimens significantly correlated with expression of VEGF. Likewise, vessel counts in p53-positive tumors were significantly higher than in p53-negative tumors: vessel counts correlated with VEGF expression as well. Although there was no correlation between p53 positivity and stage of disease, expression of VEGF was higher in metastatic tumors than in non-metastatic tumors. Lastly, a correlation existed between p53 positivity, VEGF expression, and vessel count.
Our data support an association between p53 mutations, VEGF expression, and angiogenesis in human colon cancer. Other studies on human cancer specimens have examined simultaneously p53 expression and angiogenesis. Vermeulen et al. (1996) demonstrated an association between p53 protein over-expression and microvessel density in human colorectal cancers. However, this study did not address expression of any of the angiogenic factors thought to be regulated by p53. Gasparini et al. (1994) examined tumor specimens from 254 patients with node-negative breast cancer and found that both p53 expression and microvessel density were independent prognostic factors. However, this study did not examine whether a direct relationship existed between p53 expression and vessel counts. In another study by Gasparini et al. (1993), p53 expression and vessel counts immuno-histochemically determined in tumor specimens from patients with squamous cell carcinoma of the head and neck were associated significantly. Thus, others have provided preliminary evidence of an association between p53 mutations and an angiogenic response.
In the present study, P53 gene expression levels are checked in both colon cancer cell line and corresponding normal cell line. This was done by first isolating total RNA and conversion into cDNA. Using this cDNA for Real Time PCR, analysis was done. In result, it was observed that there is a considerable decrease in P53 gene expression in colon cancer cell line when compared to the normal cell line. With the present work, it is evident that mutations in P53 gene results in its expression leading to various types of cancer including colon cancer.
Reference
1. Cotter TG, (2009). Apoptosis and cancer: the genesis of a research field Nat. Rev. Cancer, 9 pp. 501–507.
2. Tan TT, White E,(2008).Therapeutic targeting of death pathways in cancer: mechanisms for activating cell death in cancer cells Adv. Exp. Med. Biol., 615 pp. 81–104.
3. Rao CV, Patlolla JM, Cooma I, et al.,(2013).Prevention of Familial Adenomatous Polyp Development in APC(min) Mice and Azoxymethane-Induced ColonCarcinogenesis in F344 Rats by ω-3 Fatty Acid Rich Perilla Oil. Nutr Cancer. 65 Suppl 1:54-60.
5. Boveri T, (1902). U¨ ber mehrpoligeMitosen alsMittel zur Analyse des Zellkerns. Verh. D. Phys. Med. Ges. 35:67–90.
6. Fearon ER, Vogelstein BA, (1990). genetic model for colorectal tumorigenesis. Cell, 61: 759–767.
7. Eizirik DL, Pavlovic D, (1997). Is there a role for nitric oxide in beta-cell dysfunction and damage in IDDM? Diabetes Metab Rev. 13(4):293-307.
8. Bolton WE, Mikulka WR, Healy CG, et al., (1992). Expression of proliferation associated antigens in the cell cycle of synchronized mammalian cells. Cytometry. 13(2):117-26. 9. Lee SJ, Lim KT, (2007). Inhibitory effect of phytoglycoprotein on tumor necrosis factor
alpha and interleukin-6 at initiation stage of colon cancer in 1, 2-dimethylhydrazine-treated ICR mice. Toxicol Appl Pharmacol;225:198–205.
10. Azzolina A, Bongiovanni A, Lampiasi N, (2003). Substance P induces TNF-alpha and IL-6 production through NF kappa B in peritoneal mast cells. Biochim Biophys Acta. 1IL-643: 75–83.
11. Mohan S, Epstein JB, (2003). Carcinogenesis and cyclooxygenase: the potential role of COX-2 inhibition in upper aerodigestive tract cancer. Oral Oncol. 39(6):537-46.
12. Tokunaga T, Oshika Y, Abe Y, et al., (1998).Vascular endothelial growth factor (VEGF) mRNA isoform expression pattern is correlated with liver metastasis and poor prognosis in colon cancer.Br J Cancer. 77(6): 998–1002.
13. Marenholz I, Heizmann CW, Fritz G, (2004). S100 proteins in mouse and man: from evolution to function and pathology (including an update of the nomenclature). Biochem Biophys Res Commun. 322(4):1111-22.