Environment for Industrial Using Zigbee Technology
Prof.
Rollakanti Raju
1& N.
Amulya
2𝐑. 𝐑𝐀𝐉𝐔𝟏*
, [email protected] N Amulya2*, [email protected]
Professor, Electronics & Communication Engineering, MLRITM, Hyderabad, Telangana, India
Abstract—
In our daily activities, controlling and monitoring plays a vital role and it helps the end user to decide what to and what not to do for making the attempt successful. In this paper, sensors are the key elements which collect the data from surrounding and upload it to the web server. End user will monitor it from a simple customized web page with a login. ARM processor with Laptop/PC through ZIGBEE is used for logging the data into the server. Sensors used in this paper for prototype were Temperature Sensor, Light Sensor, and a Gas Sensor interfaced with ARM processor at analog port. Python API is used in the laptop for sending the data captured by the laptop’s serial port into the web server.
Keywords— Python API; ARM Processor; Web Data; Internet of Things
I. INTRODUCTION
Now-a-days, controlling and monitoring plays a main role in our day to day life. Everything we can control using advanced technologies and we can also monitoring the things we need. Now we can control and monitor anywhere using Internet of things. If you have Internet in your PC/Mobile you can directly upload the data you needand control it from internet itself.
The Internet of Things (IoT) is the network of physical objects or "things" embedded
with electronics, software, sensors and
connectivity to enable it to achieve greater value and service by exchanging data with the manufacturer, operator and/or other connected
devices. Each thing is uniquely identifiable through its embedded computing system but is able to interoperate within the existing Internet infrastructure.
ThingSpeak is an open source Internet of Things application and API is to store and retrieve data from things using HTTP (Hyper Text Transfer Protocol) over the internet or via a local area network. With ThingSpeak, you can create sensor logging applications, and social network of things with status updates.
In addition storing and retrieving numeric and alphanumeric data, the ThingSpeak API allows for numeric data processing such as time scaling, averaging, median, summing, and rounding. Each ThingSpeak channel supports data entries of up to 8 data fields, latitude, longitude, elevation, and status. The channel feeds support JSON, XML, and CSV formats for integration into applications.
The ThingSpeak application also features time zone management, read/write API key management and JavaScript-based from Highslide software
In this proposed solution, mainly three sensors are the key elements which collect the data from
surrounding and upload it to webserver . End
II. SYSTEMARCHITECTURE
The system architecture of this proposed system is divided into two different blocks.
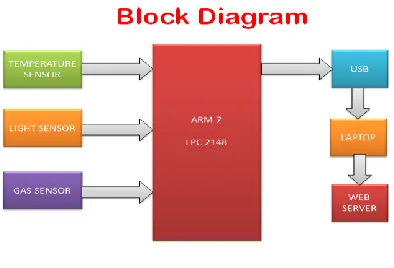
ARM7 END: Hardware implementation for this proposed system is shown below with the simple blocks. Power Supply block is designed and developed to generate power source for the ARM processor and its relevant components. Reset Circuit is designed and developed to reset the program whenever necessary and interfaced to the ARM processor for greater stable response. Clock Circuit is designed and developed to generate oscillationsand interfaced to the ARM processor for needy response. LCD Display can also interface to the ARM processor for displaying the status of the system for better understanding. A simple block diagram shown below:
Figure – 1: Block Diagram
SERVER END: A WEB SERVER is designed and developed for collecting the data from surroundings through Sensors and upload it in to web server. Manual UI is designed for understanding of process with the help of HTML and PYTHON. Using the concept of Internet of Things we are uploading the each individual sensor values to the web server, where We can monitor the sensor values.
III.IMPLEMENTATION
HARDWARE:
In hardware implementation, ARM processor plays a key role in monitoring and controlling the security system. Low-power consumption ARM processor (LPC2148) operating at 3.3V, 50uA is
designed and mounted on a PCB along with Reset Circuit and a Clock Circuit. LPC2148, a 32-bit
Microcontroller with advanced RISC
architecture and having 48 GPIO lines with a program memory of 32KB and a data memory of 512Bytes.
Figure – 2: ARM Overview [LPC2148]
Figure – 3: LPC2148 Development Board
Temperature Sensor: The Temperature sensor (LM 35) is interfaced at ARM7. LM35 series are
precision integrated-circuit temperature. The
The LM35’s low output impedance, linear output, and precise inherent calibration make interfacing to readout or control circuitry especially easy. It can be used with single power supplies, or with plus and minus supplies. As it draws only 60 μA from its supply, it has very low self-heating, less than 0.1°C in still air. The characteristics of LM35 sensor shown below:
Figure – 4: LM35 characteristics
For each degree of centigrade temperature it outputs 10 milli volts.
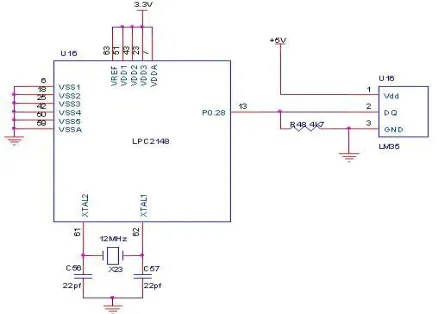
In this project I’ve connected LM35 at P0.27 pin of ARM7 (LPC 2148). The output of LM35 would be in the form of Analog, to convert analog to digital I’ve used ADC. The output of LM35 given to the ADC and the output of ADC is in the form of digital. This output has given to the ARM7 and to the webserver through PC/Laptop.
The connection between ARM7 and LM35 shown below:
Figure – 5: LM35 interfaced to LPC 2148
LDR (Light Dependent Resistor): The LDR sensor
is very useful especially in light/dark sensor circuits. Normally the resistance of an LDR is very high, sometimes as hifh as 1,000,000 ohms, but
when they are illuminated with light, the resistance drops dramatically. The LDR sensor is shown below:
Figure – 6: Light Dependent Resistor Sensor
In this project, LDR has used in a switching the lights based on the intensity of light, i.e. if the intensity of light is high, then the lights will be in OFF condition, if the intensity of light is less, then the lights will be in ON condition. However, when light shines onto the LDR its resistance falls and current flows into the base of the first transistor and then the second transistor. The circuit connection of LDR is shown below:
Figure –7: LDR Sensor Circuitry
Gas Sensor (MQ-2): Sensitive material of MQ-2
Propane and Hydrogen, also could be used to Methane and other combustible steam, it is with low cost and suitable for different application. Configuration of Gas sensor is shown below:
Figure – 8: Gas Sensor Configuration
Respected technical data also shown below:
Figure –9: MQ-2 Technical Data
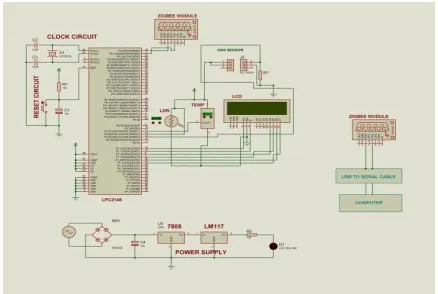
All Sensors connected to ARM7 (LPC 2149) as per the following schematic diagram:
Figure – 10: Schematic Diagram
LDR sensor connected at P0.28 of ARM7 (LPC 2148), LM35 sensor has connected at P0.27 of ARM7 (LPC 2148) and Gas sensor connected at P0.29 of ARM7. Reset Circuit and Clock Circuits were interfaced at RST, XTAL1, and XTAL2 of LPC2148.
SOFTWARE:
Here, to program ARM processor Keil uVision 4 was used as a cross-compiler and Flash Magic was used as a programmer. ThingSpeak is an open source Internet of Things application and API to store and retrieve data from things using HTTP over the internet or via a local area network.
ALGORITHM & FLOWCHART
ALGORITHM:
Step – 1: Initialize ARM, LCD and UART.
Step – 2: Wait until you see WELCOME on LCD.
Step – 3: You see three sensors default values.
Step – 4: Wait until sensors values have been changed.
Step – 5: Now login to ThingSpeak and Create channel and fields.
Step – 6: Now open the Python Program and run main.py, when sensors values changed then you can see the graph of sensors.
Step – 7: you can see sensors values in ThingSpeak until power supply on.
FLOWCHART:
The flowchart of this paper has shown below:
Figure – 11: Flow Chart
IV.RESULTS
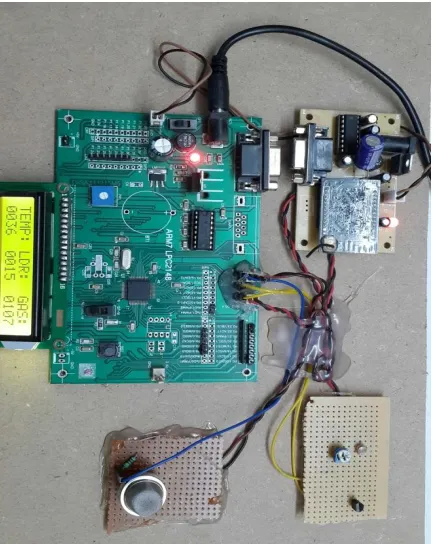
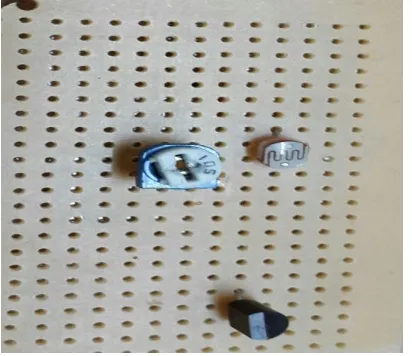
Figure – 12: Final Prototype – 1
Figure – 13: Sensor Data
Figure – 15: Light and Temperature Sensors
Figure – 16: Server Login
Figure – 17: Sensors Data 1
Figure – 18: Sensors Data 2
V. CONCLUSION
An Internet of Things Controlled Sensor Node is designed and proposed as an alternative to Wireless Sensor Node. Low cost IOTSN is proposed and developed.
ACKNOWLEDGEMENT
I would like to express my special thanks of
gratitude to Prof. RollakantiRaju,K. N.
BHUSHAN, Assoc. Prof & HOD ECE, Marri Laxman Reddy Institute of Technology& Managementas well as our Principal Dr. K Venkateswara Reddy, M. Tech., Ph.D., MISTE,who gave me the golden opportunity to do this wonderful project on the topic (Internet of Things), which also helped me in doing a lot of Research and i came to know about so many new things we are really thankful to them. And, secondly i would also like to thank my parents and friends who helped me a lot in finalizing this project within the limited time frame.
REFERENCES
[1]
[2]https://www.pantechsolutions.net/microcontroll
er-boards/user-manual-arm7-lpc2148-development-kit
[3] http://www.nex-robotics.com/lpc2148- development-board/arm7-lpc2148-development-board.html
[4]http://www.futurlec.com/Philips/LPC2148FBD 64pr.shtml
[5]http://www.ti.com/product/lm35
[6]http://www.digikey.com/catalog/en/partgroup/l m35/11023?WT.srch=1&mkwid=sUTk75Oa8&pcr id=73168693384&pkw=_cat%3Adigikey.com&p mt=b&pdv=c
[7]http://www.facstaff.bucknell.edu/mastascu/eless onsHTML/Sensors/TempLM35.html
[8]https://en.wikipedia.org/wiki/Photoresistor
[9]https://en.wikipedia.org/wiki/Gas_detector
[10]http://www.codeproject.com/Articles/845538/ An-Introduction-to-ThingSpeak
BIOGRAPHY
Prof. Rollakanti Raju, assistant professor in the department of electronics and communication engineering at MLRITM College. He received B.E from AndhraUniversity and M.Tech from JNTU ANANTHAPUR in DSCE.He is pursuing Ph.D in the area of VLSI from JNTUH .He has guided over 50 projects.
N.Amulya, received her bachelor's degree in electronics and
communication engineering from Srideviwomens