O R I G I N A L A R T I C L E
Insulin resistance and beta-cell function in different ethnic groups
in Kenya: the role of abdominal fat distribution
D. L. Christensen•D. Faurholt-Jepsen •
K. Faerch•D. L. Mwaniki •M. K. Boit•
B. Kilonzo• I. Tetens• H. Friis•K. Borch-Johnsen
Received: 15 January 2013 / Accepted: 25 March 2013 / Published online: 7 April 2013 ÓSpringer-Verlag Italia 2013
Abstract Little is known about the pathophysiology of diabetes in Africans. Thus, we assessed whether insulin resistance and beta-cell function differed by ethnicity in Kenya and whether differences were modified by abdom-inal fat distribution. A cross-sectional study in 1,087 rural Luo (n =361), Kamba (n=378), and Maasai (n =348) was conducted. All participants had a standard 75-g oral glucose tolerance test (OGTT). Venous blood samples
were collected at 0, 30, and 120 min. Serum insulin was analysed at 0 and 30 min. From the OGTT, we assessed the homoeostasis model assessment of insulin resistance by computer model, early phase insulin secretion, and dispo-sition index (DI) dividing insulin secretion by insulin resistance. Abdominal subcutaneous adipose tissue (SAT) and visceral adipose tissue (VAT) thickness were carried out by ultrasonography. Linear regression analyses were done to assess ethnic differences in insulin indices. The Maasai had 32 and 17 % higher insulin resistance than the Luo and Kamba, respectively (p\0.001). Early phase insulin secretion was 16 % higher in the Maasai compared to the Luo (p\0.001). DI was 12 % (p =0.002) and 10 % (p =0.015) lower in the Maasai compared to the Luo and Kamba, respectively. Adjustments of SAT (range 0.1–7.1 cm) and VAT (range 1.5–14.2 cm) largely explained these inter-group differences with the Maasai having the highest combined abdominal fat accumulation. The Maasai had the highest insulin resistance and secre-tion, but the lowest relative beta-cell function compared to the Luo and Kamba. These differences were primarily explained by abdominal fat distribution.
Keywords Insulin resistanceInsulin secretion EthnicityObesity
Abbreviations
DI Disposition index
HOMA2-IR Homoeostasis model assessment of insulin resistance by computer model
IFG Impaired fasting glucose IGT Impaired glucose tolerance OGTT Oral glucose tolerance test
SAT Abdominal subcutaneous adipose tissue VAT Visceral adipose tissue
Communicated by Guido Pozza.
D. L. Christensen (&)
Department of International Health, Immunology, and Microbiology, University of Copenhagen, Øster Farimagsgade 5, 1014 Copenhagen, Denmark
e-mail: [email protected]
D. L. ChristensenK. Faerch
Steno Diabetes Center, Gentofte, Denmark
D. Faurholt-JepsenH. Friis
University of Copenhagen, Frederiksberg, Denmark
D. L. MwanikiB. Kilonzo KEMRI, Nairobi, Kenya
D. L. Mwaniki
Family Health International, Nairobi, Kenya
M. K. Boit
Kenyatta University, Nairobi, Kenya
I. Tetens
Technical University of Denmark, Søborg, Denmark
K. Borch-Johnsen
Introduction
In sub-Saharan Africa, the total number of individuals with diabetes was 14.7 million (3.8 %) in 2011, and this number is expected to increase to 28 million (4.3 %) by 2030 [1]. We recently found an age-stan-dardized diabetes prevalence of 2.2 % among rural Kenyans [2]. Moreover, prediabetes seems to be pri-marily caused by impaired glucose tolerance (IGT) rather than impaired fasting glucose (IFG) in this population [2]. Despite the substantial increase in the number of people with diabetes, studies focusing on the pathophysiology of diabetes among native African subjects have been limited, whether in basic, clinical, or epidemiological settings [3–7]. Thus, our knowledge of insulin resistance and beta-cell dysfunction, both considered the hallmark of type 2 diabetes, is limited in African populations despite the fact that such knowl-edge would be important for prevention and treatment for type 2 diabetes.
Several studies have shown that obesity [8] and central fat distribution [9, 10] is associated with an increased risk of metabolic dysfunction including type 2 diabetes. Furthermore, accumulation of visceral adi-pose tissue (VAT) causes insulin resistance to a much higher degree than accumulation of subcutaneous adi-pose tissue (SAT) [11], possibly due to the lipolytic properties of VAT causing an increase in circulating free fatty acids, resulting in ectopic fat accumulation and lipotoxicity mainly in the liver and the skeletal muscle [12, 13].
Ethnicity defined as a combination of shared bio-logical heritage (genes) and lifestyle such as dietary intake may influence endocrinological function, that is, pancreatic beta-cell insulin secretion and whole body insulin sensitivity. We have recently shown in rural Kenyans of different ethnic origin that the dietary intake of the agro-pastoralist Maasai is twice as high in fat compared to the agro-fishing Luo and agricultural Kamba (30 vs. 15E%) [14]. Furthermore, the Maasai had a higher VAT accumulation compared to the Luo and the Kamba, which indicates ethnic differences in body composition [15]. These differences could influ-ence ectopic fat accumulation, and thereby key organs of insulin action.
The current study investigates the combined effects of obesity and central fat distribution on insulin resis-tance and beta-cell function in rural African popula-tions. Thus, the aim was to study the differences in insulin resistance and beta-cell function between three distinct ethnic groups in rural Kenya and assess to what extent such differences were modified by abdominal fat distribution.
Research design and methods
Study population
A cross-sectional study was conducted among the Luo, Kamba, and Maasai, chosen to represent societies of agro-fishing, agriculture, and agro-pastoralism, respectively. The study was carried out in the districts of Bondo (the Luo), Kitui (the Kamba), and Transmara (the Maasai). The study participants were randomly selected at weekly village meetings (n=648), and non-randomly volunteers (n =91), respectively among the Luo and Kamba. All adult Maasai within a radius of 20 km from the study site were invited to participate. The participants consisted of a mixture of rural and semi-urban individuals. All resided in rural villages, but some commuted regularly to the nearest town for business and were thus exposed to an urban lifestyle. A more detailed account of the selection proce-dure and the study participants has been presented else-where [15]. Individuals with known diabetes (n=16) were not included in the study. All participants gave written or oral informed consent. Ethical approval was given by the National Ethical Review Committee in Kenya, and con-sultative approval was given by the Danish National Committee on Biomedical Research Ethics in Denmark. Anthropometry
With the participants wearing undergarments, weight was measured to the nearest 0.1 kg using a portable high pre-cision scale (Tanita, type BWB-800S MA, Tokyo, Japan), and height was measured twice to the nearest 0.1 cm with a portable stadiometer (Meterex II, D97, UNICEF, Copen-hagen, Denmark). Body mass index (BMI) was calculated as weight/height2(kg/m2). Waist circumference was mea-sured to the nearest 0.5 cm with a body tape midway between the iliac crest and the costal margin following a quiet expiration with the participant standing. Abdominal subcutaneous adipose tissue (SAT) thickness and visceral adipose tissue (VAT) thickness were measured using ultrasonography (Aquila Basic Unit, Esaote, Pie Medical Equipment, Maastricht, the Netherlands) with a 3.5/ 5.0 MHz transducer (Probe Article no. 410638 Curved Array HiD probe R40 Pie Medical Equipment, Maastricht, the Netherlands). Trained staff carried out the measure-ments according to the validated method by Stolk et al. [16]. Blood samples
method using haemolysation and deproteinization on a HemoCue 201?device (HemoCue AB, A¨ ngelholm, Swe-den) with 5ll of blood. Glucose tolerance status was classified according to World Health Organization criteria [17]. Diabetes was diagnosed based on fasting venous whole blood glucose C6.1 mmol/l or 2-h venous whole blood glucose C10.0 mmol/l. Prediabetes was defined as impaired fasting glycaemia (IFG), impaired glucose toler-ance (IGT), and combined IFG/IGT. The values for IFG were fasting venous glucose of C5.6 and\6.1 mmol/l as well as 2 h\6.7; the values for IGT were fasting venous glucose\5.6 mmol/l and 2-h venous glucose C6.7 and \10.0 mmol/l. Values for combined IFG/IGT were fasting venous glucose ofC5.6 and\6.1 mmol/l and 2-h venous glucose C6.7 and \10.0 mmol/l. The remaining blood samples were kept on ice before serum was separated by centrifugation and subsequently kept at -80°C until analysis was performed. Serum insulin was measured by a 1235 AutoDELFIA automatic immunoassay system (sen-sitivity 0.5lU/ml) using time-resolved fluoro-immunoas-say technique (kit no. BO80-101, PerkinElmer Life and Analytical Sciences, Wallac Oy, Turku, Finland).
Measures of insulin resistance and beta-cell dysfunction We calculated insulin resistance by the homoeostasis model assessment of insulin resistance by computer model (HOMA2-IR) [18]. Based on Stumvoll et al. [19], we estimated early phase insulin secretion as fol-lows: 1.283?1.8299insulin 30 min -138.79 glu-cose 30 min? 3.7729insulin 0 min. We calculated disposition index (DI) by dividing early phase insulin secretion by HOMA2-IR.
Statistical analysis
Statistical analyses were done with the Stata 11.2 Intercooled version (Stata Corp, College Station, USA). All analyses on absolute values were stratified by ethnicity. Continuous variables were tested for normality using normal probability plots. Skewed data were log-transformed prior to analysis. Inter-group differences were determined by the Bonferroni– Dunn post hoc test. Thev2test was used to test for differences
in proportions. Linear regression models were used to assess the role of ethnicity on the log-transformed insulin indices HOMA2-IR, early phase insulin secretion and DI in models adjusted for age and sex (model 1), age, sex, and SAT (model 2), and age, sex, and VAT (model 3). Numbers shown were exponential of thebvalue (ExpB) and should thus be inter-preted as the relative differences between the ethnic groups. By including an interaction term in the analyses, we tested whether SAT or VAT modified the relationships between ethnicity and insulin indices.
Results
In total, 1,155 adult Kenyans were recruited for the study. Of these, 68 had either missing (n=60) or ineligible (n =8) insulin and glucose data. Thus, 1,087 participants (94.1 %) with a mean age (SD) of 38.5 (10.3) years (range 17–68 years) of both sexes (61.4 % females) participated in the study. The ethnic distribution was 361 (33.2 %) Luo (201 females, 160 males), 378 (34.8 %) Kamba (284 females, 94 males), and 348 (32.0 %) Maasai (182 females, 166 males). No differences were found in age, sex distri-bution, BMI, or blood glucose measurements between the randomly and non-randomly selected participants (data not shown).
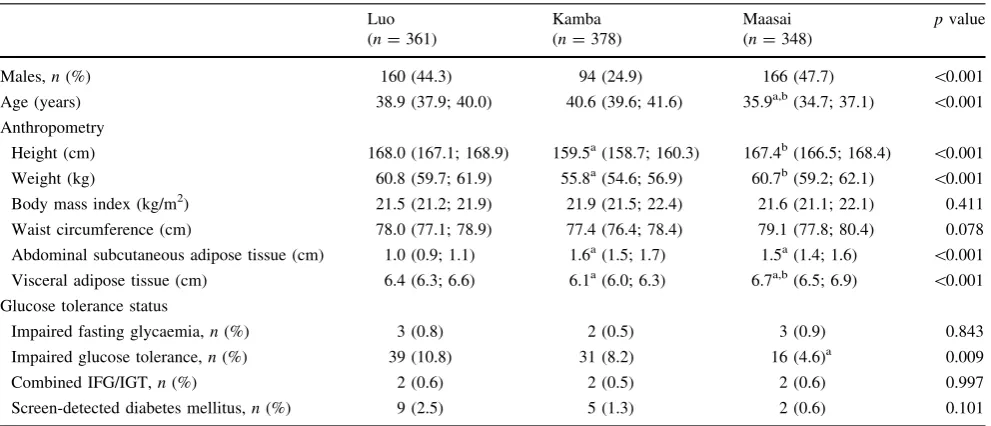
As previously reported [2], eight (0.7 %) participants had IFG, 86 (7.9 %) participants had IGT, 6 (0.6 %) par-ticipants had combined IFG/IGT, and 16 (1.5 %) partici-pants had screen-detected diabetes. Characteristics of anthropometry and glucose tolerance status stratified by ethnic group and including sex, age, and anthropometric measurements as well as the distribution of IFG, IGT, and screen-detected diabetes are presented in Table1.
Data on glucose, insulin, insulin resistance and beta-cell function are shown in Table2. The Luo had the highest venous blood glucose levels at 120 min and the lowest insulin levels at 0 and 30 min.
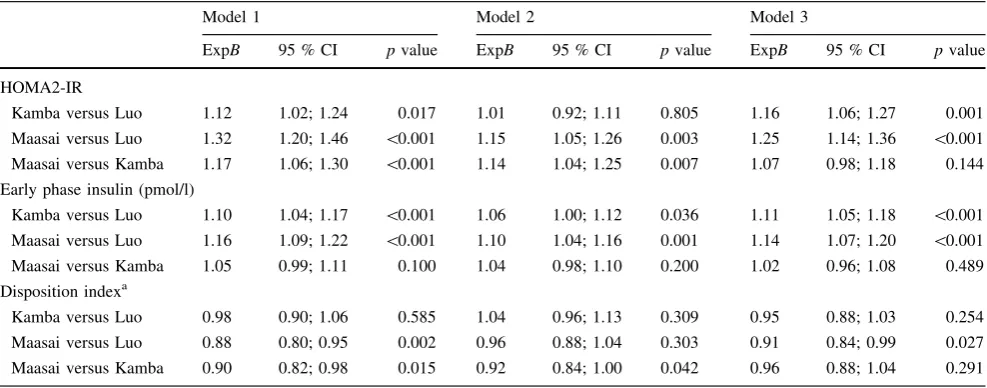
Linear regression analysis was used to assess the asso-ciation between ethnicity and HOMA2-IR, early phase insulin secretion and DI (Table3). In a linear regression model adjusted for age and sex (model 1), the Maasai had 32 and 17 % (p\0.001) higher HOMA2-IR compared to the Luo and the Kamba, respectively. After adjustment for SAT, the difference between the Maasai and the Luo was reduced by 17 % (model 2). Following adjustment for VAT (model 3) the Maasai versus Luo difference was 25 % (p\0.001) and the Maasai versus Kamba difference 7 % and insignificant (p=0.144).
The Maasai had 16 % higher (p\0.001) early phase insulin secretion than the Luo in model 1. In model 2, the difference decreased by 6 %. In model 3, the Maasai had 14 % (p\0.001) higher early phase insulin secretion compared to the Kamba.
The Maasai had 12 % (p=0.002) and 10 % (p =0.015) lower DI compared to the Luo and Kamba in model 1. When adjusted for SAT, the Maasai versus Luo difference was reduced to 4 % (p=0.303) (model 2), and the difference between the Maasai and Kamba was reduced to 4 % (p=0.291) when adjusted for VAT (model 3).
from the analyses in order to determine the association between ethnicity and the insulin indices in normal glucose tolerance individuals. The results did not differ from those shown in Table3 (results not shown).
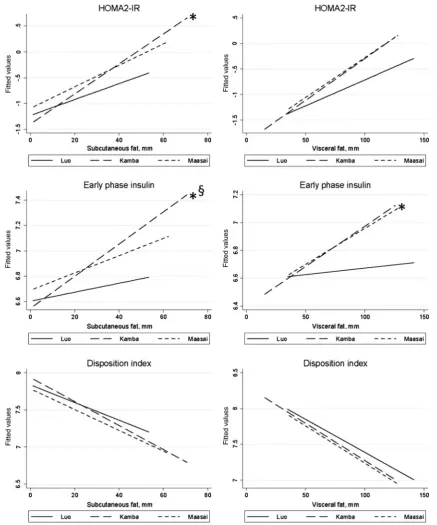
In order to establish to what extent the differences in insulin resistance and beta-cell dysfunction were driven by obesity in the ethnic groups, analyses of interactions between ethnicity and SAT as well as ethnicity and VAT
with the three insulin indices were carried out (Fig.1). A significant interaction (p\0.05) between ethnicity and SAT on HOMA2-IR was found between Kamba versus Luo. Likewise, significant interactions between ethnicity and SAT on early phase insulin secretion were found between Kamba versus Luo and Maasai versus Kamba. VAT9ethnicity interactions on early phase insulin secretion were found in Maasai versus Luo (p\0.05). Table 1 Characteristics of anthropometry and glucose tolerance status by ethnic group in adult Kenyans (n=1,087)
Luo (n=361)
Kamba (n=378)
Maasai (n=348)
pvalue
Males,n(%) 160 (44.3) 94 (24.9) 166 (47.7) \0.001
Age (years) 38.9 (37.9; 40.0) 40.6 (39.6; 41.6) 35.9a,b(34.7; 37.1) \0.001
Anthropometry
Height (cm) 168.0 (167.1; 168.9) 159.5a(158.7; 160.3) 167.4b(166.5; 168.4) \0.001
Weight (kg) 60.8 (59.7; 61.9) 55.8a(54.6; 56.9) 60.7b(59.2; 62.1) \0.001
Body mass index (kg/m2) 21.5 (21.2; 21.9) 21.9 (21.5; 22.4) 21.6 (21.1; 22.1) 0.411
Waist circumference (cm) 78.0 (77.1; 78.9) 77.4 (76.4; 78.4) 79.1 (77.8; 80.4) 0.078
Abdominal subcutaneous adipose tissue (cm) 1.0 (0.9; 1.1) 1.6a(1.5; 1.7) 1.5a(1.4; 1.6) \0.001
Visceral adipose tissue (cm) 6.4 (6.3; 6.6) 6.1a(6.0; 6.3) 6.7a,b(6.5; 6.9) \0.001
Glucose tolerance status
Impaired fasting glycaemia,n(%) 3 (0.8) 2 (0.5) 3 (0.9) 0.843
Impaired glucose tolerance,n(%) 39 (10.8) 31 (8.2) 16 (4.6)a 0.009
Combined IFG/IGT,n(%) 2 (0.6) 2 (0.5) 2 (0.6) 0.997
Screen-detected diabetes mellitus,n(%) 9 (2.5) 5 (1.3) 2 (0.6) 0.101
Results are presented asn(%) for categorical variables and mean (95 % CI) for continuos variables a Significantly different from Luo (p
\0.05) in Bonferroni post hoc test b Significantly different from Kamba (p
\0.05) in Bonferroni post hoc test
Table 2 Venous whole blood glucose and serum insulin levels and derived parameters following an oral glucose tolerance test by ethnic group in adult Kenyans (n=1,087)
Luo (n=361)
Kamba (n=378)
Maasai (n=348)
pvalue
Glucose (mmol/l)c
0 min 4.4 (4.3; 4.5) 4.4 (4.3; 4.4) 4.4 (4.3; 4.5) 0.639
30 min 6.1 (5.9; 6.2) 6.3 (6.2; 6.4) 6.1 (6.0; 6.3) 0.054
120 min 5.3 (5.2; 5.5) 5.1a(4.9; 5.2) 4.8a(4.7; 5.0) \0.001
Insulin (pmol/l)d
0 min 18.4 (17.2; 19.8) 21.7a(20.2; 23.3) 25.0a,b(23.4; 26.7) \0.001
30 min 125.1 (117.3; 133.4) 181.4a(169.5; 194.0) 178.3a(166.6; 190.8) \0.001
Insulin indicesd
HOMA2-IR 0.34 (0.32; 0.36) 0.40a(0.37; 0.43) 0.45a,b(0.42; 0.48) \0.001
Early phase insulin secretion (pmol/l) 762.6 (735.5; 790.6) 854.8a(819.8; 891.4) 886.5a(851.4; 923.1) \0.001
Disposition index (early phase IS/HOMA2-IR) 2,249 (2,113; 2,393) 2,150 (2,029; 2,279) 1,958a(1,846; 2,077) 0.005
Results are presented as mean (95 % CI) or geometric mean (95 % CI) a Significantly different from Luo (p\0.05) in Bonferroni post hoc test
b Significantly different from Kamba (p\0.05) in Bonferroni post hoc test
c Mean (95 % CI)
There were tendencies of interactions between ethnicity and SAT in Maasai versus Kamba in HOMA2-IR (p=0.066), between ethnicity and VAT in Maasai versus Luo (p =0.063) in HOMA2-IR and in Kamba versus Luo (p=0.062) in early phase insulin secretion.
Conclusions
This study showed profound differences in insulin resis-tance and beta-cell function between rural ethnic groups in Kenya. More specifically, we demonstrated that the Maasai had the highest insulin resistance and the highest insulin secretion. Despite this compensatory insulin secretion, the Maasai had the least favourable beta-cell function as illustrated by a lower DI.
The higher insulin resistance in the Maasai may in part be the result of an intake of fat that is twice as high compared to the Luo and Kamba (30 vs. 15E%) [14]. In addition, the fat intake of the Maasai is predominantly saturated fat from cow’s milk which has been shown to be associated with obesity-independent ectopic fat accumu-lation in the liver [20,21]. Likewise, the more favourable insulin sensitivity in the Luo may in part be explained by a combination of starchy carbohydrate intake high in fibre and polyunsaturated fatty acid intake from fish [14].
It has been suggested that surrogate markers of insulin resistance (such as the HOMA2-IR) based on fasting blood tests are reflecting hepatic insulin resistance more than
peripheral insulin resistance [22]. This notion fits well with the Maasai having the highest VAT accumulation [15], as VAT has high lipolytic activity and may therefore con-tribute to ectopic liver fat accumulation via the portal vein [13]. Furthermore, the analysis between ethnicity and VAT interaction suggests that higher VAT accumulation was more detrimental to insulin resistance in the Maasai com-pared to the Luo.
We have recently shown that energy expenditure was high in all three ethnic groups, with the Maasai having the highest level of physical activity [23]. Physical activity is associated with improvement of peripheral insulin sensi-tivity, indicated by lower 2-h glucose levels, whereas fasting glucose does not seem to be affected to the same extent by physical activity [24]. Accordingly, we found reduced 2-h glucose levels of the Maasai, indicating a higher degree of peripheral insulin sensitivity in this pop-ulation [25], whereas HOMA2-IR, primarily reflecting hepatic insulin resistance [22], was higher in the Maasai compared with the other groups.
The inter-ethnic differences of insulin secretion were similar to the ones we found in insulin resistance. The difference (borderline significant) between the Maasai and the Kamba was explained by differences in abdominal SAT and VAT accumulation. In general, the insulin secretion of the Maasai was less sufficient in compensating for the insulin resistance compared to the Luo and Kamba. There was also a highly significant interaction between ethnicity and VAT accumulation in the Maasai versus the Luo, Table 3 Ethnicity as predictor of HOMA2-IR, early phase insulin secretion and disposition index by linear regression coefficients (expB), (95 % CI), (n=1,087)
Model 1 Model 2 Model 3
ExpB 95 % CI pvalue ExpB 95 % CI pvalue ExpB 95 % CI pvalue
HOMA2-IR
Kamba versus Luo 1.12 1.02; 1.24 0.017 1.01 0.92; 1.11 0.805 1.16 1.06; 1.27 0.001
Maasai versus Luo 1.32 1.20; 1.46 \0.001 1.15 1.05; 1.26 0.003 1.25 1.14; 1.36 \0.001
Maasai versus Kamba 1.17 1.06; 1.30 \0.001 1.14 1.04; 1.25 0.007 1.07 0.98; 1.18 0.144
Early phase insulin (pmol/l)
Kamba versus Luo 1.10 1.04; 1.17 \0.001 1.06 1.00; 1.12 0.036 1.11 1.05; 1.18 \0.001
Maasai versus Luo 1.16 1.09; 1.22 \0.001 1.10 1.04; 1.16 0.001 1.14 1.07; 1.20 \0.001
Maasai versus Kamba 1.05 0.99; 1.11 0.100 1.04 0.98; 1.10 0.200 1.02 0.96; 1.08 0.489
Disposition indexa
Kamba versus Luo 0.98 0.90; 1.06 0.585 1.04 0.96; 1.13 0.309 0.95 0.88; 1.03 0.254
Maasai versus Luo 0.88 0.80; 0.95 0.002 0.96 0.88; 1.04 0.303 0.91 0.84; 0.99 0.027
Maasai versus Kamba 0.90 0.82; 0.98 0.015 0.92 0.84; 1.00 0.042 0.96 0.88; 1.04 0.291
Model 1: adjusted for sex and age
Model 2: adjusted for sex, age, abdominal subcutaneous adipose tissue
Model 3: adjusted for sex, age, visceral adipose tissue
showing that VAT accumulation is more detrimental to the Maasai. Together, these results indicate that with time, the higher abdominal fat accumulation observed in the Maa-sai—if sustained—may result in increased hyperglycaemia due to a failure of beta-cell compensation.
curve [26], which contributes to the level of the constant, the DI. However, the Maasai had a lower level of beta-cell function—partly explained by abdominal SAT and VAT accumulation—reflecting a shift in the hyperbolic curve towards the origin of the graph. This shift may be an early indication of a high risk of developing diabetes [26].
We are aware that the beta-cell function based on absolute insulin secretion is difficult to interpret. The complex interplay between insulin secretion, insulin sen-sitivity, and hepatic insulin extraction makes the assess-ment of beta-cell function in humans very challenging when done under physiological conditions [27]. However, even though estimation of beta-cell function based on intravenous tests is considered the gold standard, the OGTT-derived estimates of insulin secretion and beta-cell function are more physiological because the incretin hor-mones are in operation in these tests [27].
The results of the ethnic differences in the insulin indices have to be seen in the context of the number of study participants with impaired glucose regulation (IFG, IGT, combined IFG/IGT, and screen-detected diabetes). Considerably fewer Maasai compared to the Luo and Kamba had glucose intolerance despite the higher degree of insulin resistance and beta-cell dysfunction. The inter-pretation of this apparent discrepancy may go in two opposite directions: either the Maasai are not as susceptible to diabetes compared to the two other groups despite higher abdominal fat accumulation or there may be a higher dia-betes incidence in the Maasai in the near future. Any conclusion on the proposed directions is not possible due to the cross-sectional nature of this study.
Apart from the cross-sectional design of this study, another important limitation is the fact that we were not able to assess peripheral insulin sensitivity in our study participants as we did not measure serum insulin at 2 h following the OGTT.
In conclusion, the current study reports key aspects of the metabolic health within different rural African popu-lations. Our results show that the Maasai have the least favourable metabolic health based on insulin resistance and beta-cell function in the three rural Kenyan populations studied. However, based on the current results, we cannot conclude which aspect of their lifestyle that causes higher abdominal fat accumulation and sub-optimal insulin indi-ces relative to other rural Kenyan populations. Smaller studies using more sophisticated measures may be more suitable for taking on the challenge to elucidate the cause– effect relationship between the Maasai lifestyle and their metabolic health.
Acknowledgments We are grateful to all participants, the local chiefs and sub-chiefs, the local elder councils and district politicians. We are also indebted to the late Benedict Omondi (KEMRI), Tobias
Oketch (CVBCR), Arthur J Ukumu (DVBD), Odero Sabiano (DVBD), and Saidi Kisiwa (KEMRI) for their skilful collection and analysis of blood samples in the field. Likewise, we sincerely thank all local assistants for their effort in excellent social mobilization and collection of data. We acknowledge the permission by the Director of KEMRI to publish this manuscript. The study was supported by DANIDA, Cluster of International Health (University of Copenha-gen), Steno Diabetes Center, Beckett Foundation, Dagmar Marshall Foundation, Dr. Thorvald Madsen’s Grant, Kong Christian den Ti-ende’s Foundation, Brdr. Hartmann Foundation. The funding bodies had no role in the study design, data collection, data analysis, data interpretation or decision to publish the findings.
Conflict of interest The authors declare no conflict of interest.
References
1. Whiting DR, Guariguata L, Weil C, Shaw J (2011) IDF diabetes atlas: global estimates of the prevalence of diabetes for 2011 and 2030. Diabetes Res Clin Pract 94:311–321
2. Christensen DL, Friis H, Mwaniki DL et al (2009) Prevalence of glucose intolerance and associated risk factors in rural and urban populations of different ethnic groups in Kenya. Diabetes Res Clin Pract 84:303–310
3. Amoah AG, Owusu SK, Schuster DP, Osei K (2002) Pathogenic mechanism of type 2 diabetes in Ghanaians—the importance of beta cell secretion, insulin sensitivity and glucose effectiveness. S Afr Med J 92:377–384
4. Mbanya JC, Pani LN, Mbanya DN, Sobngwi E, Ngogang J (2000) Reduced insulin secretion in offspring of African type 2 diabetic parents. Diabetes Care 23:1761–1765
5. Shires R, Joffe BI, Seftel HC (1985) Maximal pancreatic beta-cell stimulation and the counter-regulatory hormonal responses in South African black and white obese subjects. S Afr Med J 67:845–847
6. Amoah AG, Owusu SK, Ayittey OM, Schuster DP, Osei K (2001) Minimal model analyses of beta cell secretion, insulin sensitivity and glucose effectiveness in glucose tolerant, non-diabetic first-degree relatives of Ghanaian patients with type 2 diabetes and healthy control subjects. Ethn Dis 11:201–210
7. Ezenwaka CE, Akanji AO, Akanji BO, Unwin NC, Adejuwon CA (1997) The prevalence of insulin resistance and other car-diovascular disease risk factors in healthy elderly southwestern Nigerians. Atherosclerosis 128:201–211
8. Nakagami T, Qiao Q, Carstensen B et al (2003) Age, body mass index and type 2 diabetes-associations modified by ethnicity. Diabetologia 46:1063–1070
9. Jennings CL, Lambert EV, Collins M, Levitt NS, Goedecke JH (2009) The atypical presentation of the metabolic syndrome components in black African women: the relationship with insulin resistance and the influence of regional adipose tissue distribution. Metabolism 58:149–157
10. Hanley AJ, Wagenknecht LE, Norris JM et al (2009) Insulin resistance, beta cell dysfunction and visceral adiposity as pre-dictors of incident diabetes: the Insulin Resistance Atheroscle-rosis Study (IRAS) Family study. Diabetologia 52:2079–2086 11. McLaughlin T, Lamendola C, Liu A, Abbasi F (2011)
Prefer-ential fat deposition in subcutaneous versus visceral depots is associated with insulin sensitivity. J Clin Endocrinol Metab 96:E1756–E1760
13. Yki-Jarvinen H (2002) Ectopic fat accumulation: an important cause of insulin resistance in humans. J R Soc Med 95 Suppl 42:39–45
14. Hansen AW, Christensen DL, Larsson MW et al (2011) Dietary patterns, food and macronutrient intakes among adults in three ethnic groups in rural Kenya. Public Health Nutr 14:1671–1679 15. Christensen DL, Eis J, Hansen AW et al (2008) Obesity and
regional fat distribution in Kenyan populations: impact of eth-nicity and urbanization. Ann Hum Biol 35:232–249
16. Stolk RP, Wink O, Zelissen PM, Meijer R, van Gils AP, Grobbee DE (2001) Validity and reproducibility of ultrasonography for the measurement of intra-abdominal adipose tissue. Int J Obes Relat Metab Disord 25:1346–1351
17. WHO (1999) Definition, diagnosis and classification of diabetes mellitus and its complications. Part 1: diagnosis and classification of diabetes mellitus. World Health Organisation. WHO/NCD/ NCS/99.2. (GENERIC), Geneva, pp 1–59
18. Levy JC, Matthews DR, Hermans MP (1998) Correct homeo-stasis model assessment (HOMA) evaluation uses the computer program. Diabetes Care 21:2191–2192
19. Stumvoll M, Mitrakou A, Pimenta W et al (2000) Use of the oral glucose tolerance test to assess insulin release and insulin sen-sitivity. Diabetes Care 23:295–301
20. Musso G, Gambino R, De MF et al (2003) Dietary habits and their relations to insulin resistance and postprandial lipemia in nonalcoholic steatohepatitis. Hepatology 37:909–916
21. Pietilainen KH, Rissanen A, Kaprio J et al (2005) Acquired obesity is associated with increased liver fat, intra-abdominal fat, and insulin resistance in young adult monozygotic twins. Am J Physiol Endocrinol Metab 288:E768–E774
22. O’Rahilly S, Hattersley A, Vaag A, Gray H (1994) Insulin resistance as the major cause of impaired glucose tolerance: a self-fulfilling prophesy? Lancet 344:585–589
23. Christensen DL, Faurholt-Jepsen D, Boit MK et al (2012) Car-diorespiratory fitness and physical activity in Luo, Kamba, and Maasai of rural Kenya. Am J Hum Biol 24:723–729
24. Healy GN, Dunstan DW, Shaw JE, Zimmet PZ, Owen N (2006) Beneficial associations of physical activity with 2-h but not fasting blood glucose in Australian adults: the AusDiab study. Diabetes Care 29:2598–2604
25. Faerch K, Vaag A, Holst JJ, Glumer C, Pedersen O, Borch-Johnsen K (2008) Impaired fasting glycaemia vs impaired glu-cose tolerance: similar impairment of pancreatic alpha and beta cell function but differential roles of incretin hormones and insulin action. Diabetologia 51:853–861
26. Bergman RN, Ader M, Huecking K, Van CG (2002) Accurate assessment of beta-cell function: the hyperbolic correction. Dia-betes 51(Suppl 1):S212–S220