ISSN 2348 – 7968
266
Removal of Taste and Odor Casing Compounds by Granular Activated
Carbon with different Empty Bed Contact Times
Hanbai Park1*, Teayeol Kim1, Dalsik Woo1, Yongsik Cho*2
1 Korea Interfacial Science & Engineering Institute, 400-18 Nambu-daero, Dongnam-gu, Cheonan-si,
330-270, South Korea
2 Department of Civil and Environmental Engineering, Hanyang University, 222 Wangsimni-ro,
Seongdong-gu, Seoul 133-791, Korea
Abstract
Geosmin and 2-MIB removals were evaluated with different empty bed contact time (EBCT) of 5, 10, 15min in granular activated carbon (GAC) columns at geosmin concentrations of 1000, 500, 100ng/L and 2-MIB concentrations of 300, 200, 100ng/L. As a result, GAC column with EBCT of 15 min displayed the highest removal of geosmin (89%) and 2-MIB (85%). With 5min EBCT increase, both geosmin and 2-MIB removal percentages increased 10-20%. In the NOM loading experiment, TOC were spiked in concentrations of 5, 10, 20 mg/L and evaluated through different EBCTs of 5, 10, 15 min. The result conformed that geosmin and 2-MIB removal efficiencies were significantly reduced in TOC concentrations of 5-10mg/L. At over 10mg/L of TOC loading, geosmin and 2-MIB removals displayed below 40%. Therefore, at over 10mg/L of TOC, micropollutants could preload and block pores in GAC columns before geosmin and 2-MIB removal start.
Keywords: Granular Activated Carbon, Geosmin, 2-MIB, TOC, DOC, Different EBCT.
1. Introduction
With global warming, more algae growth results in algae byproducts such as geosmin and MIB, causing objectiona1ble tastes and odors in drinking water. Most taste and odor problems in municipal water systems are no concern to human health, but they raise customer’s suspicions of water safety. Westerhoff et al. (2005) conducted a survey of more than 800 water utilities in the United States and Canada. They found that 16 percent of utilities experienced serious taste and odor problems. Moreover, these utilities spent approximately 4.5 % of their total budget to control taste and odor problems [1]. In South Korea, algae blooms usually occur during summer to fall. In August, 2014, algae blooms in Paldang-Dam occurred and geosmin concentrations were measured 1,131ng/L [2]. Lalezary et al. (1986) mentioned that conventional water treatment technologies, consisting of breakpoint pre-chlorination, coagulation, sedimentation, and post chlorination, are not effective in removing geosmin and 2-Methylisoborneol (2-MIB) from potable water to below its odor threshold of 10 ng/l [3]. One of
common used system for taste and odor events is activated carbon treatment [4]. Due to the difficulty of removal of taste and odor compounds, activated carbon can’t remove these compounds completely. Therefore, specific removal data is necessary to improve its efficiency. Drikas et al. (2009) researched that reduction of EBCT is impacting on removal of geosmin and MIB [5]. Ham Y. W. et al. investigated geosmin and MIB removal with EBCTs of 10 min, 15 min using GAC columns and concluded that GAC with 15 min EBCT enhanced 6% more removal of geosmin and MIB than GAC with 10 min [6]. Smith (2011) delivered that high natural organic matter (NOM) in water provide poor efficiency in removal of geosmin and 2- MIB [7]. Summers et al. (2013) researched removal of 2-MIB effect on GAC, in the range of 50-200ng/L, with different EBCT and TOC effects. They concluded 10-30% different removal efficiency for 5, 10, 15min EBCT differences. For TOC effects, high TOC removed 10-20% less 2-MIB [8]. Anthony et al. 2015 researched different GAC adsorption of organic micropollutants(MPs) with different EBCTs of 7 and 15min and concluded that iopromide broke through to a level of 10% after 50-70% DOC breakthrough[9].
This paper presents comparing study on removal efficiency of taste and odor compounds by using GAC with different empty bed contact time (EBCT) for pilot plant design specifications.
2. Experimental Method
2.1 Material
ISSN 2348 – 7968
267 each unit process. Granular activated carbon (GAC) used
in the experiment was Noritz GAC 1240, USA. GAC specifications are fresh 12 mesh(1.70mm) x 40 mesh(0.425 mm) GACs with a particle diameter (log mean) of 1.1 mm, and a bed density of 0.48 g/cm3. The GAC was backwashed for 12 days before operating and the backwashing time of GAC was designed as turbidity over 0.1 NTU of the treated water was captured. Characteristics of raw water entering the RSSCT during the test was shown in Table.1.
Table 1: Raw water characteristics during the experiment
Item Analytical
Value Unit
Temperatur
e 10-11 ℃
pH 7.01-7.82 - Turbidity 0.2-0.4 NTU Alkalinity 35-40 mg/L
TOC 0.9-1.6 mg/L DOC 0.8-1.3 mg/L Geosmin 0-10 ng/L
2-MIB 0-16 ng/L
2.2. Rapid Small-Scale Column Test (RSSCT)
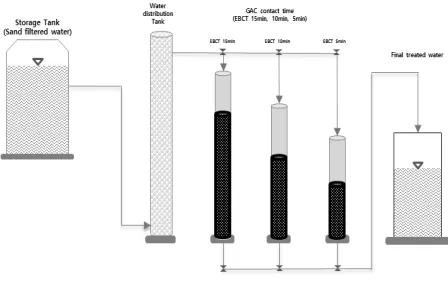
The geosmin samples, at concentrations from 100 ng/L to 1000 ng/L, and 2-MIB samples, at concentrations from 100 ng/L to 300 ng/L, were prepared for the RSSCT. Samples were run in triplicate to improve accuracy. The RSSCT was constructed with three different EBCTs of 5, 10, 15 min to deliver different geosmin and 2-MIB removal efficiencies. Three columns were independently operated to treat taste & odor and inorganic compounds. Schematic images of RSSCT are shown in Fig. 1.
Fig. 1 Schematic images of RSSCT.
2.3. Spiking test
Geosmin and 2-MIB spiking test was determined because of no high concentration of geosmin and 2-MIB during experimental period as shown in Table 1. Preparation of the test samples were made by diluting sand filtered water from Gwangju Water Treatment Plant, South Korea with
geosmin and 2-MIB (100 μg /mL in methanol) from
Supelco, USA in the geosmin concentrations of 100ng /L, 500ng/L, 1000ng/L, and 2-MIB concentrations of 100ng /L, 200ng /L, 300ng/L. These concentrations were set according to high concentration of geosmin during summer, 2014, South Korea [2]. For natural organic matter (NOM) experiment, humic acid was used and purchased from Sigma Aldrich, USA. Humic acid concentrations were calibrated before diluting in sand filtered water to make TOC concentrations of 5 mg/L, 10mg/L and 20mg/L.
2.4. Analytical Method
A fast stir bar sportive extraction (SBSE) method was used to analyze geosmin and 2-MIB. The recent developed stir bar absorptive extraction techniques provide many advantages with very dilute media and low-level samples. This technique was demonstrated with a wide range of volatile and semi-volatile substances such as geosmin, and 2-MIB using a polydimethylsiloxane (PDMS) coated stirring rod [10].
In the experiment, water samples were analyzed PDMS coated stirring rod, sized by length of 10mm and thickness of 32mm (TwisterTM, Gerstel, Germany), for 90 min at 1,200 rpm. The stir rod with the adsorbed material contained in water samples was heated at 280 °C using TDS-2 system (Gerstel, Germany) for 5min and injected to GC(6890N, Agilent, U.S.)/MS(5973N, Agilent, U.S.) The injected analyte was condensed at -120 °C using the liquid nitrogen. The analysis conditions of GC / MS shown in Table 2.
Table 2: GC/MS Conditions for geosmin and 2-MIB analysis
GC condition MS condition Column:
HP-5MS,
30m(L)×0.25mm(ID)×0.25μm(film thickness)
SIM mode
Oven Temp.:
Initial Temp. 50℃, Hold 1.6 min, Selected ion: Geosmin(111, 112, 125) 2-MIB(95, 108) 1st rate 20℃to 100℃,
2nd rate 10℃ to 140℃, 3rd rate 5℃to 160℃
ISSN 2348 – 7968
268 (1)
Where C0 is the initial concentration of geosmin, 2-MIB, TOC and C is the concentration after GAC process. TOC were analyzed using a Shimadzu V-series analyzer (Japan).
3. Results and Discussion
This paper investigated geosmin and 2-MIB removal efficiency using the RSSCT with different EBCTs and TOC concentrations. In first experiment, removal efficiencies of geosmin with different EBCTs of 5, 10, 15min in geosmin concentrations of 100ng/L, 500ng/L and 1000ng/L were evaluated. The second experiment was to meausre 2-MIB removal efficiencies with different EBCTs in 2-MIB concentrations of 100ng/L, 200ng/L, 300ng/L. In third experiment, natural organic matter (NOM) was investigated to analyze degrees of effect on geosmin and 2-MIB removal.
3.1 Geosmin removal by GAC with different EBCTs
In the experiment, initial geosmin concentrations of 100ng/L, 500ng/L, 1000ng/L were artificially made for delivering geosmin removal efficiency by GAC. Used raw water was sand filtered water from Gwangju Water Treatment Plant at ambient temperature 10-11°C. GAC columns were independently provided by variation of EBCT conditions (5, 10, 15 min). TOC ranges were analyzed between 1.1-1.3 mg/L. Geosmin removal efficiencies were shown in Fig 2.
(a) Geosmin removal efficiency at 1000ng/L.
(b) Geosmin removal efficiency at 500ng/L.
(c) Geosmin removal efficiency at 100ng/L.
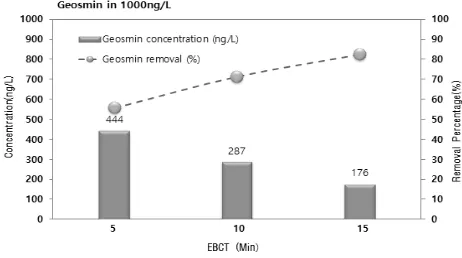
Fig. 2 Geosmin removal efficiency with different GAC EBCTs of 5, 10, 20 min in geosmin concentrations of 1000, 500, 100ng/L
As shown in Fig. 2, geosmin removal was estimated in three different GAC columns. At geosmin concentration of 1000 ng/L, GAC with EBCT 5 min removed 444ng/L (56%) of geosmin and GAC with 10 min removed 287ng/L(71%) of geosmin and GAC with 15 min removed 176ng/L(82%)of geosmin. To sum up, increasing EBCT of 5min provides 10-15% increase in geosmin removal efficiency.
At geosmin concentration of 500 ng/L, geosmin removal efficiencies were measured 178ng/L (64.4%) with GAC EBCT of 5 min, 146ng/L(70.8%) with GAC EBCT of 10 min, and 89ng/L(82.2%) with GAC EBCT of 15 min. As a result, geosmin removal increased in 7-12% with incensement of 5min EBCT.
At geosmin concentration of 100 ng/L, 41ng/L(59%) of geosmin was removed with GAC EBCT of 5 min and 32ng/L(68%) of geosmin was removed with EBCT of 10 min and 11ng/L(89%) of geosmin was removed with EBCT of 15 min. Geosmin removal was increased in 11-21% with 5 min of EBCT increase.
ISSN 2348 – 7968
269 During lowering geosmin concentrations 1000, 500, and
100ng/L, geosmin removal efficiency was measured 5% increase in each concentration. Plus, each 5 min increase in EBCT affects around 7-21% geosmin removal increase.
3.2 2-MIB removal by GAC with different EBCTs
This experiment was conducted to determine 2-MIB removal efficiency in different EBCTs of 5, 10, 15min. 2-MIB concentrations of 100ng / L, 200ng / L, 300ng / L were provided to prove effectiveness on 2-MIB removal with different EBCTs. Raw water used for spiking 2-MIB was shown in Table1 and the experimental result was displayed in Fig. 3.
(a) 2-MIB removal efficiency at 300ng/L
(b) 2-MIB removal efficiency at 200ng/L
(c) 2-MIB removal efficiency at 100ng/L
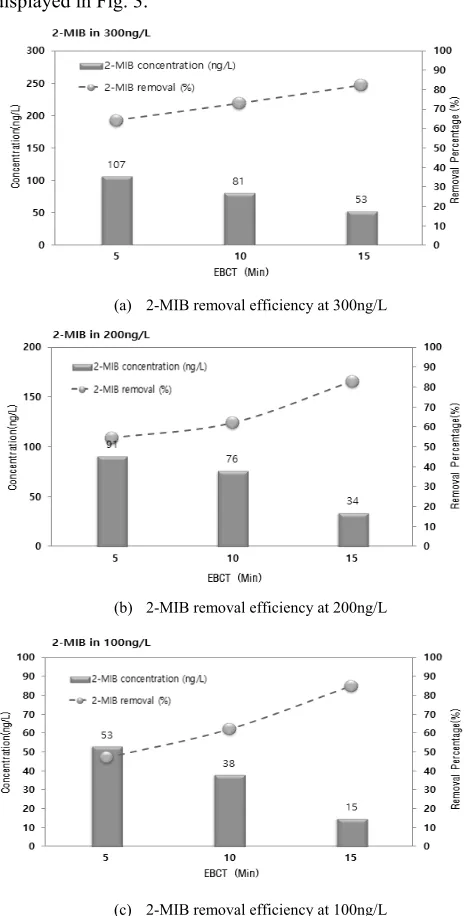
Fig. 3 2-MIB removal efficiency with different GAC EBCTs of 5, 10, 20 min in 2-MIB concentrations of 300, 200, 100ng/L.
According to Fig. 3, 2-MIB removal at initial concentration of 300ng/L was measured 107ng/L (64%) for EBCT 5min, 81ng/L (73%) for EBCT 10 min and 53ng/L (82%) for EBCT 15min. This result represents that 9% of 2-MIB removal increased with 5 min EBCT increase.
At influent concentration of 200ng/L, 2-MIB concentrations were reduced 91ng/L (55%) for EBCT 5min, 76ng/L(62%) for EBCT 10min, and 34ng/L (83%) for EBCT 15min. GAC with 15 min EBCT showed the highest 2-MIB removal and 5min increase in EBCT resulted in 7-21% of 2-MIB removal.
At influent concentration of 100ng/L, 2-MIB concentrations were reduced 53ng/L (47%) for EBCT 5min, 38ng/L (62%) for EBCT 10min, and 15ng/L (85%) for EBCT 15min. Among these, the highest 2-MIB removal was observed with 15 min of GAC column. Thus, increasing EBCT of 5min affects 15 to 23% of increasing 2-MIB removal.
In general, increase in EBCT of GAC columns tended to display a higher 2-MIB removal efficiency without variation of 2-MIB concentrations. As a result, it was found that increasing EBCT could deliver 7-23% increase in 2-MIB removal. Overall, GAC with 15min delivered the best performance among three different EBCTs, at 2-MIB concentrations of 100-300ng/L.
3. 3. Effects of Natural Organic Matter (NOM)
ISSN 2348 – 7968
270 Geosmin 1000 ng/L
Empty Bed Contact Time EBCT 5 EBCT 10 EBCT 15
G e os m in r e m o v a l p e rc en ta ge ( % ) 0 20 40 60 80 100
TOC 1.2 mg/L TOC 5 mg/L TOC 10 mg/L TOC 20 mg/L
(a) Geosmin removal efficiency at 1000ng/L
Empty Bed Contact Time EBCT 5 EBCT 10 EBCT 15
G e o s m in r e m o v a l per c e n ta ge ( % ) 0 20 40 60 80 100
TOC 1.2 mg/L TOC 5 mg/L TOC 10 mg/L TOC 20 mg/L
Geosmin 500 ng/L
(b) Geosmin removal efficiency at 500ng/L
Empty Bed Contact Time EBCT 5 EBCT 10 EBCT 15
G e os m in r e m o v a l p e rc e n tag e (% ) 0 20 40 60 80 100
TOC 1.2 mg/L TOC 5 mg/L TOC 10 mg/L TOC 20 mg/L
Geosmin 100 ng/L
(c) Geosmin removal efficiency at 100ng/L
Empty Bed Contact Time EBCT 5 EBCT 10 EBCT 15
G e os m in r e m o v a l p e rc e n tag e (% ) 0 20 40 60 80 100
TOC 1.2 mg/L TOC 5 mg/L TOC 10 mg/L TOC 20 mg/L
2-MIB in 300 ng/L
(d) 2-MIB removal efficiency at 300ng/L
2-MIB in 200 ng/L
Empty Bed Contact Time EBCT 5 EBCT 10 EBCT 15
G e os m in r e m o v a l p e rc en ta ge ( % ) 0 20 40 60 80 100
TOC 1.2 mg/L TOC 5 mg/L TOC 10 mg/L TOC 20 mg/L
(e) 2-MIB removal efficiency at 200ng/L
Empty Bed Contact Time EBCT 5 EBCT 10 EBCT 15
G e os m in r e m o v a l p e rc e n tag e (% ) 0 20 40 60 80 100
TOC 1.2 mg/L TOC 5 mg/L TOC 10 mg/L TOC 20 mg/L
2-MIB in 100 ng/L
(f) 2-MIB removal efficiency at 100ng/L
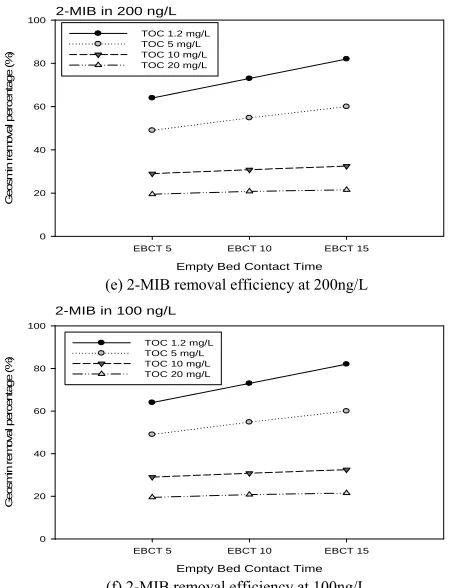
Fig. 4 TOC effects on geosmin 2-MIB removal efficiency with different GAC EBCTs of 5, 10, 20 min in different concentrations (geosmin 1000,
500, 100ng/L, 2-MIB 300, 200, 100ng/L).
According to Fig. 4(a), the geosmin removal was 55.6% (EBCT 5min), 71.3% (EBCT 10min), and 82.4% (EBCT 15min) in TOC 1.2mg/L. At TOC concentration of 5mg/L, geosmin was removed 43.5% (EBCT 5min), 53.1% (EBCT 10min), and 61.2% (EBCT 15min). At TOC concentration of 10mg/L, geosmin removal displayed 28.5% (EBCT 5min), 31.1% (EBCT 10min), and 31.4% (EBCT 15min). At TOC concentration of 20mg/L, geosmin was reduced 21.9% (EBCT 5min), 23.1% (EBCT 10min), and 18% (EBCT 15min). Geosmin removal efficiency was reduced significantly during increasing TOC concentrations.
ISSN 2348 – 7968
271 In Fig. 4(c), geosmin removal was 59% (EBCT 5min),
68% (EBCT 10min), and 89% (EBCT 15min) in TOC 1.2mg/L. At TOC concentration of 5mg/L, geosmin was removed 49.2% (EBCT 5min), 53.7% (EBCT 10min), and 64% (EBCT 15min). At TOC concentration of 10mg/L, geosmin removal displayed 33.2% (EBCT 5min), 38.7% (EBCT 10min), and 44% (EBCT 15min). At TOC concentration of 20mg/L, geosmin was reduced 28.2% (EBCT 5min), 30.7% (EBCT 10min), and 31% (EBCT 15min).
Around 40-20% of geosmin removal was exhibited in the TOC concentration of 10-20mg/L nevertheless difference of EBCTs of GAC columns. At TOC concenrations of 1.2 through 10mg/L, geosmin removal absorption capacity was decreased average 26% for EBCT 5min, average 35% for EBCT 10min and 45% for EBCT 15min. The result could be concluded that longer time water remained in the GAC column adsorbed higher TOC in water. Plus, TOC concentration between 5-10mg/L could highly damage on geosmin removal and over 10mg/L of TOC could reduce 33-59% of geosmin removal efficiency.
For 2-MIB removal, percentage of removals were plotted among the EBCT in Fig. 4(d),(e),(f). In Fig. (d), (e), (f) percentage removals of 2-MIB were significantly decreased during an increase in TOC concentrations. Between TOC concentrations of 1.2 to 5mg/L, 2-MIB removals exhibited 10-25% decrease. The 2-MIB removal percentages were sharply reduced from 5 to 10mg/L of TOC. In the TOC concentration ranges of 10-20mg/L, 2-MIB removal delivered within 5% difference. Therefore, we concluded that high loading of TOC could largely affect 2-MIB removal efficiency. Plus, TOC loading over 10mg/L could preload most of pores in the activated carbon system. After that, 2-MIB removal was settled around 25-40%.
Overall, the geosmin and 2-MIB removals for the three different TOC concentrations indicated that over 5mg/L of TOC influent could significantly affect geosmin and 2-MIB removal efficiency and over 20mg/L of TOC could reduce geosmin and MIB removal efficiency in below 25%. With EBCT increase, geosmin and 2-MIB removals were increased while the high EBCT of GAC columns were further affected by TOC concentrations.
4. Conclusions
In this paper, three main experiments were performed using different EBCTs of GAC column. The geosmin and 2-MIB removals were conducted with different EBCTs of 5, 10, and 15 min in geosmin concentrations of 1000-100ng/L and 2-MIB concentrations of 300-1000-100ng/L. In the experiment, GAC column with EBCT of 15 min displayed the highest removal of geosmin (89%) and 2-MIB(85%).
With 5min EBCT increase, both geosmin and 2-MIB removal percentages increased 7-23%. In the NOM loading experiment, TOC were spiked in terms of 5, 10, 20 mg/L with different EBCTs of 5, 10, 15 min. In this experiment, geosmin and 2-MIB removal efficiencies were significantly reduced in TOC concentrations of 5-10mg/L and at over 10mg/L of TOC loading, geosmin and 2-MIB removals displayed below 40%. This result conformed that at over 10mg/L of TOC, micropollutants could preload most of pores in GAC before geosmin and 2-MIB. This study determined geosmin and 2-MIB removal in GAC columns by changing EBCTs and NOM levels. Since the GAC process has used a main process in the water treatment system, this experiment would be helpful to control taste and odor compounds in water treatment plant.
Appendix
Appendixes, if needed, appear before the acknowledgment.
Acknowledgments
This research was supported by a grant (12-TI-C01) from the Advanced Water Management Research Program funded by the Ministry of Land, Infrastructure, and Transport of the Korean government.
References
[1] P. Westerhoff, M Rodriguez-Hernandez, L Baker, and M Sommerfeld, “Seasonal occurrence and degradation of 2-methylisoborneol in water supply reservoirs” Water Research, Vol. 38, 2005, pp. 4899-4912.
[2] S. C. Lee and D. B. Kim, “ Algae advisory issued in Paldang Lake, South Korea”, Han River Environmental Office, Posted on 2014. 08.06, Retrieved from http://www.me.go.kr [3] Lalezary, S., Pirbazari, M., McGuire, M.J., "Oxidation of
five earthy–musty taste and odor compounds" J. Am. Water Works Ass. Vol.78, 1986, pp.62–69.
[4] Srinivasan R and Sorial GA., “Treatment of taste and odor causing compounds 2-methylisoborneol and geosmin in drinking water: a critical review”, J. Environ Sci., Vol.23, No 1, 2011, pp.1-13.
[5] Drikas, M., Dixon, M., Morran, J., "Removal of MIB and geosmin using granular activated carbon with and without MIEX pre-treatment", Water Research, Vol.43, No.20, 2009, pp. 5151-5159.
ISSN 2348 – 7968
272
[7] Kyla Miriam Smith., “Characterization of activated carbon for taste and odour control”, M.S thesis, Civil Engineering, University of Toronto, Toronto, Canada, 2011.
[8] R. S. Summers, S. M. Kim., K. Shimabuku, S.H. Chae, and C. J. Corwin, “Granular activated carbon adsorption of MIB in the presence of dissolved organic matter”, Water research, Vol.47, 2013, pp. 3507-3513.
[9] Anthony. M. K., A. M. Reinert, D. R. U. Knappe, I. Ferrer, and R. S. Summers., “Full-and pilot-scale GAC adsorption of organic micropollutants”, Water research, Vol.68, 2015, pp.238-248.
[10] S. Nakamura, N. Nakamura, and S. Ito “Determination of 2-methylisoborneol and geosmin in water by gas chromatography-mass spectrometry using stir bar sportive extraction”, J. Separation Science, Vol.24, NO. 8, 2001, pp.674-677.
[11] Q. Li, V.L. Snoeyink, B.J. Mariñas, C. Campos,"Pore blockage effect of NOM on atrazine adsorption kinetics of PAC: the roles of PAC pore size distribution and NOM molecular weight", Water Research, Vol.37, 2003, pp. 4863– 4872.
[12] Newcombe G., Morrison J., Hepplewhite C., "Simultaneous adsorption of MIB and NOM onto activated carbon. I. Characterisation of the system and NOM adsorption”, Carbon. Vol.40, NO.12, 2002a, pp. 2135–2146.
[13] Newcombe G., J. Morrison, C. Hepplewhite, D.R.U. Knappe, "Simultaneous adsorption of MIB and NOM onto activated carbon: II. Competitive effects", Carbon, Vol.40, NO.12, 2002b, pp. 2147–2156.
First Author Hanbai Park received Ph.D. in Civil and Environmental Engineering, Oklahoma State University, OK, USA in 2013. Currently, He is working as a senior researcher on Smart Water Grid Research Program funded by the Ministry of Land, Infrastructure, and Transport of the Korean government.
Second Author Teayeol Kim received M.S in construction and environmental engineering, Hanyang University, South Korea in 2014. He is working as a junior researcher in Korea interfacial science engineering institute.
Third Author He is a principle research engineer in Korea interfacial science and engineering institute and an adjunct professor in Sangmyung University, South Korea. He is an adversary in Mistry of Environment, Mistry of Land, Infrastructure and Transport, Mistry of Knowledge Economy, South Korea.