Computing
Chin-Jung Hsu
∗, Vincent W. Freeh
∗, Flavio Villanustre
† ∗Department of Computer Science, North Carolina State University†LexisNexis Risk Solutions
Email: [email protected], [email protected], [email protected]
Abstract
Infrastructure as a Service, one of the distinguishing characteristics of cloud computing, enables configuring a cluster for each application for each workload. When the workload changes, a statically-sized cluster with a fixed capacity will be either underutilized (wasting resources) or unable to meet demand (incurring opportunity costs). In cloud computing, a new cluster configuration easily can be used for the next run of the application. As the workload increases the cluster can expand. However, efficient cluster expansion requires proper data replication and placement. This paper focuses on workload-aware data replication and placement to support efficient cloud computing. It examines the tradeoffs between replication factors, partition granularity, and placement strategy. It shows that coarse-grain, workload-aware replication is able to improve performance over a n¨aive uniform data placement. Dividing the dataset into small sets, fine-grain replication, improves performance because it can better match the anticipated workload and can tolerant small mispredictions. We propose two fine-grain placement schemes, one to maximize load balancing and another to exploit cache locality. Our results have shown that the coarse-grain replication exhibit 25.3% and 80.9% increase in system throughput under medium-skew and high-skew workloads respectively. The fine-grain scheme, on the other hand, reaches 52.4% and 166.3% improvement for the same workloads.
Index Terms
data replication; data placement; data-intensive computing;
I. INTRODUCTION
In large-scale, distributed systems the dataset, which is too large for a single node, is partitioned among the nodes. Incoming workload (i.e., requests) is routed among nodes by a load balancer. For extreme horizontal scaling to be effective, it is necessary for nearly all requests to be routed to a node containing the needed data locally, which avoids unnecessary node-to-node interactions. Consequently, data replication and data placement are components of load balancing and have a substantial impact on system performance. This paper demonstrates the importance of matching replication and placement to expected workload, e.g., replicate hot partitions more than cold ones and place data to balance the load. Before cloud computing, infrastructure was purchased and used for many years before it is upgraded or replaced. However, with Infrastructure as a Service (IaaS) equipment is rented for a short time, including as short as one execution of an application. The shift from buying to renting greatly increases the flexibility of infrastructure available for a given application. Therefore, rather then tune an application to run well on a specific machine a cloud user instead can tune the infrastructure to accommodate each application on each dataset.
Efficient deployment of large-scale, distributed systems with an irregular workload requires both cluster sizing and data placement. N¨aive uniform data replication (where all data partitions have the same number of replicas) is effective only when the workload is also uniform—requests are equally distributed among all partitions. Workload-aware data placement replicates and places partitions to match the distribution of requests in the anticipated workload.
uniform beta normal powerlaw gamma Workload Distribution
0 100 200 300 400 500 600
Th
rou
gh
tpu
t (
qu
eri
es/
se
co
nd
)
uniform complete
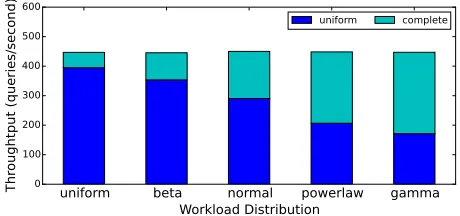
Fig. 1. Uniform data placement is suboptimal. (Data is a subset of data shown in Table II on page 8.)
bound on the potential gains of matching data replication and workload. The performance of complete is flat across all workloads because any node can process a request, as a result new requests are sent to the least loaded node. In this example, the cluster has twice the minimum capacity, so uniform replication has two copies of each partition. Therefore, a request must be sent to one of the two nodes that hold the data associated with the request. Throughput decreases as the workload skew increases because some nodes are over loaded and while others are under utilized. While complete has 13% greater throughput on uniform workload, it is 160% greater on the highly-skewed gamma workload. This example illustrates the need to properly replicate and place data on the nodes of a cluster.
There is a large body of work emphasizing on data replication and placement. For example, AUTOPLACER [1] and MeT [2] optimize data placement to fit workload characteristics in NoSQL databases. Replicating hotter data in storage is a common approach to balance load [3]. In the database domain, sharding is used to distribute load by partitioning tables to achieve effective horizontal scaling [4], [5], [6], [7], [8]. We are interested in partition granularity, data replication, and data placement.
Our approach begins with a prediction of the upcoming demand for each data partition. Because load prediction is long-studied and beyond the scope of our work, we assume a reasonable prediction can be provided [9], [10]. Obviously, if a prediction is wrong (or a workload is unpredictable) the gains will be less.
This paper explores the three decisions that affect data placement. The first decision is granularity of data partitions. The number of data partitions influences how closely the replication matches the workload. A coarse-grain partition (one per node) is unlikely to match the workload. This paper shows the benefits of fine-grain (many partitions per node) placement. The second decision is how many replicas of each partition. The anticipated demand per partition (the workload) determines the replication factor for each data partition. The hotter the data, the greater the replication. Last, fine-grain partitioning raises aplacement
decision. This paper examines the effect of placing data partitions among nodes in order to reduce memory footprint on each node and in order to best balance the load among the nodes.
This paper demonstrates the effectiveness of workload-aware data placement on an HPCC cluster.1 A
typical HPCC application involves batch processing and query execution. For the latter, data placement is critical for maximizing system throughput. The evaluation in this paper is on HPCC but the results are generic and apply to other systems.
Our results have shown that proper data replication and placement affect system performance greatly. The coarse-grain scheme improves system throughput by 25.4% and 84.9% under the normal and power law distribution, which are observed in many real world applications. A finer partition granularity with a balancing placement helps reduce load imbalance, and improves query throughput by 52.4% and104.7%. The most highly-skewed case even shows a 166.3% increase.
This work relies on a prediction of the upcoming workload, which will invariably be wrong to some degree. We, therefore, consider the robustness, which is a measure to describe how sensitive a data
1
placement scheme is to slightly mis-predicted workloads. Tests show that increasing the number of unique partitions per node increases the robustness of a placement.
The remainder of this paper is organized as follows. The next section reviews related work. Section III presents a model for data replication and placement. Section IV describes our two data placement solutions. Section V presents our evaluation. The final section summarizes the paper.
II. RELATEDWORK
Partition granularity, data replication and data placement are three building blocks to handle non-uniform workload. These research problems are widely studied in prior work such as storage systems [3], database systems [1], [2], [11], [12], [8], memory caching [13], [14], and content delivery systems [15]. Data replication and placement are keys to system availability and performance. Our work primarily focuses on improving system performance by optimizing these keys.
Partition Granularity
Partitioning data is the first step towards load sharing among nodes. Partition granularity can be blocks, objects and tables. A generic file systems uses, for example, blocks of 4 or 8KB, while Hadoop Distributed File System (HDFS), designed for large file, adopts a much larger block size, e.g., 64MB, which reduces management overhead of handling large files [16]. In Ceph, a distributed object storage system, an object is the unit of partition [17]. Sharding, which partitions large tables into smaller pieces, is a common technique to distribute load among multiple databases instances [18]. It is used in both SQL and NoSQL databases such as BigTable [4], HBase [5], MongoDB [19] and Cassandra [6].
Much recent work in database systems focuses on partitioning methods to minimize transaction overhead and to maximize load balancing. Schism uses graph-partitioning algorithms to determine the optimal partitioning for minimizing the cost of distributed transactions [8]. The proposed fine-grain data partition minimizes the required number of distributed transactions for database applications. Pavlo et al. develop a database tool that is able to generate optimal database designs for parallel OLTP systems [12]. They propose a new search algorithm for partitioning a database and create a cost model to minimize the coordination cost while maximizing load balance. Spanner is a semi-relational database that manages replicated data globally and performs resharding at runtime for better load balancing [11]. Slicer is an auto-sharding service designed by Google [7]. To leverage Slicer, users are required to associate incoming requests with a key. Slicer dynamically maps the key to a proper task for maximizing load balance.
In generally, tuning the partition size is critical to improve system throughput or reduce query latency [20]. We study the performance impact of choosing different partition granularity.
Data Replication
Data Placement
Placing replicas affects workload distribution to a system. An efficient method better balances loads in a distributed system. For example, HDFS use rake-awareness placement scheme for fault tolerance but not for optimizing performance. CoHadoop leverages application hints to co-locate related data on the same set of Hadoop nodes [22]. This placement scheme is able to improve performance of many Hadoop operations such as indexing and join. Another example is to place data partitions according to processing capacity of nodes for solving performance degradation identified in heterogeneous Hadoop clusters [23]. The following studies have shown that non-uniform query key causes load imbalance in data partitions, thereby degrading system performance. AUTOPLACER [1] optimizes the placement for the top-k objects in the distributed key-value store. To minimize the maintenance cost of large number of objects, AUTOPLACER proposes the probabilistic data structure (PAA) to reduce routing latency. MET [2] is an elasticity framework that optimizes data placement to fit workload characteristics for HBase. It is able to reconfigure HBase dynamically when an HBase cluster requires expansion or contraction. MET found that heterogeneous machines can easily lead to load imbalance. To balance the load on each server, MET groups data partitions according to their access pattern. MET models the cost of placing data partitions on nodes, and uses Longest Processing Time (LPT) to minimize the cost, which maximizing load sharing among nodes. The above implements a system that replicates and places data according to data access pattern. Our work explores how data replication and placement schemes affect system performance under different workload distribution.
In summary, our work is an integral study on the partition granularity, data replication and data placement. We also evaluate robustness, tolerance to small mis-predications. Our work makes contributions in three ways. First, partition granularity determines the basic unit to calculate load. Second, data replication is governed by anticipated workload. Last, data placement chooses the slots on servers for maximizing load balancing or exploiting cache locality. We believe our findings and proposed schemes are also applicable to systems that have the flexibility to choose replication factors and data locations, such as distributed storage systems and NoSQL databases.
III. MODELING DATA REPLICATION AND PLACEMENT
There are several reasons to partition and replicate data in large-scale, distributed systems. Foremost, many applications must partition the dataset and distribute the parts among multiple nodes because the dataset is too large to be stored on a single node. Additionally, high-performance applications replicate dataset partitions to increase throughput or reduce latency. Furthermore, replication is used to increase system availability.
Our work concerns systems in which dataset must be partitioned among the nodes because the dataset is too large to be completely replicated on each node. We replicate subsets of the whole dataset in order to increase throughput and decrease latency. While replication for availability is critically important, it is not a subject of this research.
Distributed, large-scale systems, such as Apache Hadoop, Spark, Cassandra, and Ceph largely exploit data locality while reducing node-to-node communication for achieving high horizontal scaling [16], [24], [6], [17]. Data partitions are replicated as the system scales out. An inefficient data placement scheme is unable to achieve the optimal system performance and service-level objective (SLO) violations may occur [1], [2], [25], [23].
N1 N2 N3 N4
P1 P2 P3 P4
1 2 3
0 Demand
(a) Coarse-Grain (M =N= 4, k= 1)
P16
P1 P2P3 P4 P5 P6 P7 P8P9 P10P11P12P13P14P15
N1 N2 N3 N4
1 2 3
0 Demand 4
(b) Fine-Grain (M =N = 4, k= 4)
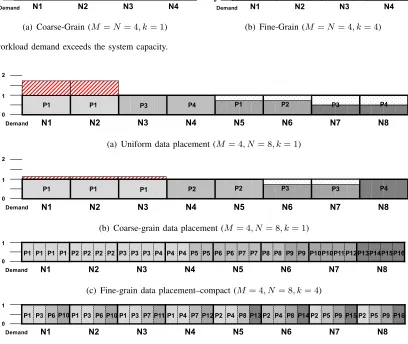
Fig. 2. The workload demand exceeds the system capacity.
N1 N2 N3 N4 N5 N6 N7 N8
P1 P1 P3 P4 P1 P2 P3 P4
2
1
0 Demand
(a) Uniform data placement (M = 4, N = 8, k= 1)
2
1
0
Demand N1 N2 N3 N4 N5 N6 N7 N8
P3 P4
P2 P3
P1 P1 P1 P2
(b) Coarse-grain data placement (M= 4, N= 8, k= 1)
1
0
P5
P1 P1 P1 P1 P2 P2 P2 P2P3 P3 P3 P4 P4 P4 P5 P6 P6 P7 P7 P8 P8 P9 P9 P10P10P11 P12P13P14P15P16
N1 N2 N3 N4 N5 N6 N7 N8
Demand
(c) Fine-grain data placement–compact (M = 4, N = 8, k= 4) 1
0
P12
P1 P3 P6 P1 P3 P6P10P1 P3 P7 P11 P1 P4 P7 P2 P4 P8P13P2 P4 P8P14P2 P5 P9 P15 P2 P5 P9P16
Demand
P10
N1 N2 N3 N4 N5 N6 N7 N8
(d) Fine-grain data placement–balanced (M = 4, N= 8, k= 4)
Fig. 3. Different data placement schemes.
The following model characterizes thedata replication and placement problemin large-scale, distributed systems. Let M be the minimum cluster size that is sufficient to hold all data. The storage capacity is strictly limited by the amount of data it physically can store locally. In many real-world applications, M
is in the hundreds. However, for this model it is only necessary that M not be equal to one, which can be load balanced without partitioning the data.
Let N (N ≥M) be the number of nodes in a cluster. When the workload changes, the cluster expands (N increases) to meet increased demand and minimize QoS violations, or it contracts (N decreases) to reduce resource usage and cost.
The data is partitioned into k ≥ 1 equal-sized data partitions on each node. Thus, there are P =M k
unique data partitions. Because the cluster has N nodes, there are S=N k slotsfor data partitions. When
N > M, then S > P and some partitions can be replicated among the “extra” slots. Coarse-grain data placement occurs when there is only one partition per node, k = 1. Fine-grain data placement, k > 1, which has more total data partitions and partition slots, supports more unique placements than coarse-grain providing a better opportunity to match the workload and increase performance.
0 256 512 768 1024 Partition Id
0 40 80 120 160
Ac
ce
ss
Fre
qu
en
cy uniform
0 256 512 768 1024
Partition Id beta
0 256 512 768 1024
Partition Id normal
0 256 512 768 1024
Partition Id power law
0 256 512 768 1024
Partition Id gamma
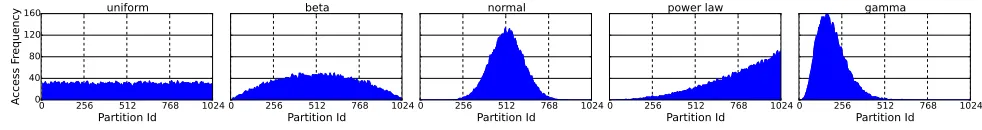
Fig. 4. Representative workload distribution used in this work (1024 partitions).
is twice the current capacity. Figure 2(a) shows the load per partition on four nodes. The load is unevenly distributed among the partitions. In particular, in terms of node capacity the load on the four partitions in Figure 2(a) is 3.5, 2, 1.5, and 1 (which conveniently totals 8). Figure 2(b), shows the same aggregate demand as it is distributed among 16 partitions, four per node: k = 4.
Suppose the cluster doubles in size to eight nodes exactly meeting current and anticipated demand. Uniform replication onto eight nodes creates two replicas of each partition as shown in Figure 3(a). The red box above the two left-most nodes shows the excess demand on those nodes as 3.5 units of node capacity are serviced by two nodes. The white regions in the four right-most nodes show the underutilization because the demand is less than the capacity.
A coarse-grain, non-uniform solution has less over- and underutilization than uniform because hotter
partitions can be replicated more than colder ones. For example, in Figure 3(b) the 3.5 units of P1 are distributed over three nodes. Unsurprisingly, a fine-grain solution can better match the demand to the capacity. Figure 3(c) shows that demand is perfectly matched to capacity in this idealized example.
Fine-grain replication gives rise to a placement decision. Figure 3(d) shows a second placement that also perfectly matches capacity but has four unique partitions on each node. The nodes in Figure 3(c) have either one or two unique partitions. Fewer unique partitions per node reduces memory footprint, whereas more unique partitions per node increases the number of nodes that can respond to a given request.
This simple example was constructed to clearly show the benefits of non-uniform, fine-grain data placement. Unless the demand is uniformly distributed among the partition (an unusual occurrence as explained in Section II) then a n¨aive uniform placement leads to over- and underutilization.
IV. WORKLOADS
This section presents the workload distributions analyzed in this work. Then it introduces how to determine the replication factor and place data to better fit workloads.
A. Workloads Characteristics
Because this paper considers data replication and placement, the workload characterization that matters most is access frequency of the individual elements of the dataset, such as, the pages of a web server or the keys in an index. A workload has many other critical characteristics, such as arrival rate and autocorrelation, that are not factored into this work.
Internet workload analysis shows that demand is uniform. Which is unsurprising because non-uniform workloads are common in many natural settings. For example, the normal (Gaussian) distribution can be observed in class score distribution, while the log-normal distribution is useful to describe the response file size in web servers [30]. In addition, the power law probability distribution is widely applicable to web hits, word frequency, personal income, etc. and tends to be highly skewed towards a small subset of the full dataset [31]. Several studies show that frequency of access to different pages or keys often follows a Zipf or power law distribution. This has be shown in web servers [32], [33], video streaming [34], and Wikipedia traffic [35] to name a few.
In this work, we consider five workload distributions.Uniformdistribution provides a n¨aive baseline. The
1
4
8 16 32 64 128
Number of partitions per node (log scale)
0.0
0.2
0.4
0.6
0.8
1.0
Nu
mb
er
of
un
iqu
e
pa
rti
tio
ns
(no
rm
ali
ze
d)
compact
balanced
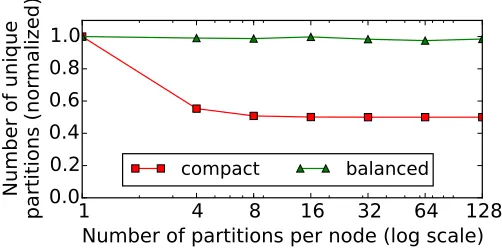
Fig. 5. Simulation to compare the number of unique partitions per node under the power law workloads.
1
4 8 16 32 64 128
Number of partitions (log scale)
1.0
1.1
1.2
1.3
1.4
1.5
1.6
1.7
Lo ad Im ba lan ce (M ax /M ea n) uniform beta normal powerlaw gamma (a) Compact1
4 8 16 32 64 128
Number of partitions (log scale)
1.0
1.1
1.2
1.3
1.4
1.5
1.6
1.7
Lo ad Im ba lan ce (M ax /M ea n) uniform beta normal powerlaw gamma (b) BalancedFig. 6. Simulation to compare load imbalance with various partitions per node. The cluster size is 8.
is similar to Zipf and Pareto) is used because it models unconstrained accesses from an independent population such as Internet users. These three distributions are augmented with two more. The beta
distribution is able to produce random variables within a finite interval, e.g., access percentages of a partition. The gamma distribution generates a highly skewed distribution, of which the exponential distribution of power law is a special case, that was studied in the storage domain [37].
Figure 4 presents the five workload distributions we analyze in the paper. The graphs show the frequency of access for each of 1024 partitions. The workloads are created by methods in therandomfrom the Python standard library. There are 30,000 unique requests among the 1024 partitions. As expected, all keys in the uniform distribution have about 30 accesses each. The gamma distribution has the greatest skew in the access rates. A handful of partitions have more than 150 access and more than half of the partitions have one or zero accesses. In Figure 4, the distributions are ordered by increasing load imbalance.
Table I shows the distribution of the requests on each of four partitions, instead of 1024 partitions as above. The requests-per-node values are ordered in decreasing magnitude. As there are 30,000 total requests, the average is 7,500 per partition. The rightmost column shows the ratio of the maximum number of requests to the average. As expected there are approximately the same number of requests for each partition in the uniform distribution. The ratio for uniform is 1.01, meaning the maximum is 1% greater than the average. But the highly-skewed gamma distribution has one partition that receives no requests and one has more than three times the average. It is clear from Table I that in non-uniform workloads the maximally loaded partition demands more resources than the other partitions.
An important consideration in data replication and placement is the granularity of the dataset, i.e.,
the number of partitions. The finer the granularity the more flexibility there is in placing partitions. The coarsest granularity is one partition per node and the finest granularity is one partition per key.
TABLE I
LOAD-IMBALANCE OF WORKLOADS.
Distribution Requests for individual partitions max:mean
Uniform 7,565 7,548 7,449 7,438 1.01
Beta 10,313 10,288 4,715 4,684 1.38
Normal 14,882 14,827 149 142 1.98
Power law 17,344 8,795 3,361 500 2.31
Gamma 23,542 6,329 129 0 3.14
the expected workload. For example, suppose there are four partitions (P = 4) and there are sixteen slots for these partitions (S = 16). Given a uniform expected workload the replication factor vector would be [4, 4, 4, 4]. For normal the replication factor vector might be [2, 6, 6, 2] and the power law’s vector could be [1, 2, 4, 9]. In general, there is no perfect match between the vector and the anticipated workload.
Assuming that the predicted load on each is λi and the total load is Λ = Pi=1,Pλi. The replication
problem is to determine the replication vector, R, R~ i ∈ I, such that Ri ≥ 1 ∀i, Pi=1,PRi = S, and P
i=1,P|Ri/S−λi/Λ| is minimized. In words, the replication vector contains the number of replicas (an
integer value) of each partition, such that the total number of replicas equals the number of slots available. The last clause accumulates the error between the actual relative replication of each partition (Ri/S) and
the anticipated relative workload per partition (λi/Λ).
The next step is assigning the replicas to the slots on the nodes. For coarse-grain, total the number of replicas equals the number of slots and there is only one possible placement. But for fine-grain,k >1, there are many possible placements. One placement strategy is to minimize the number of different partitions on each node, which reduces the memory footprint. We called this the compactstrategy. Another strategy is placing partitions in order to best balance the anticipated load among the nodes. We call this strategy
balanced. The fundamental difference between compact and balanced is the number of unique partitions per node as illustrated in Figure 5. A fewer number of unique partitions per node reduces memory footprint, thereby improving cache locality. A higher number maximizes load balancing.
The solution to replication and placement is variant of the bin packing problem, which is NP-hard. However, because the “bins” (nodes) do not have to be filled exactly, a near optimal solution can be obtained quickly. Our programs to determine fine-grain replication, both compact and balanced, converge to a fixed-point solution in less than a dozen iterations.
To explore the benefit of fine-grain replication and placement, we evaluate the effectiveness of our programs in balancing the anticipated workload. We generated 100 instances of workloads, of 30,000 queries, for each of the five distributions. The workload instances vary because the access are generated probabilistically. Each generated workload is considered a prediction of the upcoming workload. The program replicates and places partitions accordingly. We evaluate how well the program balances the load among the nodes by calculating the max:mean ratio of loads on nodes. A perfectly balanced load has a skew value of one. The greater the skew the more imbalance. Figure 6 shows how well the program balances the load. The granularity, k, which ranges from 1 to 128, is shown on the x-axis. The program places each of the 100 workload instances seven times, once for each granularity. In this test the minimum number of nodes, M = 4 and N = 8. The number of partitions, which is P = M k, ranges from 4 to 512. Because N is twice M, the number of slots (S =N k) ranges from 8 to 1024. The results clearly show that increasing granularity reduces load imbalance.
V. EVALUATION
TABLE II
STEADY-STATETHROUGHPUTCOMPARISON(INSTANCE STORAGE)
Uniform Beta Normal Power Law Gamma
Base 394.8 353.5 290.4 206.6 171.2
Coarse - 367.8 (4.0%) 364.0 (25.3%) 381.9 (84.9%) 309.7 (80.9%)
Compact 375.4 (−4.9%) 377.5 (6.8%) 374.6 (29.0%) 383.2 (85.5%) 374.2 (118.6%) Balanced 408.1 (3.4%) 412.6 (16.7%) 442.5 (52.4%) 422.8 (104.7%) 455.9 (166.3%) Complete 446.8 (13.2%) 445.4 (26.0%) 450.1 (55.0%) 448.3 (117.0%) 447.0 (161.1%) unit: queries/second
TABLE III
STEADY-STATETHROUGHPUTCOMPARISON(NFS)
Uniform Beta Normal Power Law Gamma
Base 446.1 383.1 393.3 220.2 176.4
Coarse - 396.4 (3.5%) 379.6 (29.4%) 415.3 (88.6%) 327.9 (85.9%)
Compact 403.7 (−9.5%) 416.2 (8.7%) 407.1 (38.8%) 401.3 (82.3%) 407.8 (131.1%) Balanced 447.6 (0.3%) 440.8 (15.1%) 469.7 (60.1%) 454.0 (106.2%) 485.9 (175.5%) Complete 484.2 (9.0%) 485.6 (26.8%) 495.0 (68.8%) 492.4 (123.7%) 490.0 (177.8%) unit: queries/second
A. Experiment Setup
We conduct our evaluation on Virtual Computing Lab (VCL), a cloud platform provided by NC State University. All servers are equipped with 2-core Intel Xeon CPU and 8GB memory and connected to a 10 Gbit switch. VCL only provides limited storage capacity of local disks or instance storage. This is also the case for many cloud configurations. In fact, a majority of EC2 instance types in Amazon Web Services (AWS) do not have any instance storage. Instead one must mount a remote volume served by a enterprise-level storage system. (AWS calls this elastic block storage–EBS.) We evaluate our approach using both instance storage (local disks) and remote volumes provided by network file system (NFS), backed by NetApp 2554 filer with dual controllers.
High performance computing cluster (HPCC) is an open source data analytics computer developed by LexisNexis Risk Solutions [38] for processing big data. They maintain several clusters with more than 100 nodes, the largest with more than 500, to provide services to their clients.
HPCC provides two types of clusters. Thor is a data refinery that processes large datasets in parallel. It is a batch processing engine that was designed for tasks similar to those that MapReduce handles best. Roxie is a data delivery engine that responds to queries. It finds the answers to requests in an index that is partitioned and, if desired, replicated across the nodes. One of Thor’s jobs is to generate indexes for Roxie.
The division of labor, into data refinery and delivery engine, allows each cluster to be optimized for its task. Thor is optimized for processing large datasets in parallel where the goal is end-to-end throughput. Roxie is optimized to handle massive amounts of concurrent requests with low latency.
The experiments in this paper were conducted on Roxie clusters. Data replication and placement that fit workload demands have direct performance impact on Roxie clusters. Roxie clusters partition and distribute data with two replicas per partition by default. We modified Roxie to incorporate our data placement schemes.
B. Workload Generator and Benchmark Suite
requests to the Roxie cluster. This benchmark is customizable and supports a large number of workload distribution, e.g., the five workload distribution as shown in Figure 4. This benchmark suite is written in Python, and designed for testing query performance at large scale.
Workload is generated from statistics distribution, using SciPy, a Python library for mathematics. We first use the inverse of cumulative density function (CDF) to calculate the lowest and highest possible number in the CDF. This range is then divided by equal-size chunks, and the number of chunks depends on the number of partitions required. For example, if 1024 data partitions are required, this range is equally divided as 1024 chunk points. Since CDF is monotonically non-decreasing, we then calculate the probability difference between points that are next to each other. This probability represents how likely a partition will be accessed. The last step is to generate a random number according to the assigned probability. This process ensures that the generated queries follows the desired workload distribution.
In our evaluation, we are interested in how placement schemes with different partition granularity responds to different types of workload distribution. We consider uniform, beta, normal, power law, and gamma distributions. The beta distribution is defined on the interval [0,1] with two shape parameters, α
and β. We choose α = 2 and β = 2 for the base case of beta distribution. The normal (or Gaussian) distribution has a mean and a standard deviation parameter, which is 0 and 1 in our case. Regarding the power law distribution, it is controlled by the shape parameter and we choose 3 for the base case. The gamma distribution also has a shape parameter and the base case uses 5. The above parameters for each distribution generate workload as shown Figure 4.
C. Benchmark Steps
To best measure the performance, our benchmark service runs one worker node for each Roxie server, which eliminates the performance impact at the client side. We use separate machines from the Roxie cluster on VCL for the benchmark purpose. These machines have the same hardware configuration as in the Roxie deployment. The controller node dispatches requests and synchronizes with workers. Worker nodes ask for request jobs and execute them as soon as possible.
Since our goal is to evaluate the performance improvement by the proposed placement schemes, we run the simulation program to create data placement decisions, as described in Section IV. We provide different parameters to produce the five workload distributions. Then, we also need to specify the smallest cluster size, M, the newly expanded cluster size, N, and the number of unique data partitions, k. In our evaluation, M is equal to 4, and the maximum data size allowed for one node is 128GB. The coarse-grain schemes replicate data on a node basis. Fine-grain schemes, on the other hand, divides the data on a node into 32 equal-size partitions (1GB per partition).
Our next step is to change the data layout in Roxie to reflect the desired data placement decision. The Roxie cluster is restarted to load the new data layout. To avoid cache interference, the file system cache is dropped before every benchmark run.
Last, a workload profile is submitted to the benchmark controller. The controller node generates the query plan accordingly. In this way, the same stream of requests is presented for each benchmark, which allows us to verify results with multiple identical runs and to compare results from different placements. We collect query throughput and latency for the entire benchmark process.
D. Placement Schemes
TABLE IV
DISTRIBUTION PARAMETERS TO GENERATE SHIFTED WORKLOAD DISTRIBUTION
beta power law gamma
base– α= 1, β= 1 shape= 2 shape= 7
base- α= 1.5, β= 1.5 shape= 2.5 shape= 6
base α= 2, β= 2 shape= 3 shape= 5
base+ α= 4, β= 4 shape= 4 shape= 4
base++ α= 5, β= 5 shape= 5 shape= 3
E. Steady-State Throughput
We conduct this evaluation to test the steady-state throughput. We generate 30,000 requests for each of the five workload distributions. To calculate the steady-state throughput, we sample the throughput every second, but exclude the first and last 10% of each benchmark run. We then calculate the average throughput over the sampling period. This measurement ensures we capture the stable throughput, but not the warm-up period (low throughput) and the long-tail period (system is not saturated).
1) Local Storage: Our evaluation starts with storing data required for Roxie queries on local disks. This evaluation involves 8 Roxie nodes and 4 benchmark clients. Table II shows the throughput of proposed replication and placement schemes under different workloads.
First, the base scheme (uniform data placement) and the base case performance is this uniform placement scheme on a uniform workload. The base scheme does not performance well as the skewness of workload increases. For example, the power law workload in the uniform data placement can only achieve 52.3% of the throughput of a uniform workload. The coarse-grained scheme (which replicates according to anticipated workload) achieves 84.9% more throughput than the base scheme on power law.
Second, the two fine-grain approaches,compactandbalancedfurther improve performance overcoarse. The following calculates the throughput different between coarse and the two fine-grain schemes. In the normal workload case, compact and balanced add extra 10.6 and 78.5 queries/sec. In the gamma case,
balance brings extra 146.2 queries/sec, an 47.2% improvement over coarse.
Third, workload-aware data placement is preferable for irregular workload. When the workload is slightly skewed, the fine-grain approaches have lower performance improvement over the coarse-grain approach. On the other hand, when the workload skew increases, the benefits of fine-grain data placement also enlarges.
Overall, workload-aware data placement significantly increases query throughput. Using the finer partition granularity balances the load better and improves throughput. The balanced scheme is very close to the complete scheme in several cases. However, the complete layout often is not feasible in real-world applications because the dataset is too large to fit into one single node (instance storage) or it is to expensive to rent a full compliment of volumes on each node in the cluster.
2) Remote Storage: Next, we evaluate our proposed schemes against data storing on remote storage. The Roxie cluster size and the number of benchmark clients remain the same with the local storage case. Table III details the throughput numbers.
This evaluation confirms the general observations seen in the instance storage test. However, the throughput is higher using remote storage. While somewhat counter intuitive, it is not unheard. This occurs because local storage uses plain commodity disk and the filer high-performance disks as well as aggressive caching. Moreover, the I/O demand is not high so the NFS server is not a bottleneck.
F. Robustness Comparison
TABLE V
REQUESTSROUTED TOSERVERS
Uniform Beta Normal Power Law Gamma
Base 1.30 1.75 2.51 2.91 4.08
Coarse - 1.40 1.90 1.96 2.22
Compact 1.00 1.01 1.07 1.00 1.10
Balanced 1.28 1.34 1.53 1.38 1.40
Complete 1.16 1.29 1.09 1.17 1.23
max:mean
TABLE VI
NORMALIZEDSYSTEMSTATISTICS OFROXIESERVERS
Metrics Base Coarse Compact Balanced Complete
Load Balancing % CPU (mean) 1.00 2.29 2.37 3.11 2.97
% CPU (max:mean) 1.83 1.22 1.12 1.00 1.04
Cache Locality
cache misses (sum) 1.13 1.24 1.00 1.26 1.22
dirty pages (sum) 1.20 1.47 1.00 1.52 1.29
memory footprint (max) 2.11 1.51 1.00 1.17 1.15
Efficiency I/O wait (mean) 1.39 6.73 1.00 2.48 2.55
TCP connections (mean) 2.40 1.53 1.31 1.10 1.00
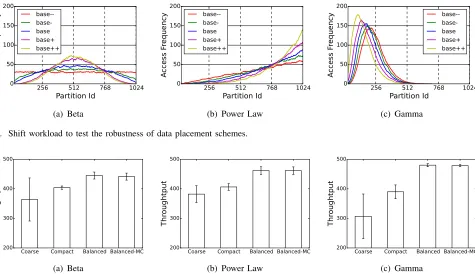
Figure 7 illustrates workload shifts for beta, power law, and gamma workload distribution. We pick different parameters for workload generation. For example, we change the shape parameter in the power law distribution. We can see that workload distribution is either less or more skewed in power law and gamma distribution. For beta distribution, its shape becomes a uniform line in the base– case. Table IV lists detailed parameters to generate the shifted workload distribution.
Figure 8 shows how different placement schemes react to workload shifts. We add a third fine-grain placement scheme that maximizes the number of unique partitions on each nodes, this is sort of the opposite of the compact scheme. The figure shows the average throughput for all five “shifted” workloads and the standard deviation of the placement schemes. The figure indicates that the coarse-grained scheme under performs in both average (lower) and deviation (greater) compared to the fine-grained schemes.
The compact scheme is better than coarse but its performance is not as good as the balance scheme. There is little difference between balanced and balance-MC in either average throughput or standard deviation. This is because there is little difference in the placement of partitions–that is, the balanced scheme tends to have a high degree of unique partitions on each node. In all cases, compact andbalanced
have better performance than the coarsescheme indicating that they are more tolerant of small deviations.
G. Micro Benchmark
We have presented the steady-state throughput in Section V-E. In this section, we further examine why different placement schemes lead to large performance difference. First, we count the number of queries routed to servers during a benchmark run. We use max: mean to measure load distribution of servers. Table V shows that uniform data placement,base, is suboptimal because itsmax:meanvalues are higher then other placement schemes, which indicates the number of requests are not balanced among nodes. The complete layout does not yield the most balanced numbers of requests among Roxie servers because Roxie uses multicast to dispatch requests. It is possible that some requests are redundantly processed in Roxie.
256 512 768 1024 Partition Id 0 50 100 150 200 A cc ess Fr eq ue nc y - base-base base+ base++ (a) Beta
256 512 768 1024
Partition Id 0 50 100 150 200 A cc ess Fr eq ue nc y - base-base base+ base++
(b) Power Law
256 512 768 1024
Partition Id 0 50 100 150 200 A cc ess Fr eq ue nc y - base-base base+ base++ (c) Gamma
Fig. 7. Shift workload to test the robustness of data placement schemes.
Coarse Compact Balanced Balanced-MC 200 300 400 500 Th rou gh tpu t (a) Beta
Coarse Compact Balanced Balanced-MC 200 300 400 500 Th rou gh tpu t
(b) Power Law
Coarse Compact Balanced Balanced-MC 200 300 400 500 Th rou gh tpu t (c) Gamma
Fig. 8. Compare robustness under slight workload mis-predictions. The y-axis starts from 200 for better presentation to tell performance difference.
the entire benchmark runs. Table VI shows system statistics for different placement schemes, and metrics are normalized to the smallest value in each metric group. These metrics are collected from the benchmark runs under the gamma workload. Other workloads present very similar trends in system statistics.
First, we examine CPU utilization across all Roxie nodes. The average CPU utilization indicates whether Roxie is fully saturated, and the max:mean metric tells whether loads are well balanced among Roxie nodes. In the basescheme, CPU utilization is the lowest and load imbalance is the highest, which explains why uniform data placement under performs. Workload-aware replication eliminates load imbalance while improves CPU utilization. Fine-grain partition further reduces load imbalance, as in the balancedscheme. Second, we examine the benefits of packing multiple replicas into the same node, as in the compact
scheme. Table VI clearly shows that cache misses and dirty pages are significantly lower in the compact
scheme. Besides, compact has much lower memory footprint, 17% lower than balanced and 51% less than the coarsescheme. Although the compact scheme outperforms others in cache locality and memory footprint, it does not generates the highest query throughput in our benchmark. A possible explanation is that requests do not greatly benefit from better cache locality. We suspect the compact scheme is useful especially when query applications require costly read operations. We will need to further investigate this case.
Third, we compare CPU utilization wait on I/O and the number of TCP connections for comparing their efficiency. A lower I/O wait value indicates systems does not waste much time on slow I/O operations. The compact scheme, with maximum cache locality, has the lowest I/O wait value. The number of TCP connections at a given time is related to processing efficiency. We observe that thebalancedscheme yields a lower number of TCP connections than the other schemes, which indicates that requests complete more quickly.
VI. CONCLUSION
the workload, hotter data requires higher replication factors, and placement schemes such as maximizing load balancing and minimizing footprint brings significant performance improvement. Our results using an HPCC Roxie cluster show that coarse-grain replication is significantly better than uniform. We further show that increased flexibility of fine-grain replication further improves the performance because it can better balance the load among the nodes. With fine-grain partitioning there is a placement decision. We evaluate compact and balanced and show that the balanced scheme is more robust (can tolerate minor mis-predictions better) and has better overall performance.
For our future work, we plan to implement an elastic controller that incorporates our proposed data placement schemes. This work focuses on optimal data replication and placement. In an elastic system, the gains of the optimal placement must be offset by the cost of data movement. Calculating this data movement cost remains as a future work.
REFERENCES
[1] J. P. Rodrigues, P. Ruivo, P. Romano, and Lu´ıs, “AUTOPLACER: Scalable Self-Tuning Data Placement in Distributed Key-value Stores,” inICAC, 2013, pp. 119–131.
[2] F. Cruz, F. Maia, M. Matos, R. Oliveira, J. Paulo, J. Pereira, and R. Vilac¸a, “MeT: workload aware elasticity for NoSQL,” inEuroSys, 2013, pp. 183–196.
[3] H. C. Lim, S. Babu, and J. S. Chase, “Automated control for elastic storage,” inICAC, 2010, pp. 1–10.
[4] F. Chang, J. Dean, S. Ghemawat, W. C. Hsieh, D. A. Wallach, M. Burrows, T. Chandra, A. Fikes, and R. E. Gruber, “Bigtable: A Distributed Storage System for Structured Data,”ACM Trans. Comput. Syst., vol. 26, no. 2, pp. 1–26, 2008.
[5] “Apache HBase,” 2017. http://hbase.apache.org
[6] A. Lakshman and P. Malik, “Cassandra: a decentralized structured storage system,”ACM SIGOPS Oper. Syst. Rev., vol. 44, no. 2, p. 35, 2010.
[7] A. Adya, D. Myers, J. Howell, J. Elson, C. Meek, V. Khemani, S. Fulger, P. Gu, L. Bhuvanagiri, J. Hunter, R. Peon, L. Kai, A. Shraer, A. Merchant, and K. Lev-Ari, “Slicer: Auto-sharding for datacenter applications,” inOSDI, 2016, pp. 739–753.
[8] C. Curino, E. Jones, Y. Zhang, and S. Madden, “Schism: a workload-driven approach to database replication and partitioning,”Proc. VLDB Endow., vol. 3, no. 1-2, pp. 48–57, 2010.
[9] K. R. Krish, A. Khasymski, A. R. Butt, S. Tiwari, and M. Bhandarkar, “AptStore: Dynamic storage management for hadoop,” in CloudCom, vol. 1, 2013, pp. 33–41.
[10] G. Ananthanarayanan, S. Agarwal, S. Kandula, A. Greenberg, I. Stoica, D. Harlan, and E. Harris, “Scarlett : Coping with Skewed Content Popularity in MapReduce Clusters,”Proc. sixth Conf. Comput. Syst. ’11, pp. 287–300, 2011.
[11] J. C. Corbett, J. Dean, M. Epstein, A. Fikes, C. Frost, J. J. Furman, S. Ghemawat, A. Gubarev, C. Heiser, P. Hochschild, W. Hsieh, S. Kanthak, E. Kogan, H. Li, A. Lloyd, S. Melnik, D. Mwaura, D. Nagle, S. Quinlan, R. Rao, L. Rolig, Y. Saito, M. Szymaniak, C. Taylor, R. Wang, and D. Woodford, “Spanner: Google’s globally distributed database,”ACM Trans. Comput. Syst., vol. 31, no. 3, pp. 1–22, 2013.
[12] A. Pavlo, C. Curino, and S. Zdonik, “Skew-aware automatic database partitioning in shared-nothing, parallel OLTP systems,” in SIGMOD, 2012, pp. 61–72.
[13] A. Leff, J. L. Wolf, and P. S. Yu, “Replication Algorithms in a Remote Caching Architecture,” IEEE Trans. Parallel Distrib. Syst., vol. 4, no. 11, pp. 1185–1204, 1993.
[14] S. Zaman and D. Grosu, “A Distributed Algorithm for the Replica Placement Problem,”IEEE Trans. Parallel Distrib. Syst., vol. 22, no. 9, pp. 1455–1468, sep 2011.
[15] N. Laoutaris, O. Telelis, V. Zissimopoulos, and I. Stavrakakis, “Distributed selfish replication,” IEEE Trans. Parallel Distrib. Syst., vol. 17, no. 12, pp. 1401–1413, 2006.
[16] “Apache hadoop,” 2017. http://hadoop.apache.org
[17] S. A. Weil, S. A. Brandt, E. L. Miller, D. D. E. Long, and C. Maltzahn, “Ceph: a scalable, high-performance distributed file system,” inOSDI, 2006, pp. 307–320.
[18] R. Cattell, “Scalable SQL and NoSQL data stores,”ACM SIGMOD Rec., vol. 39, no. 4, p. 12, 2011. [19] “Mongodb,” 2017. https://www.mongodb.com
[20] “Data Partitioning and Load Balancing in Parallel Disk Systems,”VLDB J., vol. 7, no. 1, pp. 48–66, 1997.
[21] D. Kossmann, “The state of the art in distributed query processing,”ACM Comput. Surv., vol. 32, no. 4, pp. 422–469, 2000. [22] M. Y. Eltabakh, Y. Tian, F. ¨Ozcan, R. Gemulla, A. Krettek, and J. McPherson, “CoHadoop: flexible data placement and its exploitation
in Hadoop,”Proc. VLDB Endow., vol. 4, no. 9, pp. 575–585, 2011.
[23] J. Xie, S. Yin, X. Ruan, Z. Ding, Y. Tian, J. Majors, A. Manzanares, and X. Qin, “Improving MapReduce performance through data placement in heterogeneous Hadoop clusters,” inIPDPSW, 2010, pp. 1–9.
[24] “Apache Spark,” 2017. http://spark.apache.org
[25] B. Trushkowsky, P. Bod´ık, A. Fox, M. J. Franklin, M. I. Jordan, and D. A. Patterson, “The scads director: Scaling a distributed storage system under stringent performance requirements,” inFAST, 2011, pp. 12–12.
[26] D. Gmach, J. Rolia, L. Cherkasova, and A. Kemper, “Workload analysis and demand prediction of enterprise data center applications,” IISWC, pp. 171–180, 2007.
[28] A. Khan, X. Yan, and S. Tao, “Workload characterization and prediction in the cloud: A multiple time series approach,” in2012 IEEE Network Operations and Management Symposium, 2012.
[29] M. Akdere, U. C¸ etintemel, M. Riondato, E. Upfal, and S. B. Zdonik, “Learning-based query performance modeling and prediction,” inICDE, 2012, pp. 390–401.
[30] P. Barford and M. Crovella, “Generating representative Web workloads for network and server performance evaluation,” ACM SIGMETRICS Perform. Eval. Rev., vol. 26, no. 1, pp. 151–160, 1998.
[31] M. Newman, “Power laws, pareto distributions and zipf’s law,”Contemporary Physics, vol. 46, no. 5, pp. 323–351, 2005.
[32] J. Dilley, R. Friedrich, T. Jin, and J. Rolia, “Web server performance measurement and modeling techniques,”Performance evaluation, vol. 33, no. 1, pp. 5–26, 1998.
[33] V. V. Panteleenko and V. W. Freeh, “Web server performance in a wan environment,” inICCCN, 2003, pp. 364–369.
[34] K. Sripanidkulchai, B. Maggs, and H. Zhang, “An analysis of live streaming workloads on the internet,” in ACM SIGCOMM, 2004, pp. 41–54.
[35] G. Urdaneta, G. Pierre, and M. Van Steen, “Wikipedia workload analysis for decentralized hosting,” Computer Networks, vol. 53, no. 11, pp. 1830–1845, 2009.
[36] A. Arampatzis and A. van Hameran, “The score-distributional threshold optimization for adaptive binary classification tasks,” 2001, pp. 285–293.