ANALYSIS OF T H E QUANTITATIVE INHERITANCE OF BODY SIZE
DIFFERING AT A SMALL NUMBER O F LOCI' I N MICE, VI: DIALLEL CROSSES BETWEEN LINES
C. K. CHAI
The Jackson Luboratory,z Bar Harbor, Maine 04609 Received October 8, 1970
T H E chief problem inherent in quantitative genetic studies lies in the com- plexity of traits involving many genes which interact mutually and also with the environment. Such interactions are often so great that the effects of individual genes may be overshadowed, and sometimes results disagree (see
JINKS
1955). I n a n attempt to circumvent such difficulties in our study of inheritance of body size in mice, we designed a breeding scheme dealing with a small number of genes with relatively large effects on a genetically homogeneous background. The breeding was begun by crossing strains LG (large body size) and SM (small body size), and was continued by repeated backcrossing to LG, then inbreeding from the fifth backcross generation for 20 or more generations. During back- crossing and inbreeding we concurrently selected for large and small body sizes, thus forming sublines high in homozygosity, and differing a t a small number of loci with relatively large effects. Results from the backcrossing and the subline differences obtained by inbreeding were published previously (CHAI 1968).This paper concerns the results of our analyses of the F, 5
x
5 diallel crosses of the LG sublines according to the method of HAYMAN (1954),
which we chose because it is descriptive in standard genetic terms and suitable for our present breeding scheme. The estimates of genetic parameters as based on a small number of genes are more revealing than those in our previous studies involving hybrid generations from LG X SM crosses (CHAI 1956a, 1957). What may be considered sex-limited effects of genes on body size are also disclosed. As a supplementary approach to the understanding of genetic differences between the sublines, ad- ditional crosses were made with the SM strain in order to test for two alternative hypotheses, mutation us. gene interaction, with results indicating polygenic mu- tation as described herein.MATERIALS A N D METHODS
Diallel crosses: Five closely related lines of mice were used as pqrents for the F, set of dialleI crosses, LG/Ckc, B5LG/LA, B5LG/LB, BSLG/SC, and BSLG/SE, thelatter four lines being de- rived from LG/Ckc. T h e production history of these lines follows.
- ' > - >
1 This work was supported in part b y NIH grant GM-05550 ffom the h h o n a € Institute of General Medical Sciences and by an allocation from NIH General Research Support grant FR 05545 from the Division of Research Resources to The Jackson Laboratory.
The principles of laboratory animal care as promulgated by the National Society of Medical Research are obse red in this laboratory.
300 C. K. C H A I
The parental lines LG/Ckc and SM/Ckc were produced by selecting f o r large and small body sizes respectively, followed by inbreeding. Repeated backcrossing to the LG line was made for five generations, with selection starting at the 2nd (Figure 1). The essential purpose of the re- peated backcrossing and selection for large body size was to transfer genes with plus effects from SM not present in LG and introduce them into the LG genetic background; and that for small body size was primarily to transfer genes with strong minus effects from SM. Using mice from the 5th backcross generation, we inbred with the same selection procedures for nine more generations, maintaining five sublines. At the 9th generation we split from one major subline of each to four more sublines, and continued the inbreeding (CHAI 1966). At the 10th to 12th generation after splitting, we used two sublines from those selected for small body size, B5LG/SC and B5LG/SE, and two from those selected for large body size, BSLG/LA and BSLG/LB, which, in addition to the LG line then at the 40th and 43rd generation of inbreeding, were used as the parental inbred lines for the diallel crosses. Our only reason for using these particular sublines in the diallel crosses was that they consisted of more mice than the other sublines so that mice of comparable age were available for starting the matings at the same time. The breeding scheme for producing the LG sublines is illustrated in Figure 1.
Birth, weaning (28-day), and 60-day body weights were taken for each mouse as an index of body size. Within one week after taking the 60-day body weights we set eight breeding pairs for each cross; among them one or two matings were unproductive in some cases. An average
B2LG
d b
\'B3LG/S B3LG/L r(
\ l
I,
S M
T
V
Gen. 0
85LG/SA B5LG/ LB
"
I
Gen. 10
Gen.
20-23 A B CD
E A B C D E*
*
* *
t Used for d i a l l e l crosses
BODY SIZE I N MICE 301 of three litters was used from each mating. Characteristically, litter sizes were large compared to those of other inbred strains, but when more than eight were produced we culled to eight. Litter sizes at weaning were usually from 6 to 8, those smaller than 5 were rare. For the parental lines, since they were sublines constantly carried in our stocks, 10 to 20 matings were used for each.
Diallel analysis: As previously mentioned, we followed the methods of HAYMAN (1954) and his notations in the analysis of the diallel table. For convenience, a brief description d the noL tations used in this paper is given below.
D =4uud2
F = 8 uu(u - u)dh
H I = 4 uuhz
H , = 16 uvh2
E = environmental variances
where d represents additive genetic effect and h the dominance effect, and U and U the frequen- cies of the plus and minus alleles of each locus, so that U
+
U = 1. These equations are based on the polygenic hypothesis of MATHER (1949).With the five parental lines and their 20 F, hybrids referred to jointly as the L, generation, the following variances and covariances were necessary for computing the genetic variances:
VoLo = variance of the parents
VoLol = the mean covariance between the parents and the arrays V I L l = mean variance of the arrays
VoLI = the variance of the means of the arrays
W,, = the covariance between the nonrecurrent parents and their offspring in rth array V,, = variance of the means in one array around the array mean.
The proportions of genetic and environmental variances contained in each of the variances and covariances are as follows:
VoLo = D f E W , = l / , D - X F , + E / n WoLol = % D - X F
+
E / nV , = % F ,
+
% H I4-
( E 4- % ( n - 1 ) E ' ) / n V I L l = % D - % F f % H l + ( E + ' / z ( n - l ) E ' ) / n V D L , = X D - % F4-
% H l 4- ( E -I- % ( n - 2)E')/n2where E is the environmental variance of the parents and E' of the F, hybrids. The genetic variances were estimated from the above simultaneous equations. In addition, W , and V , were used for testing nonallelic interactions. When significant differences of W , - V , from homo- geneity and significant differences of unit regression coefficients of W , on V , were found, indi- cating the presence of nonallelic interaction, further anaIysis of the diallel table was not profitable (HAYMAN 1954).
Crosses of SM/CkcO X BSLG/LB$ and S M / C k c Q x BSLG/SC$: Crosses were made of SM/Ckc with B5LG/LB and B5LG/SC males, in a search for factors contributing to the dif- ference between the two LG sublines.
It has been puzzling that mice of the B5LG/S subIines derived by backcrossing with concur- rent selection for small body size became larger than those of the contemporary sublines of B5LG/L selected for large body size, and that the B5LG/S subline mice were also larger than the parental line LG. These genetic differences were d e f ~ t e l y established by comparing their means at the different inbred generations (CHAI 1967), and in the diallel crosses as will be seen later. We are not sure, however, whether such genetic changes in the BSLG/S sublines were due to mutation, or to the introduction into LG from SM of a gene or genes with positive effect on body size.
302 C. K. CHAI
were not made; the extreme difference in body size makes matings of this type unsuccessful. Furthermore, different maternal influences might affect body size. Sixteen matings were made for each cross, nine being productive in the B5LG/SC cross and 10 in the B5LG/LB cross. Man- agement for these matings was the same as for the diallel crosses.
RESULTS
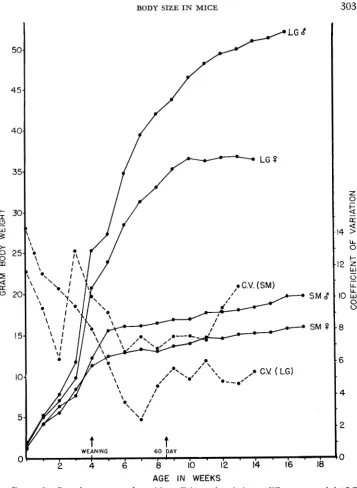
Growth curue: Growth curves for the mice of the two parental strains
LG
and SM were given in a previous paper (CHAI 1966). In Figure 2 coefficients of vari- ation have been added to show the relative effects of environment and genes at different ages. It can be seen that the least variation occurs at about 2 months. Alarge proportion of the early age variations may be due to maternal influences. It must be kept in mind that development of these strains is by selection for 60-day body weights, and that only those weights were used for later diallel analysis.
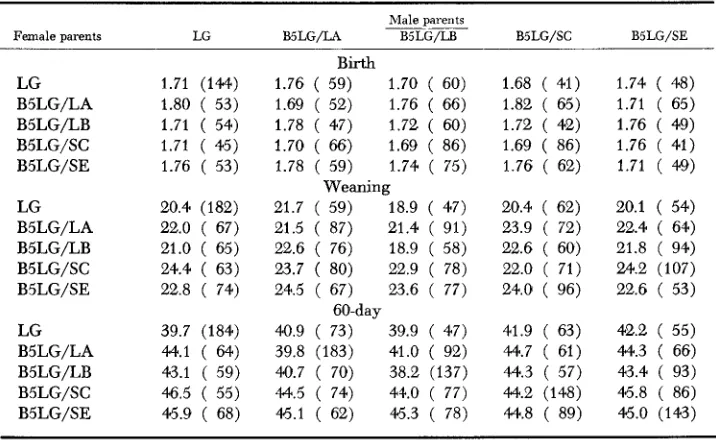
Diallel crosses: The means for birth, weaning, and 60-day weights, together with the number of mice in each cross, are given in Table l b for males and in Table l a for females. On the main diagonal are the mean weights for the progeny of the inbred lines; off the main diagonal are the means for the F, hybrids. The results of analysis of variance of body weights at each age are given in Table 2 for paternal and maternal effects, e.g., between rows and between columns of the diallel tables showing some significant differences in birth weights, more at wean- ing, and most at the 60-day weights. To save space, variances in body weights
TABLE l a
Mean birth, weaning, and 60-day b d y weights ( g r a m ) of F , female progeny produced b y 5 x 5 diallel crosses of LG/Ckc and its sublines, and the progeny of the parental lines
Female parents LG
Male parents
____
BSLG/LA BSLG/LB BSLG/SC
LG 1.87 (151)
B5LG/LA 1.92 ( 56) B5LG/LB 1.85 ( 63) B5LG/SC 1.81 ( 58) B5LG/SE 1.83 ( 47)
LG 18.9 (165)
B5LG/LB 19.6 ( 55) B5LG/SC 22.6 ( 53) B5LG/SE 21.4 ( 72) B5LG/LA 19.9 ( 55)
LG
.
33.0 (174) B5LG/LA 34.2 ( 57) B5LG/LB 32.9 ( 60) B5LG/SC 36.9 ( 51) B5LG/SE 37.2 ( 61)Birth
1.79 ( 68) 1.79 ( 62) 1.76 ( 78) 1.82 ( 72) 1.84 ( 55) 1.83 ( 73) 1.84 ( 69) 1.78 ( 71) 1.87 ( 66) 1.82 ( 84)
19.8 ( 58) 18.6 ( 52) 19.8 ( 69) 20.2 ( 72) 21.2 ( 82) 18.2 ( Sa)
21.7 ( 67) 22.0 ( 56) 22.3 ( 58) 21.7 ( 63)
32.9 ( 63) 32.6 ( 52) 31.7 (170) 32.4 ( 75) 32.5 ( 77) 31.0 (155) 35.7 ( 65) 35.3 ( 59) 36.4 ( 54) 35.5 ( 61)
Weaning
60-day
1.71 ( 57) 1.85 ( 67) 1.86 ( 50) 1.78 ( 94) 1.81 ( 83)
19.7 ( 38) 22.2 ( 70) 21.3 ( 55) 20.3 ( 60) 22.2 ( 74)
34.1 ( 44)
35.1 ( 63) 34.8 ( 55) 34.7 (135) 36.2 ( 72)
BSLG/SE
1.87 ( 46) 1.78 ( 67) 1.87 ( 63) 1.86 ( 79) 1.84 ( 46)
19.6 ( 50) 21.5 ( 62) 21.1 ( 83) 22.1 ( 51) 21.1 ( 49)
34.9 ( 54) 34.0 ( 67) 34.5 ( 84) 36.9 ( 50) 35.5 (136)
BODY SIZE I N MICE 303
S M ,
SM
WEANING 60 DAY
I
2 4 6 8 IO 12 14 16 18
AGE IN WEEKS
z
0
I- 5
a
14
3
L L 0I- 12
6
IO
kJ
-0
LL
0
0
8
6
4
2
0
FIGURE 2.-Growth curves together with coefficients of variation at different ages of the LG and SM strains of mice that were the parental strains for producing the sublines used in the diallel crosses.
for each parental type and for the F, hybrid are given only for the 60-day age (Table 3 ) , at which no large differences between reciprocal crosses were indi- cated by the relative magnitudes of the means and variances.
304 C. K. C H A I
TABLE l b
Mean birth, weaning, and 60-day body weights (grams) of F , male progeny produced b y 5 X 5 diallel crosses of LG/Ckc sublines, and the progeny of the parental lines
Female parents LG
Male parents
B5LG/LA B5LG/LB B5LG/SC B5LG/SE
LG B5LG/LA B5LG/LB B5LG/SC B5LG/SE LG B5LG/LA B5LG/LB B5LG/SC B5LG/SE LG B5LG/LA B5LG/LB B5LG/SC B5LG/SE
1.71 (144) 1.80 ( 53) 1.71 ( 54) 1.71 ( 45) 1.76 ( 53)
20.4 (182) 22.0 ( 67) 21.0 ( 65) 24.4 ( 63) 22.8 ( 74)
39.7 (184)
43.1 ( 59)
45.9 ( 68) 44.1 ( 64)
46.5 ( 55)
BiI-th
1.76 ( 59) 1.70 ( 60) 1.69 ( 52) 1.76 ( 66) 1.78 ( 47) 1.72 ( 60) 1.70 ( 66) 1.69 ( 86) 1.78 ( 59) 1.74 ( 75)
21.7 ( 59) 18.9 ( 47) 21.5 ( 87) 21.4 ( 91) 22.6 ( 76) 18.9 ( 58) 23.7 ( 80) 22.9 ( 78) 24.5 ( 67) 23.6 ( 77)
40.9 ( 73) 39.9 ( 47) 39.8 (183) 41.0 ( 92) 40.7 ( 70) 38.2 (137) 44.5 ( 74) 4+.0 ( 77) 45.1 ( 62) 45.3 ( 78)
Weaning
60-day
1.68 ( 41) 1.82 ( 65) 1.72 ( 42) 1.69 ( 86) 1.76 ( 62)
20.4 ( 62) 23.9 ( 72) 22.6 ( 60) 22.0 ( 71) 24.0 ( 96)
41.9 ( 63) 44.7 ( 61)
44.2 (148) 44.8 ( 89) M.3 ( 57)
1.74 ( 48) 1.71 ( 65) 1.76 ( 49) 1.76 ( 41) 1.71 ( 49)
20.1 ( 54) 22.4 ( 64) 21.8 ( 94) 24.2 (107) 22.6 ( 53)
42.2 ( 55) 44.3 ( 66) 43.4 ( 93) 45.8 ( 86) 45.0 (143)
The total number of mice used in each cross is given in parentheses.
BSLG/LA and BSLG/LB and the parental LG (Table l a , I b )
.
The former two sublines were selected for small body size whereas the latter two were selected for large body size, as has been mentioned; the unexpected results have been dis- cussed in a previous paper (CHAI 1968). The results of a breeding test to deter- mine the genetic basis for those results will be given later in this section.TABLE 2
Analysis of variance for LG/Ckc subline difference separated into female and male parental effects on body weights of F , progeny in 5 x 5 diallel cross
Sources of variation M.S. Birth P M.S. Weaning P M . S . 60-day P
Male progeny
Between sublines (maternal) Between sublines (paternal) Maternal x Paternal Error
Female progeny
Between sublines (maternal) Between sublines (paternal) Maternal x Paternal Error
6.4 >.05 23.2 <.01 12.5 <.05
3.9
12.7 <.05 .8 >.05 8.6 >.05 4.0
712.0 <.Ol 135.9 <.Ol
64.5 < .O l 12.9
377.6 <.Ol 109.6 <.01 40.2 <.01
8.7
1853 <.Ol 796 <.01 111 <.Ol
12
899 <.Ol 4+2 < . O l 34 <.01
6.4
BODY SIZE I N MICE
TABLE 3
Variances for the 60-day body weights of F , female and male progeny in a 5 x 5 diallel cross and progeny of the parental lines
305
Female Darents LG BSLG/LA
LG B5LG/LA B5LG/LB B5LG/SC B5LG/SE
LG B5LG/LA BSLG/LB B5LG/SC BSLG/SE
Female progeny
6.3 6.5
7.1 4.4
8.4 6.2
3.7 5.4
10.9 6.0
13.0 13.4
11.7 8.8
8.9 7.2
13.5 11.8
11.5 14.8
Male progeny
Male parents
BSLG/LB B5LG/SC BSLG/SE
5.8 8.1 7.9
4.8 7.8 9.4
4.1 5.0 6.1
4.5 5.6 8.5
7.2 6.8 6.5
14.8 8.7 15.8
9.7 10.9 12.1
7.1 8.5 11.5
10.6 12.9 19.5
13.2 13.5 8.8
Since there were reciprocal differences in the crosses, the mean reciprocals were used for the entries of the diallel table and for the following analyses.
Bartlett tests for the homogeneity of the differences between W , and V , (Table 4 ) for both male and female data were not significant. The equations resulting from the regression analysis of W , on V , are given below.
0
W ,
= 0.313 f 0.993 V,, e, = 0.151, eb = 0.0748
W ,
= 0.909+
1.017 Vr, e, I 0 . 1 4 1 , eb = 0.036where e, is the error of the constant and eb the error of the regression coefficient.
The regression coefficients, which are not significantly different from one, check remarkably well between the sexes.
The relationship of W , and V , was graphed (Figure 3 ) , the degree of domi- nance extrapolated according to HAYMAN (1954), and regression lines were fitted from the above equations. A parabola based on W 2 , = V,,,V, (V,,, representing the variance of parental lines), intercepts the regression lines at two points, the lower indicating an inbred line with 100 percent plus genes and the upper an inbred line with 0% plus genes. The regression lines were subdivided into seg- ments at the 25%, 50%. and 75% points to show the percentages of plus genes. A tangent was drawn from the point where the parabola was cut by a line drawn from the 50% point of the regression line parallel to the X axis. The tangent intercepts the Y axis at point B,AB/OB = D/H,. Therefore, (AB/OB)ll2 provides an estimate of the degree of dominance, which was 0.61 for females and 0.66 for males.
306 C. K. CHAI
TABLE 4
Variances and covariance for the m a n 60-day body weights in the 5 x 5 diallel crosses
Scale Sex VULO WULOl VOL 1 V r Vrl
__
Arithmetic 0 3.698 1.987 1.094 1.686 1.987 2.613 3.038 0.436 0.357
8 9.325 4.004 1.721 3.043 3.506 4.842 6.432 0.243 0.195 Logarithmic 0 .0033 .0018 .w10 .0015 ,0020
.0023
,0027 ,0003 ,0003 8 ,0053 ,0022 ,0009 ,001 7 ,001 9 .OW7
.0036
.om1
.0001
IVrl
2.452 2.903 3.237 0.531 0.81 1 4.598 5.965 7.288 0.941 1.227 .0024 ,0025 ,0029
.m
,0007
.Om6
.0034 ,0041
.ow
,0007
the harmonic mean number of mice for all crosses and parental types, treating the individuals of each genetic group as replications. Since there were no large differences in the variances between the parental types and the F, hybrids, we used the same error variances for both E and E'.
From the above statistics we computed the following genetic parameters:
( H , / D ) 1 / 2 = the mean degree of dominance, uu = the mean proportion of plus genes
x
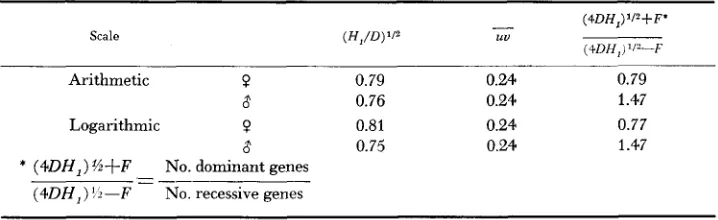
the mean proportion of the minus genes, and the ratio of the number of dominant to the number of recessive genes. Values for these estimates are given in Table 6. The values for ( H , / D ) 1 / 2 check very well between the two sexes, and with those obtained from the graphs, but there is a discrepancy between the fe- male and male data in the estimates of the ratio of the number of dominant to the number of the recessive genes. In females this ratio may not be different from 1: 1; in males it is about 3 : 2 , a discrepancy which is due to the difference in the signs of the F values. The negative F for females may not be significantly differ- ent from zero, but the positive F for males is.TABLE 5
Estimaies of genetic variances based on male and female F , progeny of 5 x 5 diallel crosses
D F H l fI* E
0 3.60 k .12 -0.67 k .I2 2.25 f .33 2.18 k .30 .094
BODY SIZE I N MICE 307
L’ I -
LG
2 - B5LG/LA 3
-
B5LG/LB4 - B5LG/SC 5- BSLG/SE
9
Wr r0.313+
0.993 Vrd
W r = 0.909+ 1.017 VrVr
(Grams)FIGURE 3.-A variance-covariance diagram illustrating the dominance relationship according to HAYMAN (1954). The solid lines are for males and the broken lines for females. A and B are the intercepts at the W r axis, those with primes are for males and those without are for females. See text for explanation.
An analysis of the 60-day body weights made by logarithmic transformation differed only slightly from one made arithmetically. For the sake of space, only the statistics for genetic parameters on logarithm are given (Table 5 ) , and the means and variances are omitted.
308 C . K. C H A I
TABLE 6
Estimates of genetic parameters based on male and female progeny of 5 x 5 diallel crosses
( 4 D H J
+
F'-
uu
(4DH,)'I"--F
Scale ( H I D ) '1'
Arithmetic 0 0.79 0.24 0.79
8 0.76 0.24 1.47
Logarithmic 0 0.81 0.24 0.77
8 0.75 0.24 1.47
* (4DH, ) % f P No. dominant genes -
(4DHI)'2--F No. recessive genes
different crosses are shown in Table 7. The F, means for males and females of the BSLG/SC cross were significantly greater than for those of the BSLG/LB cross. and more so in the 60-day than in the weaning weights. The differences were very close to half of the differences between the means of B5LG/SC and BSLG/LB, suggesting that a gene or genes with an additive effect on body size may be present in B5LG/SC mice but not in either LG or SM.
DISCUSSION
The degree of dominance represents the ratio of deviation of a heterozygate to that of the dominant homozygote from the midparental value, the most important genetic parameter in studying quantitative inheritance concerning heterosis. It should be kept in mind that the ratio represents a measurement of the mean effects of the genes. Obviously, the larger the number of loci involved, the less the resolution, as far as the properties of individual genes are concerned.
In our earliest work the degree of dominance was found to be rather small when F, means were compared with the midparental values in the cross be- tween LG and SM (CHAI 1956a). Later, using the first backcross generations. we estimated the mean degree of dominance at 1.6 (CHAI 1957), a discrepancy which apparently may indicate some cancellation between loci with minus and plus effects in the F, generation, and gene interaction in the backcrosses.
TABLE 7
Means and variances of body weights (grams) for mice of F , progeny from crosses of SM/Ckc
as female parent and BSLG/SC and B5LG/LB as male parent
Sex of Birth Weaning 60-day
Sire offspring No. Mean Var. No. Mean Var. No. Mean Var.
B5LG/SC 8 30 1.6 .05 51 20.7* 10.7 52 33.2* 8.5 B5LG/LB 8 59 1.7 .02 72 17.8 7.7 72 30.2 4.2 B5LG/SC P 32 1.6 .04 48 19.2* 6.9 48 25.9* 8.5 B5LG/LB 0 59 1.6 .03 89 17.3 4.4 89 23.9 4.6
BODY SIZE I N MICE 309
LAGERVALL (1961) proposed to measure dominance by studying an increase or decrease in the means for the character following inbreeding but, as he himself pointed out, this procedure would not necessarily be free from nonallelic inter- action either. After analyzing a number of plant breeding experiments, JINKS
( 1955) stated that they found no evidence of overdominance without also finding evidence for the simultaneous presence of nonallelic interaction. Unless there is only one locus involved, it is difficult to assure that complete freedom from non- allelic interaction in the estimate of dominance has been achieved.
In an attempt to circumvent such complications we dealt with only a small number of genes. Note that in the V,/W, graph the points appear to fall into two groups: one at the lower left comprising the two B5LG/S sublines, and one at the upper right made up of the two B5LG/L sublines and the LG; some of the distances between the points in the latter group are greater than between those of the former. If I were to speculate regarding the number of genes con- tributing to the difference between the two groups, I would be inclined to say that it consisted of one or two major genes plus perhaps a few minor genes. Such a speculation would, however, be based intuitively on the breeding system. Regarding quantitative traits of a high degree of complexity, such as body size, it is not profitable to estimate the number of genes involved since the magnitude of effects of each gene may vary greatly, contributing different biological effects (SPICKETT and THODAY 1966; CHAI 1970). There is no reason to assume that gene effects as measured on a trait under study are equal. However, it is important to investigate the properties of the major genes concerned. In the present breeding system, the degree of dominance represents the most realistic genetic parameter. Diallel analysis offers an improvement on previous designs for quantitative genetic studies since it emphasizes the usage of means. HAYMAN’S analysis pro- ceeds essentially as MATHER’S (1949) did for a single cross.
HAYMAN
derived his diallel analysis based on the following assumptions: (1 ) diploid segregation; (2) no difference between reciprocal crosses; (3) independent action of nonallelic genes; (4) no multiple allelism; (5) homozygous parents; (6) genes independ- ently distributed between the parents. Our original inbred lines LG andSM
were derived by selective breeding followed by inbreeding. When backcrossing for the production of the BSLG sublines began, inbreeding in LG had gone through at least 20 generations. When diallel crosses were made, B5LG mice were in the 20th to 22nd and LG mice were in the 40th to 43rd generations of inbreeding. The parental lines used in the present diallel crosses therefore satisfy assumptions( 1 )
,
(4),
and (5). The regression analysis did not reveal significant nonallelic interactions (3). There is no evidence that genes are not independently distribut- ed (6). Our data did show differences between reciprocal crosses (2). but we used HAYMAN’S method of treatment (HAYMAN 1954) for this.310 C. K. C H A I
We consider the results on the degree of dominance reasonable in magnitude. The true genetic property of polygenes with major effects can be better studied when background noise and nonallelic interactions are reduced. The question remains how well these results can be applied in general, since the genes involved in our present breeding system cover only a narrow range. We realize that the gain in resolution means accompanying loss in field range, but we cannot achieve both objectives at the same time.
The differences between male and female F values are surprising. For females the F value is not different from zero, but it is f o r males. Since F is involved in the estimation of the ratio of the number of dominant to the number of recessive genes. a tentative explanation is that this is due to a sex-limited effect comparable to hornless condition in goats. There may be a gene or genes affecting male hor- mone production having pleiotropic effects; there is evidence of genetic differ- ence in the level of androgen secretion between inbred strains of mice (CHAI
1956b). Alternatively, it may be that there is a gene or genes affecting body growth which is activated only in the presence of male hormones. The ratios of the number of dominant to the number of recessive genes thus vary between sexes.
The uu value is the product of the average frequency of positive and minus genes distributed in the parental lines, varying from 0 to .25. As a firsthand ap- proximation, the values we obtained suggest that the gene frequencies are
.4
and .6 for the plus and minus alleles, respectively. The B5LG/S sublines carried more of the positive and the other three the minus alleles, whatever the number of loci involved. It should be kept in mind that the uu value is not a sensitive indicator, for between the gene frequencies of.4
and .5, it varies only from .24 to .25.The differences in the means between the two F, progenies, SM x B5LG/SC and SM x BSLG/LB, indicate that the genetic differences between the LG and its sublines were expressed on the heterozygous genetic backgrounds. The main objective in making these crosses was to detect the origin of the genes which caused BSLG/S mice to be larger than LG and B5LG/L. Two explanations were considered: gene mutation or gene transfer. A gene or genes could have mutated and caused increase of body size. Alternatively, a gene, not present in LG, was introduced from SM into B5LG/S but not into B5LG/L. Assuming one locus was involved, the two F, types would be a heterozygote and a homozygous recessive, say A a and aa, in the case of mutation; and A A and A a in the case of gene trans- fer. Plus genes are usually dominant to minus genes, and the differences between the two F, genotypes seem more likely due to mutation than gene transfer.
The author wants to thank Mr. JOHN CARTER for technical assistance and Mr. ROBERT S. RUPP for help in writing the program used in the computation.
SUMMARY
BODY SIZE I N MICE 31 1
body size. The latter four lines were derived from the LG line by repeated back- crossing followed by inbreeding. (Differences between them are believed to be due to a small number of genes.) The analyses, performed according to the method of HAYMAN (1954), and having a n estimated degree of dominance of about 0.7. revealed what we tentatively concluded to be a sex-limited effect of genes an body size. Additional F, crosses of BSLG/LA and BSLG/SC with the SM strain to determine the origin of the gene or genes contributed to the differ- ence between the BSLG/L and BSLG/S sublines. The results seem to be better explained by gene mutation than gene transfer from the SM.
LITERATURE CITED
CHAI, C. 6., 1956a Analysis of quantitative inheritance of body size in mice. I: Hybridization and maternal influence. Genetics 41: 157-164. -, 1956b Comparison of two inbred strains of mice and their F, hybrid in response to androgen. Anat. Rec. 126: 269-282. --, 1957 Analysis of quantitative inheritance of body size in mice. 111: Dominance. Genetics
42: 601-607. -, 1966 Characteristics in inbred mice populations plateaued by direc- tional selection. Genetics 54: 743-753. -, 1968 Analysis of quantitative inheritance of body size in mice. V: Effects of small number of polygenes on similar genetic backgrounds. Genet. Res. 11: 239-246. --, 1970 Genetic basis of leukocyte production in mice. J. Heredity 61: 67-71.
HAYMAN, B. I., 1954
JINKS. J. L.. 1955 A survey of the genetical basis of heterosis in a variety of diallel crosses. Heredity 9: 223-238.
LAGERV-ALL. P. M., 1961a Quantitative inheritance and dominance. 11: The genic and the dominance variance under inbreeding. Hereditas 47: 11 1-130. -, 1961b Quantitative inheritance and dominance. IV: The average degree of dominance. Hereditas 47 : 197-202.
The theory and analysis of diallel crosses. Genetics 39: 789-809.
MATHER, h.. 1949
SPICKETT. S. G. and J. M. THODAY, 1966
Biometrical Genetics. Dover Publ. Inc., New York.