A simulation tool for ALICE storage and
computing resource usage
Armenuhi Abramyan1,1, Narine Manukyan1,2, Tim Hallyburton2, Latchezar Betev2, Predrag
Buncic2 and Ara Grigoryan1
1A.I. Alikhanyan National Science Laboratory Foundation, 2 Brothers Alikhanyan str., 0036 Yerevan
Armenia
2CERN, CH-1211, Geneva 23 Switzerland
Abstract. The LHC experiments produce many tens of petabytes of data each year, which must be stored, processed and analyzed. The CPU and storage resources required for these activities are planned for and requested on yearly basis. To make a better resource planning, a more fine-grained time prediction for the resource utilization is necessary, taking into account the LHC running conditions and schedule, the experiment-specific data management policies, scientific conferences demands and other criteria. To that end, we developed a flexible and highly configurable simulation tool, which performs a Discrete Event Simulation of the ALICE data flow processes. The tool consists of a Web GUI, through which the necessary parameters are entered and the results of the simulations are graphically visualized. In this paper, we describe the design of the simulation tool and present the preliminary results.
1
Introduction
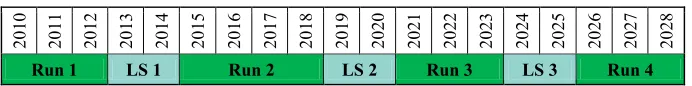
Since the start of operations in 2010, the cycle of the Large Hadron Collider (LHC) at CERN has been composed of data taking (Run) and upgrade (Long Shutdown, LS) periods, as illustrated in Table 1.
Table 1. LHC cycle by years.
201
0
201
1
201
2
201
3
201
4
201
5
201
6
201
7
201
8
201
9
202
0
202
1
20
22
202
3
202
4
202
5
202
6
202
7
202
8
Run 1 LS 1 Run 2 LS 2 Run 3 LS 3 Run 4
During the Run periods, the LHC experiments, such as ALICE [1], produce petabytes of RAW and derived data requiring a significant amount of disk and tape space as well as CPU resources for its efficient storage, processing and analysis. During the 7 years of Run 1 and Run 2, the resource requirements were calculated and requested for a full year, without taking into account the variable load within a year. This process worked reasonably
well, however, the increased demand for resources in Run 3 and beyond requires that the resource estimates are done for shorter time periods, typically months in length, and take into account the realistic computational loads during these periods.
Building on the experience gained during previous LHC runs, the ALICE Computing Model for Run 3 and Run 4 [2] is designed for a maximal reduction of the data volume in early stages of the processing chain while minimizing the impact on physics performance. To predict the resource requirements profile of the ALICE Experiment for a particular Run period we developed a flexible and highly configurable simulation tool, which uses Discrete-Event Simulation (DES) to model the ALICE data flow. The tool provides a Web GUI, which allows entering of all necessary parameters and to graphically visualize the results of simulations.
The steps of the current developments can be summarized as follows:
● Decomposition of the ALICE data flow by collision type for certain LHC Runs. ● Determination of input parameters necessary for simulations.
● Simulation of ALICE data flow for Run 3 and the estimation of required storage resources.
● Comparison of the results of a simulation for the year 2017 of Run 2 with the real amount of used resources as validation of the simulation tool.
At the moment of writing this paper the tool calculates only storage resource requirements, whilst further development will include the calculation of the requirements of computing and network resources as well.
2 ALICE data flow during LHC Run 3
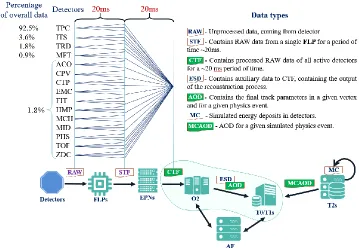
This section gives an overview of the data flow foreseen by the ALICE Computing Model for Run 3 and Run 4 and describes the data and resource types used in the model (see Figure 1). More details can be found in the 4th and 5th sections of [2].
well, however, the increased demand for resources in Run 3 and beyond requires that the resource estimates are done for shorter time periods, typically months in length, and take into account the realistic computational loads during these periods.
Building on the experience gained during previous LHC runs, the ALICE Computing Model for Run 3 and Run 4 [2] is designed for a maximal reduction of the data volume in early stages of the processing chain while minimizing the impact on physics performance. To predict the resource requirements profile of the ALICE Experiment for a particular Run period we developed a flexible and highly configurable simulation tool, which uses Discrete-Event Simulation (DES) to model the ALICE data flow. The tool provides a Web GUI, which allows entering of all necessary parameters and to graphically visualize the results of simulations.
The steps of the current developments can be summarized as follows:
● Decomposition of the ALICE data flow by collision type for certain LHC Runs. ● Determination of input parameters necessary for simulations.
● Simulation of ALICE data flow for Run 3 and the estimation of required storage resources.
● Comparison of the results of a simulation for the year 2017 of Run 2 with the real amount of used resources as validation of the simulation tool.
At the moment of writing this paper the tool calculates only storage resource requirements, whilst further development will include the calculation of the requirements of computing and network resources as well.
2 ALICE data flow during LHC Run 3
This section gives an overview of the data flow foreseen by the ALICE Computing Model for Run 3 and Run 4 and describes the data and resource types used in the model (see Figure 1). More details can be found in the 4th and 5th sections of [2].
Fig. 1. Data flow in the ALICE Computing Model for Run 3 and Run 4.
The streams of RAW data from the ALICE detectors are received by the special computing nodes of the O2 facility, called First Level Processor (FLP). These nodes perform the first data reduction and produce Sub-Time Frame (STF) data. These data are then aggregated by the Event Processing Nodes (EPN). An EPN collects all the STFs related to the same time period from all FLPs and performs their assembly and additional reduction of the data. The resulting output of EPNs is the Compressed Time Frame (CTF), which is a subject for permanent archival. There will be only one instance of the CTF data and they will be stored on the disks of the O2 facility and on tape at the Tier 0/Tier 1 sites (T0/T1s).
The next stage of data processing is an asynchronous/offline reconstruction of the CTFs, which will be carried out at the places, where these data are stored, namely the O2 facility and the T0/T1s. It is assumed that at most two iterations of offline reconstruction will be needed in order to obtain data of sufficient quality for all types of physics analysis. The offline processing will produce auxiliary Event Summary Data (ESD) containing information about tracks found during the reconstruction, these data will be temporarily stored at the O2 facility and will be removed when the final result of reconstruction procedures, the Analysis Object Data (AOD), is produced. The AODs will be permanently archived on the tape at Tier 0 and Tier 1s and sent for subsequent processing to dedicated Analysis Facilities (AFs). In general, the AODs will be systematically sent to the AFs to run the organized analysis.
Simulation tasks will predominantly run on Tier 2 sites (T2s). These will produce transient Monte Carlo (MC), from which the MCAOD files are created. The latter ones are archived on O2 and T1s and transferred to AFs for further processing. Simulation tasks can also be run on T0/T1s when there is no other activity.
The developed tool simulates the described flow of ALICE data with the aim to estimate the amount of resources required for the storage and processing of each type of data in relatively short time periods.
At the time of writing, the tool allows to simulate the data flow process marked with a green oval in Fig.1 and estimate the amount of storage resources required for the archival of the ALICE CTF data and derivatives.
3.
Software tool for the simulation of ALICE data flow
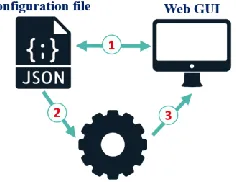
The simulation tool consists of 3 core components shown in Figure 2 and described below:
Fig.2. The simulation tool components.
● Configuration file - JSON formatted file, which contains the values of all input
● Simulation software – Describes the resources and defines their role within the computing model, defines the data and job types and performs a simulation of the use of each resource type.
● Web GUI - Allows modification of the input parameters and running the simulation with
different scenarios (path 1 in Fig.2). The interface is also used for the graphical representation of simulation results and exporting the results in various formats.
When the simulation runs, it performs DES of the ALICE data flow with a granularity of one day and according to the configurations (path 2 in Fig. 2), calculates the amount of required storage resources and finally visualizes the results (path 3 in Fig. 2).
The simulation software code is written mainly in TypeScript (TS), which uses the libraries provided by the SIM.JS simulation tool [3]. SIM.JS is a general-purpose DES library written entirely in JavaScript. For the graphical representation of the simulation results, the Highcharts JS library is used.
4. Input parameters
This section describes the ALICE data flow parameters, which serve as an input for the estimation of required storage resources during the first year of Run 3.
4.1. LHC general conditions
For each LHC year, part of the running conditions is predefined, such as the LHC running schedule, ALICE data rates and sizes of RAW/CTF data per collision type:
pp – proton-proton, pPb – proton-lead PbPb – lead-lead,
pp-reference – for the measurement of the reference cross sections with the ALICE detector in pp collisions [4]
The simulation tool takes as an input the following LHC parameters to calculate the amount of produced CTF data per day (CTFdaily).
CTFdaily = (Crate Esize Efficiency/100)t (1)
Crate – Collision Rate, number of collisions per second
Esize – Event size, the volume of CTF per event
Efficiency – Data taking efficiency, the percentage of CTF data subject for archival and further processing. In current simulations, we set the value of Efficiency to be 50%.
t – Time in seconds. Since the time granularity is a day, in Eq.1 all parameters are multiplied by the number of seconds per day, t = 86400 seconds.
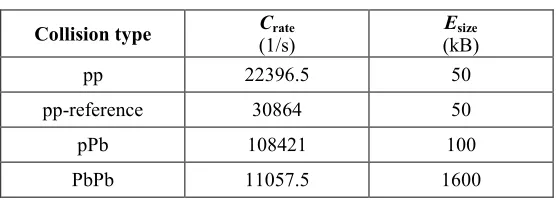
Table 2 lists the values of LHC conditions planned for Run 3.
Table 2. LHC beam type and collision rates planned for Run 3.
Collision type C(1/s) rate (kB) Esize
pp 22396.5 50
pp-reference 30864 50
pPb 108421 100
● Simulation software – Describes the resources and defines their role within the computing model, defines the data and job types and performs a simulation of the use of each resource type.
● Web GUI - Allows modification of the input parameters and running the simulation with
different scenarios (path 1 in Fig.2). The interface is also used for the graphical representation of simulation results and exporting the results in various formats.
When the simulation runs, it performs DES of the ALICE data flow with a granularity of one day and according to the configurations (path 2 in Fig. 2), calculates the amount of required storage resources and finally visualizes the results (path 3 in Fig. 2).
The simulation software code is written mainly in TypeScript (TS), which uses the libraries provided by the SIM.JS simulation tool [3]. SIM.JS is a general-purpose DES library written entirely in JavaScript. For the graphical representation of the simulation results, the Highcharts JS library is used.
4. Input parameters
This section describes the ALICE data flow parameters, which serve as an input for the estimation of required storage resources during the first year of Run 3.
4.1. LHC general conditions
For each LHC year, part of the running conditions is predefined, such as the LHC running schedule, ALICE data rates and sizes of RAW/CTF data per collision type:
pp – proton-proton, pPb – proton-lead PbPb – lead-lead,
pp-reference – for the measurement of the reference cross sections with the ALICE detector in pp collisions [4]
The simulation tool takes as an input the following LHC parameters to calculate the amount of produced CTF data per day (CTFdaily).
CTFdaily = (Crate Esize Efficiency/100)t (1)
Crate – Collision Rate, number of collisions per second
Esize – Event size, the volume of CTF per event
Efficiency – Data taking efficiency, the percentage of CTF data subject for archival and further processing. In current simulations, we set the value of Efficiency to be 50%.
t – Time in seconds. Since the time granularity is a day, in Eq.1 all parameters are multiplied by the number of seconds per day, t = 86400 seconds.
Table 2 lists the values of LHC conditions planned for Run 3.
Table 2. LHC beam type and collision rates planned for Run 3.
Collision type C(1/s) rate (kB) Esize
pp 22396.5 50
pp-reference 30864 50
pPb 108421 100
PbPb 11057.5 1600
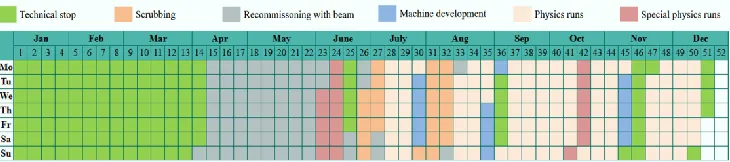
4.2. LHC running schedule
To have a realistic picture of the ALICE data flow process, we use the LHC running schedule, as published in advance by the machine. The schedule gives information on a daily basis about the states of the accelerator, e.g. how many days LHC has physics runs and what types of collisions will be performed during those days, how many days in technical stop and other related information. The LHC running schedule is published about half a year before the start of operations, however, some dates and types of runs (physics, special physics runs, technical stop, etc.) can be changed during the year and on relatively short notice. If that happens, the input parameters of the simulation can be changed accordingly and easily.
For our current simulations, we use the LHC running schedule of the year 2015 (Run 2) [5], since at the moment of writing of this paper the LHC schedule for Run 3 is not available and it is expected that the first year of Run 3 will have a similar schedule.
Fig. 3. LHC schedule of 2015 (Run 2).
4.3. Resource types and their capacities
In the simulation tool, we define the resource types, which are used for data storage and processing activities and provide their total capacities.
These numbers serve for the graphical representation of the resource thresholds to visualize the differences between consumed and total resources. As described above, in the current computing model, the resource types are O2 facility, Tier{0,1,2} sites and AFs.
4.4. Data management policies
The data replication and removal policies significantly influence the results of resource usage estimation. These policies are defined in the simulation tool through the parameters presented in Table 3 and described below:
● Data type – Type of ALICE data defined for Run 3
● Derived size - the percentage of the derived data size from the CTF size, e.g. the size of ESDs is estimated to be at most 15% of CTF data.
● Replication factor - the number of disk and tape replicas for each data type;
● Storage Sharing - the percentage of each type of data kept on each storage resource. These numbers vary for different collision types. It is expected that the O2 facility should be able to store up to 2/3 (66.6%) of all CTF data during PbPb collisions and 50% during that of pp. The remaining portion of the CTF data will be archived at Tier 1 sites.
Table 3. Data types, replication factors, storage sharing and lifetime for Pb-Pb collisions.
Data types Derived size (%) Replication factorDisk Tape Storage sharing (%)O2 T0/T1 AF Lifetime on disk (day)O2 T0/T1 AF
CTF 100 1 1 66.6 33.4 0 270 270 n/a
ESD 15 1 0 100 0 0 x n/a n/a
AOD 10 1 1 0 100 100 n/a n/a n/a
MCAOD 30 1 1 0 100 100 n/a n/a n/a
4.5. Influence of major conferences on resources requirements
Certain major physics conferences (such as Quark Matter) can impact substantially the data processing programme, in particular, the resources needed for data analysis. To make the simulations more realistic, we also take as an input the calendar of ALICE conferences. At the moment of the writing, this part of the software is currently under development, with the algorithmic part under discussion.
5. First results
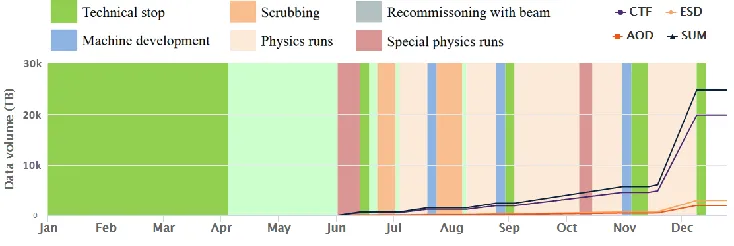
The first results from the simulation tool estimate the amount of created data during one year of the LHC Run 3. The results have been obtained by using the ALICE Run 3 computing model with the LHC calendar of the year 2015 (Run 2). It is expected that the calendar of 2015 will be similar to that of the first year of Run 3.
Fig. 4. Simulated amount of data by type during the 1st year of Run 3
Figure 4 shows the volume of each type of data (the replicas of data are not taken into account) as a function of time and Table 4 presents the total amount of data during the first year of Run 3. Monte Carlo simulations are not included.
Table 4. The total amount of data created during the 1st year of Run 3. Data type Volume (PB)
CTF ~ 19
ESD ~3
AOD ~2
Table 3. Data types, replication factors, storage sharing and lifetime for Pb-Pb collisions.
Data types Derived size (%) Replication factorDisk Tape Storage sharing (%)O2 T0/T1 AF Lifetime on disk (day)O2 T0/T1 AF
CTF 100 1 1 66.6 33.4 0 270 270 n/a
ESD 15 1 0 100 0 0 x n/a n/a
AOD 10 1 1 0 100 100 n/a n/a n/a
MCAOD 30 1 1 0 100 100 n/a n/a n/a
4.5. Influence of major conferences on resources requirements
Certain major physics conferences (such as Quark Matter) can impact substantially the data processing programme, in particular, the resources needed for data analysis. To make the simulations more realistic, we also take as an input the calendar of ALICE conferences. At the moment of the writing, this part of the software is currently under development, with the algorithmic part under discussion.
5. First results
The first results from the simulation tool estimate the amount of created data during one year of the LHC Run 3. The results have been obtained by using the ALICE Run 3 computing model with the LHC calendar of the year 2015 (Run 2). It is expected that the calendar of 2015 will be similar to that of the first year of Run 3.
Fig. 4. Simulated amount of data by type during the 1st year of Run 3
Figure 4 shows the volume of each type of data (the replicas of data are not taken into account) as a function of time and Table 4 presents the total amount of data during the first year of Run 3. Monte Carlo simulations are not included.
Table 4. The total amount of data created during the 1st year of Run 3. Data type Volume (PB)
CTF ~ 19
ESD ~3
AOD ~2
SUM ~24
To further validate the results of the simulation tool, we have also defined the ALICE data flow and computing model for Run 2 and performed a simulation of ALICE data flow for the year 2017 of Run 2. The simulation results are compared with the real values from that year. The model predicts a RAW data volume of ~9 PB, whereas, the real volume was ~8 PB [6].
The development of the model and simulation algorithms continues with the aim to make the results of simulations as realistic as possible.
6. Conclusion and future work
The simulation software presented in this paper is a flexible and highly configurable tool, which presently allows estimating and visualizing the data volume and resources needed to store each type of data of the ALICE experiment during LHC Run 3 and beyond. It is based on the ALICE upgrade computing model and uses the LHC activity calendar, collision types and the ALICE data types.
To validate the simulation tool and models incorporated within, we performed an estimate of the storage resource usage during the year 2017 of LHC Run 2 and compared it with the real data.
The development of the simulation tool continues to increase its precision and to enrich the parameter space complexity. Ultimately the tool should be applicable and useful for other LHC experiments.
7. References
1. ALICE Collaboration, K. Aamodt, A. Abrahantes Quintana, R. Achenbach, et al., The ALICE experiment at the CERN LHC. In: JINST 3.08 (2008),
S08002. DOI: 10.1088/1748-0221/3/08/S08002.
2. The ALICE Collaboration, J. Adam, D. Adamova, M.M. Aggarwal, G. Aglieri Rinella, et al., Technical Design Report for the Upgrade of the Online-Offline Computing System ALICE-TDR-019 CERN-LHCC-2015-006 (2015),
https://cds.cern.ch/record/2011297/files/ALICE-TDR-019.pdf
3. SIM.JS, http://simjs.com/
4. K. Oyama, Reference cross section measurements with ALICE in pp and Pb-Pb collisions at LHC, https://arxiv.org/pdf/1305.7044.pdf
5. High Energy Physics Advisory Panel, F. Bordry, Status & prospects LHC accelerator and HL-LHC plans, 14,15 (2015),
https://science.energy.gov/~/media/hep/hepap/pdf/201512/Fk_Bordry-_HEPAP_meeting_10_december_2015.pdf
6. L. Betev, ALICE Computing Resources Usage in 2017-2018 and Resource Requirements for 2018, 2019 and 2020, 2 (2018)