ISSN 2286-4822 www.euacademic.org
Impact Factor: 3.1 (UIF) DRJI Value: 5.9 (B+)
Techno-Economic Analysis of Integrated Municipal
Solid Waste Processing Complex Ghazipur, Delhi
Dr. DIPTI RANJAN MOHAPATRA
Associate Professor (Economics) School of Business and Economics
Madawalabu University Bale Robe, Ethiopia
Abstract:
The Municipal Corporation of Delhi (MCD) is amongst the largest municipal bodies in the world catering to an estimated population of 17 million citizens by providing civic services to them. Ghazipur is one of the three existing landfills of Delhi that has come up with a Waste to Energy (WtE) plant processing and disposing off the municipal waste. The plant produces RDF that will result in power generation .This plant will be a source of revenue and also earn carbon credits. The main objective of this paper is to study the techno-economic analysis of WtE plant in Ghazipur for producing electricity from RDF and predict its commercial viability.
Key words: waste to energy, MSWM, RDF, FIRR, debt-equity model.
1.0 Introduction:
has led to the increase in the generation of solid waste. Most wastes that are generated find their way into land and water bodies without proper treatment, causing severe water and air pollution. All the urban areas in India face acute problems related to solid waste. Due to lack of serious efforts by town/city authorities, garbage and its management has become a major problem. Despite all the efforts by the local bodies there has been a progressive decline in the standard of services with respect to collection and disposal of municipal solid waste.
In many cities nearly half of solid waste generated remains unattended, giving rise to in sanitary conditions especially in densely populated slums resulting in a large number of diseases [Rathi et.al. 2005]. Hence there is an emerging global consensus to develop local level solutions and to involve community participation for better waste management [United Nations, 2004]. The objective of this paper is to develop a cost-effective waste to energy technology which would reduce solid waste and decrease pollution from waste and also provide a supplemental energy source to meet some of the local electricity demand by providing a source of renewable energy.
2.0Literature Review:
[Shafik et.al.1992] shows, the per capita generation of solid waste is at least 0.3-0.4 kg/ day in developing country. Thus, a 1 percent increase in population is associated with a 1.04 percent increase in solid waste generation, and a 1 percent increase in per capita income is associated with a 0.34 percent increase in total solid waste generation [Beede et.al.1995 and Henry et.al. 2006]. As per Municipal Solid Waste (Management and Handling) Rules, 2006 only inert, non recyclables, non biodegradable and non hazardous wastes should be allowed to enter the landfills. Developed countries are busy in developing and implementing waste-to-energy technologies associated with energy recovery, composting of waste and recycling and reuse, while developing countries are still struggling to decide on the best options to treat and dispose off these waste [Mrayyan et.al. 2006]. There are environmental benefits of waste to energy, as an alternative to disposing of waste in landfills, since waste to energy generates clean, reliable energy from a renewable fuel source, reducing dependence on fossil fuels, the combustion of which is a major contributor to GHG emissions. These measures would reduce the quantity of wastes, generate a substantial quantity of energy from them, and also greatly reduce pollution of water and air.
Municipal Solid Waste has normally been disposed off in open dumps in many Indian cities and towns, which is not the proper manner of disposal because such crude dumps pose environmental hazards causing ecological imbalances with respect to land, water and air pollution [Kansal, A, 2002]. The problem is already acute in cities and towns as the disposal facilities have not been able to keep pace with the quantum of wastes being generated [Singhal, S. et.al. 2001].
2.1 Solid Waste Management in Delhi
Municipal Corporation of Delhi (MCD) is among the largest municipal bodies in the world catering to the needs of an estimated population of 16.7 million (according to 2011 Census) and covering approximately an area of 1399.26 sq.km. Figure- 1 shows the Map of Delhi with Project Disposal Site.
Figure 1: Project Site (Ghazipur, Delhi Solid Waste Management Landfill Site)
For solid waste management in Delhi, twenty landfill sites were identified and developed since 1975 of which 15 have already been closed and two were suspended. There are at present three landfill sites in operation [MCD Delhi, 2012] given in Table - 1.
Table -1: Land Filled Sites of Delhi Sl.
No.
Name of SLF site
Location Area Start Year
Waste Received
Zones
1 Bhalaswa North Delhi 21.06 Ha
1993 2200 TPD Civil Line, Karol Bagh, Rohini, West and Najafgarh 2 Ghazipur East Delhi 29.16
Ha
1984 2000 TPD Shahdara (North), Shah. (South), City, Sadar Paharganj & NDMC area
Ha Najafgarh and Cantonment area Source: MCD Delhi, 2012.
Since the existing landfills are nearly exhausted, many technological options are tried for the conversion of MSW either into energy or value added products so that the load of MSW on landfills is minimized. Low Carbon Technology (LCT) is one such technology which helps in reducing the carbon dioxide emission in the atmosphere. It is particularly important in the Indian scenario, because it will reduce the consumption of fossil fuel and focus on other renewable resources
[http://www.worldenergy.org/documents/congresspa ].
Electricity can be produced by burning "municipal solid waste" (MSW) as a fuel. MSW power plants, also called waste to energy (WtE) plants, are designed to dispose of MSW and to produce electricity as a byproduct of the incinerator operation. MSW is managed by a combination of disposal in landfill sites, recycling, and incineration. MSW incinerators often produce electricity in WtE plants. The US Environmental Protection Agency (EPA) recommends, "The most environmentally sound management of MSW is achieved when these approaches are implemented according to EPA's preferred order: source reduction first, recycling and composting second, and disposal in landfills or waste combustors last [Gomes, H. P et. al. 2005].
quantified, the benefits are higher even for an individual household waste collection [Anex, R. P., 1995].
To economically justify that MSWM could generate sufficient revenue, good valuation studies on the potential benefits of MSWM is necessary. Several techniques for assigning economic values to SWM services have been used in the literature for example: travel cost [Arimah, B. C. 1996], hedonic pricing [Huhtala, A., 1999] choice modeling [Othman J. 2002, Naz, A. C, Municipalities: User Fees in Tuba, Research Report, no. 2005-RR10 , Boyer, T. 2006 and Jin, J., Z.. Wang et.al. 2006].
In this paper a simple Debt- Equity Model has been adopted using discounted cash flow analysis for estimation of commercial viability of a Waste to Energy project in New Delhi.
2.2 Wastes to Energy in Landfills
The "Waste to Energy" facilities which are operative in the landfills and help in earning carbon credits include the following technologies [Techno - Economic Analysis, 2009, George Makrigiannis].
3.0 Mass Burn (MB)
generate electricity from waste by feeding mixed municipal waste into large furnaces Steam is generated during this process and electricity is produced.
3.1Refuse-Derived Fuel (RDF)
"Waste to Energy" plants remove recyclable or unburnable materials and shred or process the remaining trash into a uniform fuel. In an RDF plant, waste is processed before burning. Typically, the noncombustible items are removed, separating glass and metals for recycling. A dedicated combustor, or furnace, may be located on-site to burn the fuel and generate power; or the RDF may be transported off site for use as a fuel in boilers that burn other fossil fuel. Thus the waste-to-energy plants offer two important benefits of environmentally safe waste management and disposal, as well as the generation of clean electric power.
3.2 RDF Plant at Ghazipur, Delhi
sand ceramics and metal components will be separated from biodegradable and other organic matter waste.
The first step in this plant would be the manual segregation of MSW, shredding and screening to separate inert and some percentage of bio-degradable matter. The screening and the ballistic separation etc. will result in the production of RDF which will be utilized for the generation of electricity. The proposed integrated waste management facility will have a capacity to process 1300 TPD of MSW and generate about 433 MT of RDF. The boiler for the proposed power plant consume about 16.27 TPH of RDF Fluff for power generation The power plant will be provided with air cooled condenser for condensing the exhaust steam from turbo generator to reduce the water requirement to a large extent. The water requirement for the proposed project would be around 471 m3/day. This power plant
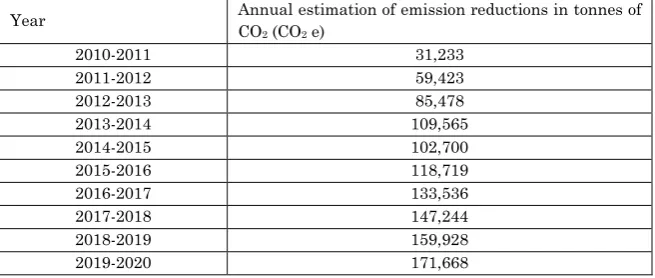
will use about 16.27 tons of RDF per hour in boiler (generating 50 TPH of steam) for the generation of 10 MW of power. During the operation there will be a lot of dust emission so care is taken to provide adequate dust control systems such as cyclones, bag filters to control the dust emissions. This technology will result in the average annual reduction of CO2 by
111949 tons. The estimated amounts of CO2 reduction over the
fixed ten years are given in Table-2 [(Cdm-Pdd) Version 03 - in effect as of: 28 July 2006.]
Table 2: Estimated Amounts of CO2 Reduction over the Fixed Ten Years
Year Annual estimation of emission reductions in tonnes of CO2 (CO2 e)
2010-2011 31,233
2011-2012 59,423
2012-2013 85,478
2013-2014 109,565
2014-2015 102,700
2015-2016 118,719
2016-2017 133,536
2017-2018 147,244
2018-2019 159,928
4.0 Commercial Viability of the Power Plant
The operation of a power plant based on MSW depends upon the commercial viability of electricity generation from the power plant. In this case the commercial viability is estimated by making a detail financial analysis. The financial analysis reviews the merits of the project to be implemented on commercial format i.e. assessing whether the project is attractive enough for private sector participation. Hence the financial viability of the project is carried out so that it can be assessed whether the project is attractive enough for private sector participation under the BOT (build–operate–transfer) basis. The analysis ascertains the extent to which the investment by the BOT concessionaire can be recovered through revenue and the gap. If required it may, be funded through government subsidy or alternative revenue sources, covering aspects like government grant, financing through debt and equity, loan repayment, debt servicing, taxation, depreciation, etc. The viability is evaluated in terms of the Project IRR (Financial Internal Rate of Return - FIRR) on total investment and the Equity IRR (FIRR on equity investment), using discounted cash flow analysis. Both costs and revenues have been indexed to account for inflation.
The financial viability of this project has been examined taking into account example of SW project carried out in other Indian metropolitan city [Conversion of MSW to 6.6 MW Electricity in Hyderabad, India by Selcon International Limited, India]
The infrastructure development for setting up the power plant is proposed to be done during the financial year 2014-15 by taking loan from bank for developing infrastructure.
4.1 Financial Model
simple Debt-Equity Model based on Discounted Cash Flow Technique for estimation of internal rate of return of the established RDF power plant.
4.2 Basic Assumptions of the Financial Model
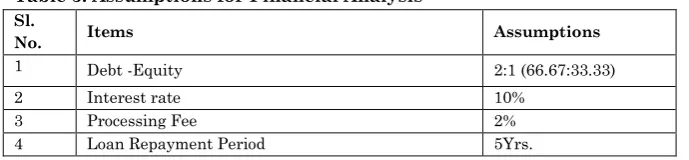
Financial viability analysis has been done using a spreadsheet based financial model. The model projects the key financial statements over the period. A period of 20 years (2014 – 2034), commencing from the appointed date and including the construction period, has been considered. Investment costs and capital expenses have been identified in the year in which they are to be incurred. All estimates of costs and revenues have been made at 2014 price levels. A variation of 6 to 9 percent inflation rate per annum has been considered, which is applicable to all cost items. Resources for the improvement/upgrading of the project would be raised from a mix of debt and equity sources. A debt-equity ratio of 66.67: 33.33 (i.e. 2:1), as per current market trends, has been assumed. A 5-year period for construction loan repayment has been adopted. This includes the 4-years construction period and a 1 year moratorium after completion of construction. The interest rate on long term debt is taken as 10 percent, in keeping with the current lending rates of financial institutions. The rate for calculation of IDC is also taken as 10 percent. Viability of the project is assessed on the basis of Project and equity IRR. The financial analysis is carried out under the following assumption mentioned for a twenty years analysis period. The basic assumptions considered while doing financial analysis are listed in Table 3.
Table 3: Assumptions for Financial Analysis* Sl.
No. Items Assumptions
1 Debt -Equity 2:1 (66.67:33.33)
2 Interest rate 10%
3 Processing Fee 2%
5 Moratorium 1 yr 6 Infrastructure Development (Establishing 10 MW
Electricity Plant) 1 Year. (2014-2015)
7 Inflation 6% (2014-2019),
7% (2020-2025), 8% (2026-2031) 9% (2032-2034) 8 Security Deposit period 12 months
* Based on assumption considered by author for financial analysis of the project.
Depreciation of capital items is calculated by using Written Down Value (WDV) Method [Kieso, Donald E; Weygandt, Jerry J.; and Warfield, Terry D: Intermediate Accounting].
The WDV method favors income shielding.
4.3 Target IRR
To assess whether the project is commercially viable, the returns to investors, in terms of the Project FIRR, and the Equity FIRR, were compared with the target IRRs. The returns expected by investors are a function of the value of equity issues on the Indian stock markets, interest rates on commercial loans, the risk profile of the investment and alternative investment opportunities. The minimum pre-tax Project IRR that is commensurate with the risks associated with the project and returns acceptable to investors is taken as 12 percent as per World Bank norms. The target Equity IRR is taken as 14 percent.
4.4 Cost and its Phasing
4.5 Base Project Cost
The base project cost, comprising the construction cost and contingencies & supervision charges for the 10 MW Power Plant has been estimated at 2014 prices. Construction work is assumed to begin in 2014. The construction period is taken as 1 year (starting towards the end quarter of financial year 2014 -2015 and will continue up to end quarter of financial year -2015 -2016) with the power plant becoming operational towards the end of 2015. The Capital Cost of establishing a 10 MW Power Plant is INR (Indian Rupees) 1000.00 Million (approximately 16.24 million USD@ 1USD=61.58 INR).
4.6 Operations and Maintenance Cost
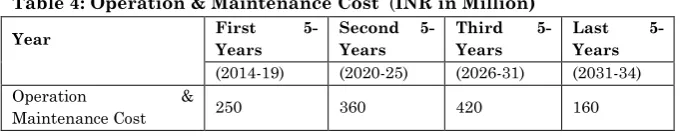
Routine maintenance comprises primarily of maintenance of the power plant, accident repairs and all ancillary works. The annual routine maintenance costs for 10MW Power Plant have been taken @ 5% of the capital cost per annum for first 5 – Years, @ 6% of the capital cost per annum for next 5 –Years, @ 7% of the capital cost per annum for next 5 –Years, @ 8% of the capital cost per annum for next 5 –Years [BSES Rajdhani Power Limited, Delhi, Electricity Bill, August 2014]. The Operation and Maintenance Cost is presented in Table 4.
Table 4: Operation & Maintenance Cost (INR in Million)
Year First 5-Years
Second 5-Years
Third 5-Years
Last 5-Years (2014-19) (2020-25) (2026-31) (2031-34) Operation &
Maintenance Cost 250 360 420 160
4.7 Escalation Cost
Table 5: Escalation Cost
Year First 5-Years Second 5-Years Third 5-Years Last 5-Years (2014-19) (2020-25) (2026-31) (2031-34)
Escalation Cost 6% 7% 8% 9%
4.8 Interest during Construction (IDC)
The interest during construction, which is the cost of funding incurred on the debt portion of the project, has been calculated on the basis of an interest rate of 10 percent per annum, in tune with the prevailing interest rates. The total loan amount to be repaid is inclusive of IDC.
4.9 Total Project Cost (TPC)
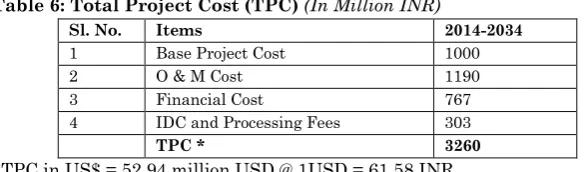
The total cost of the project is the cost at the time of commissioning and includes aggregate of base project cost, escalation cost, financial cost, processing fee and interest during construction (IDC). The TPC at the end of the construction period has been estimated as INR 3260.00 million. Total Project Cost is presented in Table 6.
Table 6: Total Project Cost (TPC) (In Million INR)
Sl. No. Items 2014-2034 1 Base Project Cost 1000
2 O & M Cost 1190
3 Financial Cost 767
4 IDC and Processing Fees 303
TPC * 3260
*TPC in US$ = 52.94 million USD @ 1USD = 61.58 INR
4.10 Total Revenue Generated
The total revenue generated is the sum of revenue generated from 10MW power plant in 20 years and the total carbon credit obtained from reduction of CO2 during these 20 years period.
4.11 Electricity Generation and Power Tariff Calculation At present the tariff rate for 1KWH electricity in Delhi is Indian Rupees 4.00 (0.06 USD) [BSES Rajdhani Power Limited, Delhi, August 2014]. Thus, total tariff generated from this 10MWh electricity plant estimated would be INR 656.85 million (10.67 million USD @ 1USD = 61.58 INR) in one year on average approximately. Thus, total revenue from electricity generation in 20 years period would be INR 13,137 million (approximately 213.33 million USD@1USD = 61.58 INR). The power transmission and distribution loss of 29.80% per annum [http://www.epa.gov/epaoswer/non-hw/muncpl/index.htm ] would result a total revenue loss INR 3,914.83 million in 20 year’s period (approximately 63.57 million USD @ 1USD = 61.58 INR). A break down period of 35 days per annum in the operation of the power plant has also been considered.
4.12 Carbon Credit
The estimated reductions in CO2 would enable the plant to
earn carbon credits. Since 1MW electricity generated from solid waste management saves 2 metric tons of CO2. Thus 10MW
electricity generated from solid waste management would save approximately 20 metric tons of CO2. If it is assumed that 1
metric tons of CO2 generates revenue of 15 Euro. Hence in the
international market, this power plant would generate a carbon credit worth of 349.74 million INR (@1 Euro = 78.19 INR approximately) equivalent to 5.68 million US $ in 20 years.
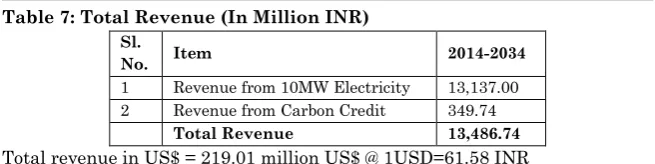
5. Project Revenue
Table 7: Total Revenue (In Million INR) Sl.
No. Item 2014-2034 1 Revenue from 10MW Electricity 13,137.00 2 Revenue from Carbon Credit 349.74
Total Revenue 13,486.74 Total revenue in US$ = 219.01 million US$ @ 1USD=61.58 INR
Taking into account the power transmission and distribution loss @ 29.80% per annum and break down period of 35 days per annum the net cash flow is INR 8158.91 million equivalent to 132.49 million USD (@ 1USD = 61.58 INR).
5.1Results of Financial Analysis:
To assess whether the project is commercially viable, the returns to investors, in terms of Project IRR, and the Equity IRR, are compared with the target IRRs. The project is not viable without grant (with Equity IRR of 31.26%). However, with an equity support to the TPC, the project is seen to be viable over a period of 20 years with a project IRR of 21.82%. The results of the financial analysis are summarized in Table 8.
Table 8: Financial Viability Sl.
No.
Indicator 20 Years Period
1 Target Project IRR 14.00%
2 Project IRR (%) 21.82%
3 Equity IRR (%) 31.26%
The results of the financial viability analysis show that the project is viable over a 20 years period with grant.
6. Conclusion
production. Conversion of MSW to RDF fluff is technologically more advanced. It is speculated that such plants might consume more energy than they are expected to produce. The waste to energy technology can be developed only if it is cost effective. Such projects are also associated with many social issues because RDF plant also uses many recyclables on account of its high calorific values .Thus such projects face a tough competition from the rag pickers. Contrary to public opinion and opposition, introducing a WtE facility would decrease pollution from waste that would otherwise have been land filled and also provide a supplemental energy source to meet some of the local electricity demand by providing a source of renewable energy. The plant would also help in decreasing a significant amount of green house gas emissions from fossil fuels. The complete economic analysis also indicates that the various assumptions, sensitivities and omissions / uncertainties make it very difficult to use the out-turn figures for such projects as a basis for establishing policy. Although the project is commercially viable, however there are a number of factors i.e. technology design, operation, maintenance servicing and government policies on capital subsidies which are essential for the successful operations of such plants.
REFERNCES:
Anex, R. P., A Travel-Cost Method of Evaluating Household Hazardous Waste Disposal Services, Journal of Environmental Management, (1995) 45, 189-198.
Arimah, B. C. 1996., Willingness to Pay for Improved Environmental Sanitation in a Nigerian City, Journal of Environmental Management (1996), 48, 127-138.
Boyer, T., Talking Trash: Valuing Household Preferences for Garbage and Recycling Services Bundles Using a Discrete Choice Experiment, Selected Paper prepared for presentation at the American Agricultural Economics Association Annual Meeting, Long Beach, California, July 23-26, 2006.
BSES Rajdhani Power Limited, Delhi, Electricity Bill, August 2014.
Clean Development Mechanism Project Design Document Form (Cdm-Pdd)Version 03 - in effect as of: 28 July 2006. Das, D., Srinivasu M. and. Bandyopadhyay, M, Solid State
Acidification of Vegetable Waste, Indian Journal of Environmental Health (1998) 40(4), pp. 333–342.
Environmental Impact Assessment Of Integrated Municipal Solid Waste Processing Complex Ghazipur, Delhi
Submitted to: Delhi Pollution Control Committee Submitted by: East Delhi Waste Processing Company Pvt. Ltd (2008).
George Makrigiannis, Techno economic Analysis of Waste-To-Energy Utilization, A Plasma Approach, (Athens) Innovation, Technology of the Athens Information Technology (2009) .
Globalis, Urban Growth Rate, 2005, accessed in August2014, ht tp://globalis.gvu.unu.edu/.
Gomes, H. P. and Nobrega, C. C., Economic Viability Study of a Separate Household Waste Collection in a Developing Country, Journal of Material Cycles and Waste Management (2005), 7,116-123.
Henry Rotich K., Yongsheng Zhao and Jun Dong, Municipal Solid Waste Management Challenges in Developing Countries – Kenyan Case Study, (2006), Volume 26, Issue 1 ,Pages 92-100.
Recycling and Incineration, Journal of Environmental Management (1999), 55, 27-38.
International Energy Agency, Energy Policies of IEA Countries: Denmark Review, Head of Publications Service, OECD/IEA 2, rue André-Pascal, 75775 Paris cedex 16, France. http://www.iea.org/textbase/nppd f/free/2000/Denmark_comp02.pdf, (2002).
Jin, J., Z.. Wang and S. Ran, Comparison of Contingent Valuation and Choice Experiment in Solid Waste Management Programs in Macao, Ecological Economics, 57, 430-441, 2006.
Kansal, A, Solid Waste Management Strategies for India, Indian Journal of Environmental Protection (2002), (4), pp. 444–448.
Kieso, Donald E; Weygandt, Jerry J and Warfield, Terry D,
Intermediate Accounting, Chapter 11. ISBN 978-0-471-44896-9
Mrayyan Bassam and Hamdi, Moshrik R., Management Approaches to Integrated Solid Waste in Industrialized Zones in Jordan: A Case of Zarqa City, (2006), Waste Management, Volume 26, Issue 2, Pages 195-205.
Municipal Corporation of Delhi, Report on Solid Waste Transport Management Systems (2012).
Naz, A. C. C., and Naz M. T. N., Modeling Choices for Ecological Solid Waste Management in Suburban Municipalities: User Fees in Tuba, Philippines,
Environment and Economic Programs for South-East Asia, Research Report, no. 2005-RR10 Co-published by: International Development Research Centre, (2005), ISBN 1- 55250-170-1.
Rathi, Sarika, Alternative approaches for better municipal solid waste management in Mumbai, India Waste Management, (2005).
Report on Conversion of MSW to 6.6 MW Electricity in Hyderabad, India, Selcon International Limited, India, (2008).
Saha, VP, Rahul Kumar, Manish Kumar, Deswal, S., Chandna, P., accessed in August 2014, http://www.worldenergy.org/documents/congresspa. Shafik and Bandyopadhyay, World Resource Institute, 1992. Shimura, S., Yokota, I. and Nitta, Y., Research for MSW Flow
Analysis in Developing Nations, Journal of Material Cycles and Waste Management, (2001), Vol. 3 , pp. 48– 59.
Singhal, S. and Pandey, S., Solid Waste Management in India: Status and Future Directions, TERI information monitor on Environmental Science (2001), 6 (1), pp1-4.
United Nations, Environmentally Sound Management of Solid Wastes and Sewage Related Issues, Chapter 21 of Agenda 21, 2004 accessed in August 2014, United Nations: http://www.unep.org/Documents/Default.