ISSN(Online): 2320-9801 ISSN (Print): 2320-9798
I
nternational
J
ournal of
I
nnovative
R
esearch in
C
omputer
and
C
ommunication
E
ngineering
(An ISO 3297: 2007 Certified Organization)
Vol. 3, Issue 2, February 2015
Image Upscaling using iNEDI Algorithm
Supriya S. Thombre1, Smita R. Kapse2, Nilima Jichkar3, Amita Meshram4, Amit M. Deshmukh5
Assistant Professor, Dept. of Computer Technology, Yeshwantrao Chavan College of Engineering, Nagpur, India 1,2,3,4
Assistant Professor, Visvesvaraya National Institute of Technology, Nagpur, India5
ABSTRACT: Creation of an upscaled image should be artifact free & should appear as a natural to a human observer.
It is also known as image super-resolution. The quality of an image should be maintained. Different algorithms are available for image upscaling. One of those algorithms is iNEDI.
KEYWORDS: Image upscaling, iNEDI, image super-resolution
I. INTRODUCTION
A. Image Upscaling:
Image upscaling is an important application in the field of image processing; and a critical one when it comes to
displaying or printing an image at aresolution higher than that at which the image is available.
Image upscaling or single-image super resolution has recently become a hot topic in computer vision and computer graphics communities due to the increasing number of practical applications of the algorithms proposed. Image upscaling (and more generally image interpolation) methods are implemented in a variety of computer tools like printers, digital TV, media players, image processing packages, graphics renderers, and so on. The problem is quite simple to be described: we need to obtain a digital image to be represented on a large bitmap from original data sampled in a smaller grid, and this image should look like it had been acquired with a sensor having the resolution of
the upscaled image or,at least, present a “natural” texture.
Realistic high-frequency reconstruction is not the only issue to be considered in choosing an interpolation approach: the computational efficiency of the methods should also be taken into account, especially in the case of real-time applications (i.e., to improve the perceived quality of video streaming). Fast super-resolution methods trying to obtain better results than simple polynomial interpolators are not usually based on statistical modeling, but simply adapt the local interpolation function to a low-resolution estimate of local edge behaviour. Simplest edge-adaptive methods ([4], [5], [9]), which could easily reach real-time performances, are not, however, able to create natural looking images and often introduce relevant artifacts.
The more effective non-iterative edge-adaptive methods like new edge-directed interpolation (NEDI) [8] or improved NEDI (iNEDI) [2] present a relevant computational complexity, even higher than that of many learning-based methods.
B. Artifacts:
ISSN(Online): 2320-9801 ISSN (Print): 2320-9798
I
nternational
J
ournal of
I
nnovative
R
esearch in
C
omputer
and
C
ommunication
E
ngineering
(An ISO 3297: 2007 Certified Organization)
Vol. 3, Issue 2, February 2015
aliasing blurring edge halo frequency
(jaggies) artifacts
Figure 1: Different Types of Artifacts
Subjective tests reveal that quality scores should be analyzed with care, being the perception of image quality related to image contents and different factors that may be weighted differently according to the user’s needs. It has been shown (see [10]) that the decrease in the perceived “image quality” is related to a linear combination of blurriness and artifacts with higher weight given to blurriness (most people seem to prefer an increase in sharpness rather than a similarly notable artifact removal). This is probably one of the reasons why, for the enlargement of high-resolution images for printing enhancement, photographers often use software that does not create natural detail or maximize similarity between high-resolution patches and low-resolution upsampled ones. Default options of professional photo zooming software usually strongly enhance the contrast and straight lines, locally flattening texture. Learning-based methods are also able to reconstruct sharp detail at the risk of creating “hallucinated” objects, and the perceived quality may be good or bad according to the fact that the detail is realistic or not in that position. It seems, therefore, a reasonable statement to say that there is not an interpolation method that is ideal in any condition: the choice of the algorithm is largely dependent on the application.
II.LITERATURE SURVEY
The relationship between high-resolution and low-resolution patterns can be learned from examples and for this reason, several researchers proposed to recover a statistical model of it from a training set.
A. Resolution Synthesis (RS).
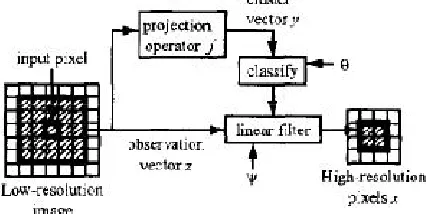
In RS [3], the pixel being interpolated is first classified in the context of a window of neighboring pixels; and then the corresponding high-resolution pixels are obtained by filtering with coefficients that depend upon the classification. RS is based on a stochastic model explicitly reflecting the fact that pixels falls into different classes such as edges of different orientation and smooth textures. RS generates the minimum mean-squared error (MMSE) estimate of the high-resolution image, given the low-resolution image. The parameters that specify the stochastic model must be
estimated beforehand in a training procedure that have formulated as an instance of the well-known
expectation-maximization (EM) algorithm.
ISSN(Online): 2320-9801 ISSN (Print): 2320-9798
I
nternational
J
ournal of
I
nnovative
R
esearch in
C
omputer
and
C
ommunication
E
ngineering
(An ISO 3297: 2007 Certified Organization)
Vol. 3, Issue 2, February 2015
For each input pixel in the low-resolution image, the prediction task is to compute the corresponding block of high-resolution pixels. The predictor uses all the pixels in a neighborhood centered at the input pixel. In this example, the neighborhood is a 5 x 5-pixel window. For the analysis, consider the input pixel neighborhood as the elements of an observation vector z, and the estimated high-resolution pixels in a vector x. More generally, model both these vectors as random quantities, and follow the convention of using upper-case letters for random variables and lower-case letters for their realizations. The form of the predictor is based on the assumption that each input pixel is from some class, with the different classes representing image features like edges and smoother gradient transitions of different orientation. Further, assume that the optimised prediction filter for each class, so that if the class of the input pixel is known, then it is possible to generate an optimal estimate of X by applying the filter to z. The only problem is that it is not possible to ascertain the class of the input pixel. In RS, the prediction process is to associate the input pixel with each of the classes, to different degrees, with a mixture of proportions. Estimate X by first filtering z with the optimal predictors for the individual classes, and then combining the results with the proportion mixture. The first step is
referred as “classification,” and represents the classifier parameters with the symbol . The second step is referred as
“filtering,” and it represent collectively the prediction filters for the different classes with the symbol .
Rather than classifying the input pixel based on the entire observation vector z, “cluster vector” y extracted from the observation vector using a nonlinear transformation f(.) is used:
Y = f
Generally y is of lower dimension than z, and this transformation is referred as a “projection.” The projection operation is critical, because ultimately it influences which classes are defined during the training, which in turn controls the quality of overall scaling process [3].
B. Example-Based Super Resolution
Polygon-based representations of 3D objects offer resolution independence over a wide range of scales. With this approach, object boundaries remain sharp when zoom in on an object until very close range, where faceting appears due to finite polygon size. However, constructing polygon models for complex, real-world objects can be difficult. Image based rendering (IBR), a complementary approach for representing and rendering objects, uses cameras to obtain rich models directly from real-world data.
Unfortunately, these representations no longer have resolution independence. When a bitmapped image is enlarged, a blurry result is obtained. Standard pixel interpolation methods, such as pixel replication and cubic-spline interpolation, introduce artifacts or blur edges. For images enlarged three octaves (factors of two) such as these, sharpening the interpolated result has little useful effect. The methods are called for achieving high-resolution enlargements of pixel-based images super-resolution algorithms. Many applications in graphics or image processing could benefit from such resolution independence, including IBR, texture mapping, enlarging consumer photographs, and converting NTSC video content to high-definition television.
Another training-based super-resolution algorithm is build and developed a faster and simpler algorithm for one-pass super-resolution. The algorithm requires only a nearest-neighbor search in the training set for a vector derived from each patch of local image data. This one-pass super-resolution algorithm is a step toward achieving resolution independence in image-based representations [6].
C. Single Image Super Resolution
ISSN(Online): 2320-9801 ISSN (Print): 2320-9798
I
nternational
J
ournal of
I
nnovative
R
esearch in
C
omputer
and
C
ommunication
E
ngineering
(An ISO 3297: 2007 Certified Organization)
Vol. 3, Issue 2, February 2015
D. NEDI (New Edge Directed Interpolation)
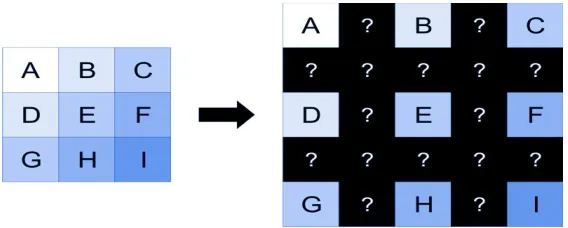
Without the loss of generality, we assume that the low-resolution image Xi,j of size H x W directly comes from of size
of 2H x 2W , i.e. Y2i,2j = Xi,j .
Figure 3: Upscaling of an Image
We use the following basic problem to introduce our new interpolation algorithm: How do we interpolate the interlacing lattice Y2i+1,2j+1 from the lattice Y2i,2j = Xi,j .
The only constrain is the fourth-order linear interpolation where the interpolation includes the four nearest neighbors along the diagonal directions [8].
III.ALGORITHM
A. iNEDI (improved NEDI)
iNEDI (improved New Edge-Directed Interpolation) is the proposed technique to fix/reduce the original NEDI
problems and increase the interpolation accuracy. Despite its complexity, it is proved that the NEDI interpolation method, provides generally good results, but it has many flaws (Artifacts) in the presence of high frequency regions. The use of a circular mask instead of the square window used in original NEDI technique reduces the number of calculations and the presence of artifacts in case of large windows. The use of multiple masks with different sizes allows accounting for both lower and higher frequencies regions.
ISSN(Online): 2320-9801 ISSN (Print): 2320-9798
I
nternational
J
ournal of
I
nnovative
R
esearch in
C
omputer
and
C
ommunication
E
ngineering
(An ISO 3297: 2007 Certified Organization)
Vol. 3, Issue 2, February 2015
B. Non edge pixels handling
This method first estimates local covariance coefficients from a low-resolution image. By using these covariance estimates to adapt the interpolation at a higher resolution. The image size is doubled in each direction at each cycle. iNEDI can dynamically increase the window radius from a minimum to a maximum value.
When the four pixels used to calculate the interpolated ones have a similar gray level, there is no need to compute the NEDI coefficients. If the covariance is stationary, a small error causes a bad conditioning of the solution.
If the local gray level variation is below a fixed threshold NEDI uses the bilinear interpolation, while iNEDI uses
bicubicinterpolation.
Figure 5: Two-Step Interpolation Based On a Weighted Average of Four Neighbours.
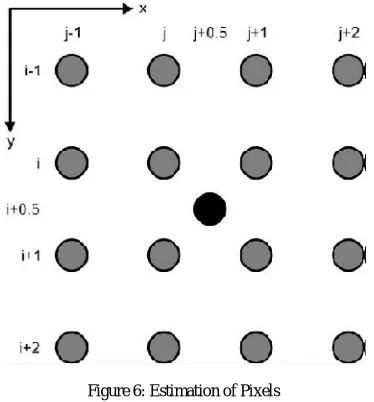
Figure 6: Estimation of Pixels
ISSN(Online): 2320-9801 ISSN (Print): 2320-9798
I
nternational
J
ournal of
I
nnovative
R
esearch in
C
omputer
and
C
ommunication
E
ngineering
(An ISO 3297: 2007 Certified Organization)
Vol. 3, Issue 2, February 2015
First, pixels indexed by two odd values, the darker pixel are computed as a weighted average of the four diagonal neighbours (corresponding to pixels of the original image).
Second, the remaining holes, Black pixel are filled with the same rule, as a weighted average of the four nearest neighbours.
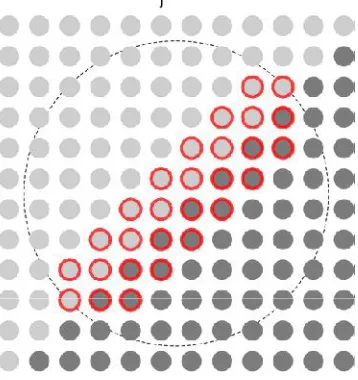
C. Windows Shape
The squared window Wused by NEDI introduces directional artifacts and makes the algorithm non isotropic. This has
been solved by iNEDI using a circular window.
Figure 7: Circular Window for iNEDI
To account for various frequencies regions, iNEDI can dynamically increase the window radius from a minimum to a maximum value while the normalized residual of the least squares fit decreases.
D. Edge "segmentation"
ISSN(Online): 2320-9801 ISSN (Print): 2320-9798
I
nternational
J
ournal of
I
nnovative
R
esearch in
C
omputer
and
C
ommunication
E
ngineering
(An ISO 3297: 2007 Certified Organization)
Vol. 3, Issue 2, February 2015
iNEDI tries to exclude from the circular window all pixels that do not belong to the local edge using a sort of region growing method that excludes all uniform areas and pixels that are not connected to the edge. Two pixels are connected if they are adjacent and their values are included in a predefined range.
E. Steps for iNEDI
Step 1: Estimation of Coefficients
It is assumed that the coefficients linking each pixel with its four diagonal neighbours do not change with scale.
Figure 9: Estimation of Centre Pixels
The y vector contains the values of the pixels contained on the window W. The Cmatrix contains in each row the
ISSN(Online): 2320-9801 ISSN (Print): 2320-9798
I
nternational
J
ournal of
I
nnovative
R
esearch in
C
omputer
and
C
ommunication
E
ngineering
(An ISO 3297: 2007 Certified Organization)
Vol. 3, Issue 2, February 2015
Step 2:
Figure 10: Estimation of Pixels after Rotation
The second NEDI step fills the remaining gaps in the same way of the first step after a π/4 rotation of the grid. The darker circles represent the pixels from the original Low Resolution grid, the white circles represent the pixels that are to be interpolated and the gray circles represent the pixels interpolated on the first step.
F. Value Adjust
iNEDI increases the probability of obtaining a good interpolation, but there is still the possibility of having unwanted high frequencies. For this reason the further constraint is, by replacing any interpolated value outside the intensity range of the four neighbors with the closest of the values delimiting that range.
G. Matrix Conditioning, Error Propagation and Minimum Norm Solution
The overconstrained system Cα = y is almost always ill-conditioned and a small error in
ycan cause a large error in the estimated α. A simple trick is to add a constant value to the gray levels, in order to have
all values far from zero. This change is effective in reducing artifacts and wrong estimates. The solution to the least squares problem is not unique.
On iNEDI, the system can be rewritten as α = C+y
where C+=(CTC)-1CT
It is the Moore-Penrose pseudoinverse matrix, and find the minimum norm solution using the Singular Value
Decomposition. In this way we avoid the direct inversion of CTC matrix
IV.RESULT&DISCUSSION
ISSN(Online): 2320-9801 ISSN (Print): 2320-9798
I
nternational
J
ournal of
I
nnovative
R
esearch in
C
omputer
and
C
ommunication
E
ngineering
(An ISO 3297: 2007 Certified Organization)
Vol. 3, Issue 2, February 2015
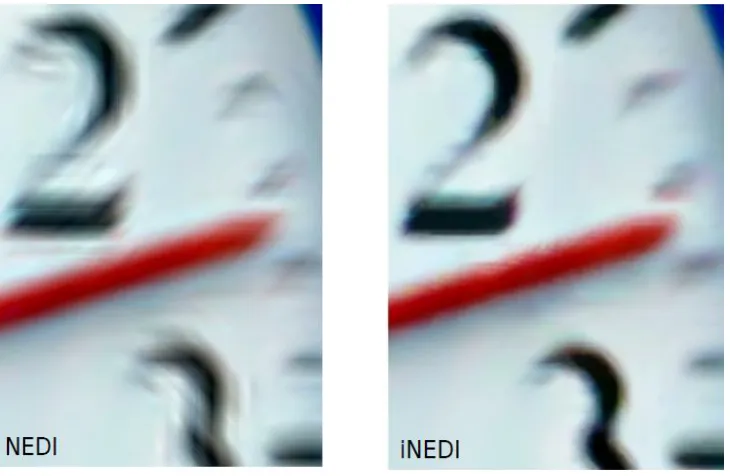
Figure 11: iNEDI vs NEDI – 16X Example
Figure 11 shows the comparison between iNEDI & NEDIwith the help of an example.
Figure 12:Selecting an Original Image
ISSN(Online): 2320-9801 ISSN (Print): 2320-9798
I
nternational
J
ournal of
I
nnovative
R
esearch in
C
omputer
and
C
ommunication
E
ngineering
(An ISO 3297: 2007 Certified Organization)
Vol. 3, Issue 2, February 2015
Figure 13:Parameter Setting Window
Figure 13 shows the parameter list which is used for applying an algorithm for upscaling an image.
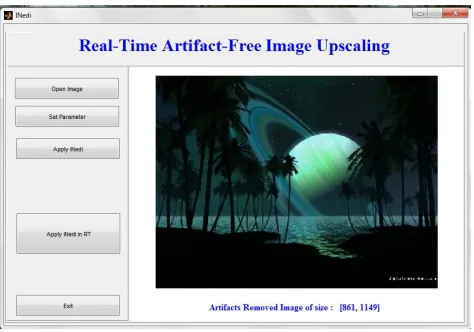
Figure 14:Artifacts Removed Upscaled Image
Figure 14 shows the artifact removed upscaled image after applying an algorithm.
4.1 Discussions
We have discussed iNEDI technique. This technique uses second-order derivatives. It uses circular window by which the efficiency of an algorithm is improved. The image quality is also improved by using this technique than any other technique. The web camera allows capturing a real time image and processes that image using iNEDI technique.
V. CONCLUSION
ISSN(Online): 2320-9801 ISSN (Print): 2320-9798
I
nternational
J
ournal of
I
nnovative
R
esearch in
C
omputer
and
C
ommunication
E
ngineering
(An ISO 3297: 2007 Certified Organization)
Vol. 3, Issue 2, February 2015
adaptive methods which could easily reach real-time performances, are not, however, able to create natural looking images and often introduce relevant artifacts.
REFERENES
[1]Giachetti and N. Asuni, “Real-Time Artifact-Free Image Upscaling”, IEEE Transactions On Image Processing, Vol. 20, No. 10, October 2011. [2]N. Asuni and A. Giachetti, “Accuracy improvements and artifacts removal in edge based image interpolation,” in Proc. 3rd Int. Conf.Comput. Vis. Theory Appl. (VISAPP), 2008, pp. 58–65.
[3]B. Atkins, C. A. Bouman, and J. P. Allebach, “Optimal image scaling using pixel classification,” in Proc. IEEE Int. Conf. Image Process., 2001, vol. 3, pp. 864–867.
[4]S. Battiato, G. Gallo, and F. Stanco, “A locally-adaptive zooming algorithm for digital images,” Image Vis. Comput., vol. 20, pp. 805–812, 2002. [5]M. J. Chen, C. H. Huang, and W. L. Lee, “A fast edge-oriented algorithm for image interpolation,” Image Vis. Comput., vol. 23, pp. 791–798, 2005.
[6]W. T. Freeman, T. R. Jones, and E. C. Pasztor, “Example-based superresolution,” IEEE Comput. Graph. Appl., vol. 22, no. 2, pp. 56–65, Mar./Apr. 2002.