!
"
#"#
$ % %#
&
'
((( )
© 2010, IJARCS All Rights Reserved 170
Prediction of Stroke Risk through Stacked Topology of ANN Model
Sabibullah M*
Asst. Prof., Dept. of MCA, J.J. College of Engg. & Technology, TIiruchirappalli, Tamilnadu-620009, India
Kasmir Raja S.V
Dean (Research), SRM University,
Kattankulathur, Chennai, Tamilnadu-603203 India [email protected]
Abstract: Artificial Neural Networks (ANN) is a very popular type of Machine Learning (ML), suited for analyzing the medical data. Estimation of stroke risks in population is not only helpful for healthcare providers but also important to identify persons at elevated risk and to select proper treatments in clinical trials. More individual risk factors may help to improve the individual risk assessment. The objective of this study is to predict the stroke risk by proposing the stacked ANN topology model with higher prediction accuracy. The proposed model is tested by using three sets of real stroke population data (300 samples) and validated through statistical metrics. Our model achieved 95.33% and 94% of accuracy in training and testing phase respectively. The obtained experimental results predicted that it is a high rate of correctness in the stroke risk prediction task.
Keywords: Stroke Risk, Artificial Neural Networks, Risk Factors, Stacked Topology, Machine Learning, Prediction.
I. INTRODUCTION
Stroke is the third leading cause of death all over the world. Stroke can lead to sudden inability to speak, move a limb, stand, see, read, feel, write, think clearly or remember. Loss of function is often instantaneous and unanticipated. Impairments may be transient (temporary) or permanent, slight or devastating. Stroke is responsible for three million deaths in developing countries [7] and a major cause in Asian countries. Current treatments for patients with established stroke are relatively ineffective and risk factor interventions are the real hope of reducing stroke morbidity and mortality in populations [5] and [1]. Estimation of stroke risks in population is not only helpful for healthcare providers but also important to identify persons at elevated risk and to select proper treatments in clinical trials. Epidemiologic studies of the risk factors for stroke are important for determining the origin and its prevention. A study from Chennai in southern India revealed hypertension, heart disease of any type, diabetes mellitus, smoking, and low HDL-cholesterol are significant risk factors.
ANN is a very popular type of Machine Learning (ML). ML technology is currently well suited for analyzing medical data and disease prediction tools using different ML based approaches have shown great potential. It has a proven track record in bio-medical applications. These are designed to carryout some tasks such as pattern recognition, prediction and classification. The performance of this type of machine learning depends on the learning algorithm and the type of the selected application, the accuracy of the modeling, and structure of each model. The most familiar type of learning algorithm for the deterministic networks is back propagation algorithm. This study is a part of our research work and objective is to predict the stroke risk by proposing the stacked ANN topology model with higher prediction accuracy. This is achieved and accomplished through the predictions of the networks in the first level ANNs are combined by a second level ANN network model.
II. RELATED STUDIES
Several researchers have attempted to apply the ANN concepts to predict the stroke diagnosis. A risk prediction tool that enables more accurate prediction of stroke in developing countries is in development. Probably, the first study was carried out by [20] demonstrated that a multivariate analysis of risk factors for stroke. Relative risk on stroke and risk factors reduction is an important step in preventing stroke. A designed prototype [17] of Expert Systems called “MICRO Stroke and TOPOSCOUT”, which were used to categorize and diagnose stroke types based on clinical information. The system comprises three knowledge databases. It produces 72.8% accuracy from 250 cases in the Hamburg Stroke Data Bank.
The neural classifying system constructed [6] in the diagnosis of three stroke types (IS-Ischemic type, HS-Hemorrhagic type and SAH-Subarachnoid HS-Hemorrhagic type). This investigation carried out more detailed processes of learning in neural networks and also proposed neuro-evolutionary method for optimization of synaptic weights of ANN. Totally 239 features were used. “Statistica” software was used for differential diagnosis. Accuracy from this study recognized as 98%.
© 2010, IJARCS All Rights Reserved 171 consistently been identified as significant predictors of
stroke outcome (mainly fatal stroke): age, hypertension, alcohol intake (inverse prediction), previous stroke, and arterial fibrillation [16]. It has briefly explained the nature of a neural model and then reviews work in neural computation involving problems in medical informatics (e.g. expert systems) and modeling of psychiatric and neurological phenomena [10]. A neural prognostic model [12] developed using back propagation training algorithm with logistic function to predict the stroke prone risk factors. 22 stroke disease patients’ data were tested, finally network predicted 90.90% sensitivity accuracy. A risk stratification method proposed [3] by constructing a feed forward neural network is trained with the back propagation algorithm with a momentum term using the software JavaNNS in the diagnosis of cardio stroke. High risk and low risk persons were categorized. The ANN recognizes the accuracy for 89.33% in training set and 82% in validation set.
A functional model [15] of ANN was proposed and used to predict the Thrombus-embolic stroke disease. Feed forward with BP algorithm was used to train the architecture (20-10-10) and tested for the various categories of stroke system. In this experiment, 21 fuzzy rules were constructed through mamdani-centroid method. Triangular and trapezoidal membership functions were used. A compact fuzzy-rule based classifier with classification accuracy and balancing transparency was also achieved after validating the fuzzy rules.
The study [18] suggested that the internal carotid artery disease is a form of disease that affects the vessels leading to the head and brain. It usually occurs due to the build-up of fatty material and plaque. Internal carotid artery plaques might be the observed symptoms during the diagnosis of internal carotid artery disease. Since the stroke is most often when these become blocked, hence early detection of changes in this artery is important. The combined neural network models were implemented for the diagnosis of this disease using statistical features as inputs. This model achieved accuracy which was higher than that of the stand-alone ANN models. The recent and novel study on stroke risk prediction [14] conducted to find the possible risk of cerebrovascular disease or stroke to Support Vector Machines (SVM). SVM is a way to devise a computationally efficient way of learning in classification. Prediction of the attack of the disease is highly dependent on quantification of risks contributed by stroke risk factors. The method of this assessment process is done through by SVM. The classification accuracies are achieved through the efficient kernel functions of SVMRBF (98%) and SVMPoly (92%) and finally results are compared with benchmarking evaluation methods.
III.MATERIALS AND METHODS
A. Risk factors in stroke
Risk factors for stroke are well documented. Prediction about the course of risk factors of the stroke is a key component of healthcare decision-making process.
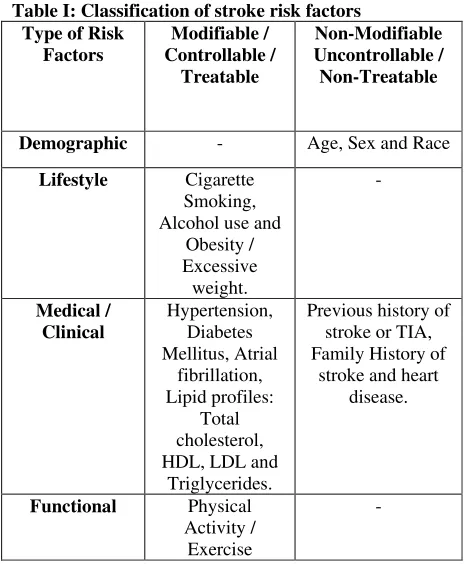
Table I: Classification of stroke risk factors Type of Risk main targets for primary and secondary prevention of stroke. More individual risk factors may help to improve the individual risk assessment [11]. Many risk factors can be changed or managed, while others cannot be changed. There are two clusters in stroke risk factors Is explained in Table 1.
B. Proposed stacked topology of ANN model
A feed forward and deterministic network with logistic activation function is employed in this study to predict the high accuracy level both in the first level and second level of Stacked Topology (ST) of neural networks. The scheme of Stacked Generalization (SG) is feeding information from one set of generalizers to another before forming the final effectively improve the generalization ability. The hospital based real data are collected from 300 patients who have symptoms of stroke disease and analyzed by using back propagation algorithm and implemented through MATLAB 7.3.0–Neural Network Toolbox.
© 2010, IJARCS All Rights Reserved 172 suitable learning algorithm (back propagation) and proper
implementation.
The pre-processing feature construction transforms the data to fit with classification accuracy and lesser computational efforts of ANN algorithms, so that learning is facilitated. The prediction task mainly depends on the training and testing samples are detailed in Tables 3 and Table 4.
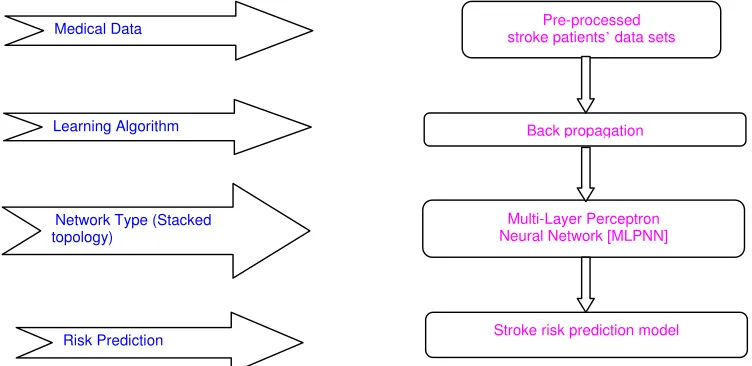
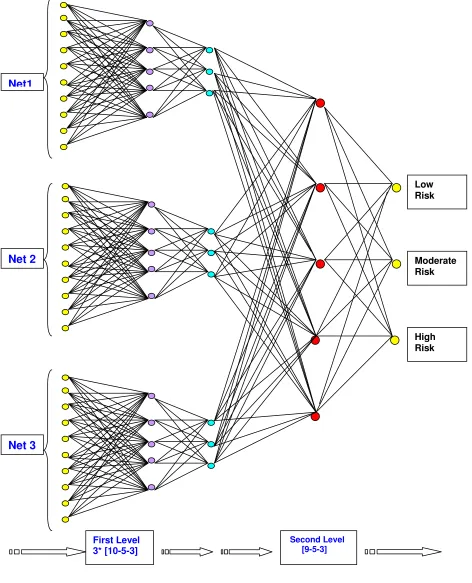
The stacked ANN topology model is used for the stroke risk prediction is shown in Figure 1 and Figure 2. In the combined ANN topology comprising two levels, i.e., first level and second level. In the first-level, back-propagation learning method is used to study different ANN models from the original data. The three sets of neural networks (Net1, Net2 and Net3) for the first-level prediction models are trained since there are three possible outcomes of the risk prediction of stroke (High risk, Moderate risk and Low risk). Networks in each set are trained so that they are likely to be more accurate for one type of risk than the other type of risk pattern. The proposed network topology is the Multi-Layer Perceptron Neural Network (MLPNN) with ten nodes of one input layer, a single hidden layer (with five hidden nodes) and one output layer with five nodes. Second level ANN will also have the probable design patterns of first level (Refer Table 2).
The model architecture parameters of first level and second level networks are assigned through deep study with pre-defined nature (before training takes place), are detailed in Table 12 and Table 13. The second-level network constructed from the nine inputs which corresponds to the outputs of the three groups of the first-level networks (Net1, Net2 and Net3). The targets for the second-level network are the same as the targets of the original data. The numbers of outputs are three and the number of hidden layer is one with five hidden neurons.
Cross-validation is a highly recommended criterion for stopping the training of a network and also to obtain the best generalization outcome. 10-fold cross-validation computa tion is highly suggested and performed to predict the high accuracy rate. (i.e., 10*20 samples = 200 samples). The 200 samples are partitioned into two groups. Training set group consisting 150 samples and remaining 50 samples forms the
testing set group. This newly constructed second level topology [9-5-3] will accept the recently formed group of training (150 samples) and testing (50 samples) patterns.
C. Input data sets
In this model prediction process, totally 300 populations of hospital based stroke cases (samples) are collected from different specialty hospitals, situated at Tiruchirappalli city, Tamilnadu, India. Data are analyzed in the dataset to define column parameters of both inputs and outputs. After data analysis, the values are identified as missing, wrong type values or outliers and which columns are rejected as mismatch with the prediction of ANN.
Prediction is made with the influenced variables of stroke risk factors, like; demographic (age, sex), lifestyle (cigarette smoking), and clinical (hypertension, diabetes, TIA, lipid profiles: total cholesterol, triglycerides, HDL and LDL). These are all identified as main indicators of stroke risk by the clinicians. The features are selected with the aid of clinical experts. Based on these parameters, the classification task performs the three output levels (High risk, Moderate risk and Low risk).
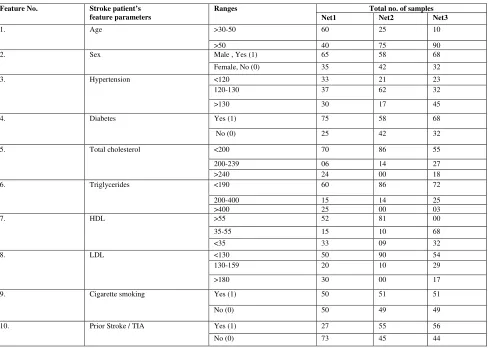
In Table 5, the characterization of the three different study populations is shown, with the basic data and
clinical variables used as inputs. The first column contains the feature no., second column represents the input feature data, the third column contains the feature’s ranges and finally fourth column contains the total no. of samples (consisting Net1, Net2 and Net3 data samples) selected for each network to the respective feature variable. The cut-off values for the data; total-cholesterol, triglycerides, HDL and LDL ranges of normality are also indicated in the third column [4].
Input dataset partition for both training and testing sets for the first level and second level network are partitioned (First level = Net1+ Net2 + Net3 and Second level = one net with cross-validated set) as mentioned in the Table 3 and Table 4 depicted below. The network input and target variables are pre-processed using binary positive values (0’s and 1’s). Later pre-processed input vectors are presented to each neural network models.
Figure 1: Block diagram of ST-ANN based stroke risk prediction model
Pre-processed stroke patients’ data sets
Back propagation
Multi-Layer Perceptron Neural Network [MLPNN]
Stroke risk prediction model
Learning Algorithm Medical Data
Network Type (Stacked topology)
© 2010, IJARCS All Rights Reserved 173
Figure 2: Stacked topology of ANN model for stroke risk prediction
Net1
Net 2
Net 3
First Level 3* [10-5-3]
Second Level [9-5-3]
Low Risk
Moderate Risk
© 2010, IJARCS All Rights Reserved
Table II: Design pattern of stacked topology of ANN
Topology / Levels
Input Hidden (Internal) Output Type of connection
used
Layer Nodes Layer Nodes Layer Nodes
First level ANN – Net 1 [10-5-3]
01 10 01 05 01 03 MLFNN (Multi-Layer Feed
Forward Neural Net)
First level ANN – Net 2 [10-5-3]
01 10 01 05 01 03 MLFNN
First level ANN – Net 3 [10-5-3]
01 10 01 05 01 03 MLFNN
Second level ANN [09-5-3]
01 09 01 05 01 03 MLFNN
Table III: Input dataset partition – First level ANN
Name of the ANN / Partitioned data set
Net1 (Data set 1)
Net2 (Dataset 2)
Net3 (Dataset 3)
Training set 80 80 80
Test set 20 20 20
Ignored set 0 0 0
Total number of samples
100 100 100
Table IV: Input dataset partition – Second level ANN [10-fold data set]
Partitioned set / Name of the data set
Training set
Test set Total
10-fold Cross-validation dataset (20 samples * 10 = 200 samples)
150 50 200
Ignored set 0 0 0
Total number of samples 200
D. ANN Learning With Back-Propagation Training Algorithm
Table V: Data set features for both first level and second level ANN
Feature No. Stroke patient’s
feature parameters
Ranges Total no. of samples
Net1 Net2 Net3
1. Age >30-50 60 25 10
>50 40 75 90
2. Sex Male , Yes (1) 65 58 68
Female, No (0) 35 42 32
3. Hypertension <120 33 21 23
120-130 37 62 32
>130 30 17 45
4. Diabetes Yes (1) 75 58 68
No (0) 25 42 32
5. Total cholesterol <200 70 86 55
200-239 06 14 27
>240 24 00 18
6. Triglycerides <190 60 86 72
200-400 15 14 25
>400 25 00 03
7. HDL >55 52 81 00
35-55 15 10 68
<35 33 09 32
8. LDL <130 50 90 54
130-159 20 10 29
>180 30 00 17
9. Cigarette smoking Yes (1) 50 51 51
No (0) 50 49 49
10. Prior Stroke / TIA Yes (1) 27 55 56
© 2010, IJARCS All Rights Reserved
Training algorithms are an integral part of ANN model development. Neural Network research led to the development of several algorithms, many of which are currently used worldwide. A good training algorithm will shorten the training time, while achieving a better accuracy. Therefore, the training process is an important characteristic of the ANNs, whereby representative examples of knowledge are iteratively presented to the network, so that it can integrate this knowledge within its structure. There are number of training algorithms used to train a MLPNN also called a Feed Forward ANN (FFANN) and a frequently used one is called the back propagation training algorithm is employed in this model process. Back propagation learning generally operates on feed forward networks that characteristically comprise three fields: an input, hidden and output field. In this application, there are three classes of outputs defined like; high risk, moderate risk and low risk both in first level and second level networks. The back propagation algorithm is summarized as below:
[a] Build a network with the chosen number of input, hidden and output units.
[b] Initialize all the weights to low (small) random values (both +ve and –ve values).
[c] Choose a training pair from the training set.
[d] Copy the input pattern (vector) to the input (network) layer.
[e] Calculate the network output.
[f] Calculate the error, i.e. the difference between the network predicted output and the desired (actual or target) output.
[g] Back propagate the summed products of the weights and errors in the output layer in order to calculate the error in the hidden units.
[h] Repeat steps 2 to 6 for each input-output pair in the training set until the error for the entire system is acceptably low.
In this research work, ANN model (for both first level and second level) consists of three layers, such as input layer, output layer and one internal layer. The ANN layers; whose structure is feed forward and fully inter-connected structure is shown in the Figure 2.
IV. STATISTICAL EVALUATION MEASURES
To evaluate the ST-ANN model, the following statistical measures (evaluation metrics) are applied in the performance evaluation of stroke risk prediction. These are sensitivity analysis, specificity analysis and confusion matrix. Explanation of these methods and computing formula for sensitivity and specificity analysis is mentioned in equation 1 and 2.
Sensitivity (True positives achieved) = TP FN
%
TP+
(1)
Specificity (True negatives achieved) = FP TN
%
TN predicted classifications done by a classification system. Performance of such a system is commonly evaluated using the data in the matrix.Table VI: Representation of confusion matrix
Actual Values Predicted Values
False True negatives, false positives and false negatives respectively.
Table 6 shows the confusion matrix for a two class classifier. The entries in the confusion matrix are;
[a] a is the number of correct predictions that an instance is negative,
[b] b is the number of incorrect predictions that an instance is positive,
[c] c is the number of incorrect predictions that an instance is negative and
[d] d is the number of correct predictions that an instance is positive.
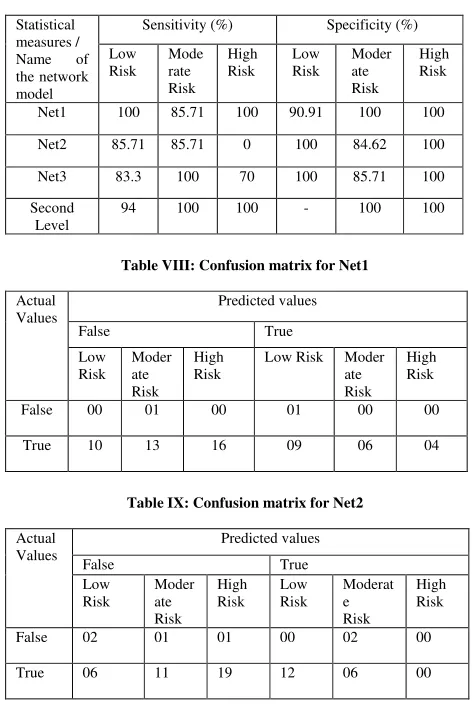
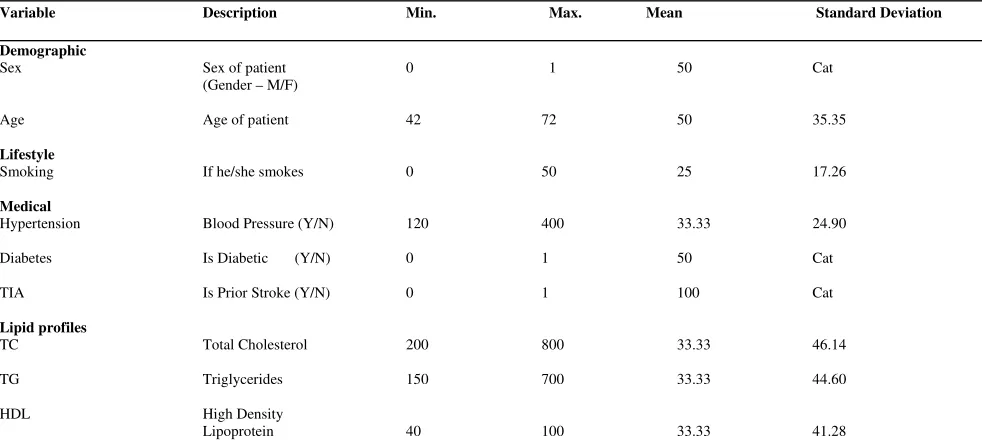
Performance accuracy of the model is assessed by statistical measures of sensitivity, specificity and confusion matrix is performed and tabulated in Table 7 to Table 11. The basic descriptive statistics for the available three datasets are analyzed and described in the Table 14 to Table 16.
Table VII: The obtained values of sensitivity and specificity by stacked ANN model in stroke risk prediction
Statistical measures /
Name of
the network model
Sensitivity (%) Specificity (%)
Low
Table VIII: Confusion matrix for Net1
Actual
Table IX: Confusion matrix for Net2
© 2010, IJARCS All Rights Reserved
Table X: Confusion matrix for Net3
Actual
Table XI: Confusion matrix for second level net
Actual
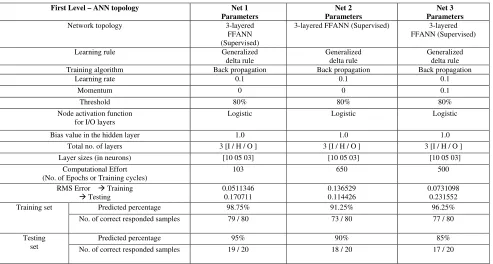
Table XII: First level stacked topology of ANN parameters and its results
First Level – ANN topology Net 1
3-layered FFANN (Supervised) 3-layered
FFANN (Supervised)
Training algorithm Back propagation Back propagation Back propagation
Learning rate 0.1 0.1 0.1
Momentum 0 0 0.1
Threshold 80% 80% 80%
Node activation function for I/O layers
Logistic Logistic Logistic
Bias value in the hidden layer 1.0 1.0 1.0
Total no. of layers 3 [I / H / O ] 3 [I / H / O ] 3 [I / H / O ]
Layer sizes (in neurons) [10 05 03] [10 05 03] [10 05 03]
Computational Effort (No. of Epochs or Training cycles)
103 650 500
Training set Predicted percentage 98.75% 91.25% 96.25%
No. of correct responded samples 79 / 80 73 / 80 77 / 80 Table 13.In both first and second level networks, training is imparted with minimum computational efforts like; 103, 650, 500 and 100 epochs respectively. Also, it is observed that from the computational effort in the first level training of Net1, the network predicted only 95% with the epochs of 100, but it is well predicted as 98.75% in 103 epochs. With tiny interval of epochs, this network predicted its good generalization ability. Similarly in Net3, with the epochs of 500 and momentum value as 0.1, the network predicted the high accuracy rate in training (96.25%) and satisfactory accuracy rate in testing phase (85%). This testing phase
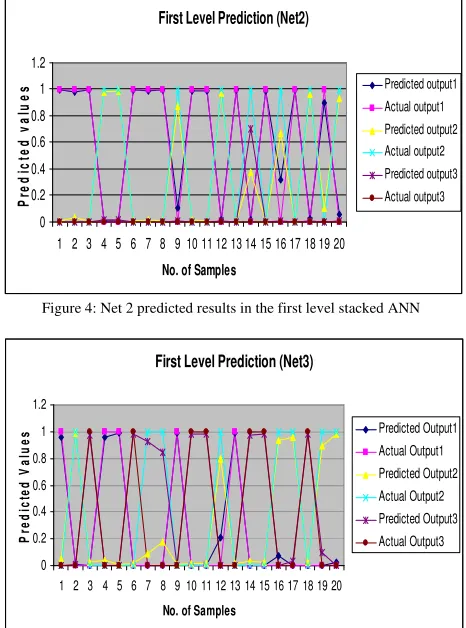
accuracy level is raised (94%) when these networks (Net1, Net2 and Net3) are combined with the structure of second level network. Out of 150 training samples, 143 samples are correctly predicted (95.33%) and in 50 testing samples, 47 samples are correctly predicted (94%) the target results by the second level combined topology of ANN. From the results, it is found that the distinct parameter values of different networks are produced the high accuracy rate in the prediction of stroke risk. The predicted outputs and actual outputs of all networks are represented through graphical structure, are shown in the Figure 3 to Figure 6.
Table XIII: Second level stacked topology of ANN parameters and its results
Second Level – ANN topology ANN Parameters
Network topology 3-layered FANN
© 2010, IJARCS All Rights Reserved
Learning rule Generalized
delta rule
Training algorithm Back propagation
Learning rate 0.2
Momentum 0
Threshold 80%
Node activation function for I/O layers Logistic
Bias value in the hidden layer 1.0
Total no. of layers 3 [I / H / O ]
Layer sizes (in neurons) [09 05 03]
Computational Effort
(No. of Epochs or Training cycles)
100
RMS Error Training Testing
0.126741 0.143221
Training set Predicted percentage 95.33%
No. of correct responded samples
143 / 150
Testing set Predicted percentage 94%
No. of correct responded samples
47 / 50
Table XIV: Descriptive statistics for dataset 1
Variable Description Min. Max. Mean Standard Deviation
Demographic
Sex Sex of patient 0 1 50 Cat
(Gender – M/F)
Age Age of patient 30 97 57.5 10.60
Lifestyle
Smoking If he/she smokes 0 50 25 17.26
Medical
Hypertension Blood Pressure (Y/N) 120 400 33.33 3.51
Diabetes Is Diabetic (Y/N) 0 1 50 Cat
TIA Is Prior Stroke (Y/N) 0 1 100 Cat
Lipid profiles
TC Total Cholesterol 200 800 33.33 33.00
TG Triglycerides 150 700 33.33 23.63
HDL High Density
Lipoprotein 40 100 33.33 18.50
LDL Low Density
Lipoprotein 130 400 33.33 15.27
Note: There are 100 records (80 for training and rest of 20 for testing) and 10 variables of interest (03 attributes are categorical (cat) and rest of 07 are continuous).
Table XV: Descriptive statistics for dataset 2
Variable Description Min. Max. Mean Standard Deviation
Demographic
Sex Sex of patient 0 1 50 Cat
(Gender – M/F)
Age Age of patient 42 72 50 35.35
Lifestyle
Smoking If he/she smokes 0 50 25 17.26
Medical
Hypertension Blood Pressure (Y/N) 120 400 33.33 24.90
Diabetes Is Diabetic (Y/N) 0 1 50 Cat
TIA Is Prior Stroke (Y/N) 0 1 100 Cat
Lipid profiles
TC Total Cholesterol 200 800 33.33 46.14
TG Triglycerides 150 700 33.33 44.60
HDL High Density
© 2010, IJARCS All Rights Reserved
LDL Low Density
Lipoprotein 130 400 33.33 49.33
Note: There are 100 records (80 for training and rest of 20 for testing) and 10 variables of interest (03 attributes are categorical (cat) and rest of 07 are continuous).
Table XVI: Descriptive statistics for dataset 3
Variable Description Min. Max. Mean Standard Deviation
Note: There are 100 records (80 for training and rest of 20 for testing) and 10 variables of interest (03 attributes are categorical (cat) and rest of 07 are continuous).
VI. CONCLUSION AND FUTURE WORK
The ST-ANN model has been developed for the use of stroke risk prediction is trained, cross-validated and tested with the extracted features from three different stroke disease data sets. The accuracy rates (94%) achieved by the ST-ANN model presented for the risk prediction of stroke found to be higher than that of the stand-alone ANN model used in our earlier study (90.90% accuracy) [12]. Hence, it is a possible approach and would be considered as a well defined tool in the treatment efficacy and treatment efficiency of stroke risk assessment. Identification and validation of new risk factors are to be grouped so as to deliver an efficient model in stroke risk prediction. It is also recommended that for the efficient applications of machine learning tools in the prediction stroke risk, an integrated effort of medical experts and computer professionals is imperative.
Figure 3: Net 1 predicted results in the first level stacked ANN
First Level Prediction (Net2)
Figure 4: Net 2 predicted results in the first level stacked ANN
First Level Prediction (Net3)
© 2010, IJARCS All Rights Reserved
Second Level Net Prediction
0 0.2 0.4 0.6 0.8 1 1.2
1 4 7 10 13 16 19 22 25 28 31 34 37 40 43 46 49
No. of Samples
P
re
d
ic
te
d
V
a
lu
e
s Predicted Output1
Actual Output1
Predicted Output2 Actual Output2
Predicted Output3
Actual Output3
Figure 6: Second level net predicted results in the stacked ANN
I. REFERENCES
[1] Adams H, Adams R, Del Zoppo G and Goldstein LB. “Stroke Council of the American Heart Association; American Stroke Association. Guidelines for the early management of patients with ischemic stroke: 2005 guidelines update: a scientific statement from the Stroke Council of the American Heart Association/American Stroke Association”. Stroke, 36: 916-923, 2005. [2] Brown RD, Whisnant JP, Sicks JD, O’Fallon WM and
Wiebers DO. “Stroke incidence, prevalence, and survival: secular trends in Rochester, Minnesota, through”. Stroke, 27: 373-380, 1989.
[3] De Beule M, Maes M, De Winter O, Vanlaere W, and Van Impe R. “Artificial Neural Networks and risk stratification: A Promising combination”. Mathematical and Computer Modeling, Vol. 46; 88-94, 2007. [4] Elaine N and Marieb, R.N. “Human anatomy &
physiology (Third Edition)”, Holyoke Community College, The Benjamin/Cummings Publishing Company Inc., New York, A10-A12, 1995.
[5] Gorelick PB. “Stroke prevention”. Arch. Neuro., 52: 347-355, 1995.
[6] Mosalov O.P, Rebrova O.Yu, and Red’ko V.G. “Neuroevolutionary Method of Stroke Diagnosis”, Optical Memory and Neural Networks (Information Optics), Vol. 16; No.2, 99-103, 2007.
[7] Murray CJ and Lopez AD. “Mortality by cause for eight regions of the world: global burden of disease study”. Lancet, 349: 1269-1276, 1997.
[8] Olga Rebrova, Valery Kilikowski, Sofia Olimpieva, and Oleg Ishanov. “Expert System and Neural Network for Stroke Diagnosis”. Int. Jr. IT&IC, Vol. 1, No. 2, 441-452, 2006.
[9] Ralph W Barnes, James F.Toole, Nelson and Virginia J. Howard. “Neural Networks for Ischemic Stroke”. Jr. of Stroke and Cerebrovascular Diseases, Vol.15, No. 5, (September-October); 223-227, 2006.
[10] Reggia, J. A. “Neural computation in medicine”. Artificial Intelligence in Medicine, 5, 143–157, 1993. [11] Renke Maas, and Rainer H Boger. “Old and new
cardiovascular risk factors: from unresolved issues to new opportunities”. Atherosclerosis Supplements, 4, 5– 17, PMID: 14664897, 2003.
[12] Sabibullah M and Kasmir Raja S.V. “A neural prognostic model for predicting stroke prone risk factors”. Bio-Science Research Bulletin, Vol.23 (No.2), 95-102, 2007.
[13] Sabibullah M and Kasmir Raja S.V. “A study on Cerebrovascular disease risk factors prediction through fuzzy inference system”. Intl. Jr. of Systems Simulation, Vol. 3, No.1, 15-23, 2009.
[14] Sabibullah M and Kasmir Raja S.V. “Stroke risk prediction through non-linear support vector classification models”. Intl. Jr. of Advanced Research in Computer Science, Vol. 1, No.3, 47-53, Sep-Oct, 2010. [15] Shanthi D, Sahoo G and Saravanan N. “Designing an
Artificial Neural Network Model for the Prediction of Thrombo-embolic Stroke”. Intl. Jr. of Biometric and Bioinformatics, Vol. 3(1); 10-18, 2009.
[16] Shaper AG, Phillips AN, Pocock SJ, Walker M and MacFarlane PW. “Risk factors for stroke in middle aged British men”. BMJ, 302:1111-1115, 1991. [17] Spitzer K, This A, Caplan LR and Kunze K. “The
MICROSTROKE expert system for stroke diagnosis”. Stroke, 20; 1353-1356, 1989.
[18] Ubeyli ED and Guler I. “Neural network analysis of internal carotid arterial Doppler signals: predictions of stenosis and occlusion”. Expert System & Applns. 25(1), 333-343, 2003.
[19] Wolpert DH. “Stacked generalization”. Neural Networks, 5, 241-259, 1992.