Page 1 of 10
Application of neural network model in assisting device fitting for
low vision patients
Bingfa Dai1,2#, Yang Yu1,2#, Lijuan Huang1,2#, Zhiyong Meng1,2, Liang Chen3, Hongxia Luo3, Ting Chen1,2, Xuelan Chen1,2, Wenwen Ye1,2, Yuyuan Yan1,2, Chi Cai2,4, Jianqing Zheng2,5, Jun Zhao6, Liquan Dong7, Jianmin Hu1,2
1Department of Ophthalmology, The Second Affiliated Hospital of Fujian Medical University, Quanzhou, China; 2Fujian Province University Engineering Research Center of Assistive Technology for Visual Impairment, Quanzhou, China; 3Fujian Assistive Devices and Technology Resource Centre for Persons with Disabilities, Fuzhou, China; 4Department of Radiology, The Second Affiliated Hospital of Fujian Medical University, Quanzhou, China; 5Department of Radiation Oncology, The Second Affiliated Hospital of Fujian Medical University, Quanzhou, China; 6Department of Ophthalmology, Shenzhen Eye Hospital Affiliated to Jinan University, Shenzhen, China; 7China Assistive Devices and Technology Centre for Persons with Disabilities, Beijing, China
Contributions: (I) Conception and design: J Hu; (II) Administrative support: L Chen, H Luo, J Zhao, L Dong; (III) Provision of study materials or patients: B Dai, L Huang; (IV) Collection and assembly of data: B Dai, Y Yu; (V) Data analysis and interpretation: Z Meng, T Chen, X Chen, W Ye, Y Yan, C Cai, J Zheng; (VI) Manuscript writing: All authors; (VII) Final approval of manuscript: All authors.
#These authors contributed equally to this work.
Correspondence to: Jianmin Hu. Doctoral supervisor, Professor, Department of Ophthalmology, The Second Affiliated Hospital of Fujian Medical University, Fujian Province University Engineering Research Center of Assistive Technology for Visual Impairment, No. 34 Zhongshanbei Road, Licheng District, Quanzhou, China. Email: [email protected].
Background: To explore the application of neural network models in artificial intelligence (AI)-aided devices fitting for low vision patients.
Methods: The data of 836 visually impaired people were collected in southwestern Fujian from May 2014 to May 2017. After a full eye examination, 629 low vision patients were selected from this group. Based on the visual functions, rehabilitation needs, and living quality scores of the selected patients, the professionals chose assistive devices that were the best fit for the patients. The data of these three factors were then subjected to the quantitative analysis, and the results were digitized and labeled. The final datasets were used to train a fully connected deep neural networks to obtain an AI-aided model for assistive device fitting. Results: In this study, the main causes of low vision in southwestern Fujian were congenital diseases, among which congenital cataract was the most common. During the low vision AI-aided devices fitting, we found that the intermediate distance magnifier was suitable for the largest number of patients. Through quantitative analysis of the research results, it was found that AI-aided devices fitting was closely related to visual function, rehabilitation needs and quality of life. If this complex relationship can be mapped into the neural network model, AI-aided device fitting can be realized. We built a fully connected neural network model for AI-aided device fitting. The input of the model was the characteristic data of low vision patients, and the output was the forecast of suitable devices. When the threshold of the model was 0.4, the accuracy was about 80% and the F1 value was about 0.31. This threshold can be used as the classification judgment threshold of the model.
Conclusions: Low vision AI-aided device fitting is closely related to visual function, rehabilitation needs, and quality of life scores. The neural network model based on full connection can achieve high accuracy in AI-aided devices fitting. It has a great impact on clinical application.
Keywords: Low vision; neural network model; artificial intelligence-aided assistive device fitting (AI-aided assistive device fitting)
Introduction
There are about 1.3 billion visually impaired people worldwide; however, only 10% of countries can provide vision rehabilitation services (1). With an aging population, it is expected that the number of visually impaired people will increase over the coming decades (2,3). Although China is one of the countries that can provide rehabilitation services, 80 million visually impaired people are not able to enjoy equal rehabilitation services due to a lack of professional care, uneven levels of diagnosis and treatment, and regional differences in economic conditions.
Computer-aided diagnosis technology is developing rapidly, and deep learning neural networks are being applied in multiple aspects of healthcare. Deep learning is able to automatically identify the more in-depth and discriminatory characteristics from data, and it can provide a scientific method for the screening, diagnosis, and evaluation of the therapeutic effects of various diseases in the clinic. It is cutting-edge technology in medical data analysis (4). In recent years, deep learning has made great progress, owing to the continuous improvement of computing power and the increase of available data, as well as the steady advancements in deep learning models and algorithms. The core of applying this new technology is in building a multi-hidden layer neural network model, using a large number of sample data for training, learning more accurate features, and improving the accuracy of model prediction (5).
Traditional statistical methods do not sufficiently solve the problems of artificial intelligence (AI)-aided assistive device fitting. At present, there is no standardized AI-aided device fitting model for clinical use (6). The Second Affiliated Hospital of Fujian Medical University Visual Impairment Rehabilitation Instruction Center is one of the few clinics which have conducted an in-depth study on the rehabilitation of low vision patients in China. In recent years, this rehabilitation instruction center has provided a device fitting to 500 low vision patients each year. However, due to the large geographic area and the different levels of social development, low vision rehabilitation led by the China Disabled Persons Federation is often adopted by an out-call device fitting in the countryside. According to the distribution of low vision patients in southwestern
Fujian, we adopted the rehabilitation mode of out-call device fitting under the request of the Fujian Disabled Persons Federation. The characteristics of this model were as follows: (I) the patients were referred from the Town Disabled Persons Federation, and the low vision device fitting and rehabilitation propaganda were carried out in one town every day. (II) The patients were accompanied by their families, so they could fully understand the quality of life questionnaire, express the rehabilitation needs, and understand the fitting process. Several studies had also confirmed that after obtaining the support of family members, patients had better cooperation in the fitting process and were more likely to continue using the devices (7,8). (III) All the staffs had 5 years of low vision rehabilitation experience and could solve patients’ problems and meet technical needs. (IV) Patients passed through to our institution from the disability federations and rural government. This embodied the characteristics of low vision screening and rehabilitation mode under the guidance of the government. Therefore, in order to enable more low vision patients to receive accurate and rapid rehabilitation services, we adopted the out-call device fitting, in hopes of implementing low vision rehabilitation in the vast rural areas in China (9).
This paper conducted a quantitative analysis study of the past 3 years on low vision patient device fitting in southwestern Fujian. An AI-aided device fitting model based on a neural network algorithm was constructed in order to obtain a fitting model that is suitable for low vision patients in all regions of the country.
Methods
Patients and data digitization
This study was approved by the Ethical Committee of the Second Affiliated Hospital of Fujian Medical University. After explaining the nature of the procedures fully, oral and written informed consent was obtained from all patients. The subjects were 836 visually impaired people (mean age, 47.7±19.6 years; age range, 7–91 years) who had out-call device fitting administered by the Second Affiliated Hospital of Fujian Medical University Visual Impairment Submitted Sep 15, 2019. Accepted for publication Feb 06, 2020.
doi: 10.21037/atm.2020.02.161
Rehabilitation Instruction Center in southwestern Fujian from May 2014 to May 2017. In total, 207 people were excluded due to multiple disabilities, mental disorders, and being beyond the low vision definition (Table 1). Finally, 629 patients (mean age, 46.1±19.92 years; age range, 8–72 years) were selected.
The out-call device fitting described in this paper was purchased by the government (welfare lottery project of the Fujian Disabled Persons’ Federation); the examination fees and application for all low vision devices were free. According to the restrictions imposed by the project requirements and funding, it was required that the maximum subsidy for each low vision patient was less than or equal to 2,000 RMB, and the number of devices obtained by each patient totaled not more than five. We attempted to provide device fitting based on the above premise and also according to the patient’s visual function, rehabilitation needs, and quality of life scores, so as to meet the needs of low vision patients as much as possible.
The process of eye examination and device fitting was as follows: the patients were accompanied by their families to the out-call low vision device fitting clinic. Ophthalmologists collected the personal medical history and family history of the low vision patients in detail. Eye position and eye movement were checked, and the anterior and posterior segment of the eye was examined by slit-lamp microscopy and direct retinoscope. The monocular and binocular distant and near visual acuity were examined with an Early Treatment Diabetic Retinopathy Study (ETDRS) chart and standard logarithmic near visual acuity chart. The visual acuity screener was used to check the refractive status. The corrected visual acuity, central and peripheral visual field, color vision, and contrast sensitivity were
checked. The rehabilitation needs and quality of life scores were collected by low vision therapists. Each patient was fitted by two experienced ophthalmologists and low vision therapists on the basis of the three factors of visual function, rehabilitation needs and quality of life scores (10). The results of each patient were recorded in detail.
The visual function (including the best-corrected visual acuity in better eye, central and peripheral visual field, color vision, contrast sensitivity), rehabilitation needs, and quality of life scores were digitally labeled, and these data were used in the training of the fully connected neural network model to obtain an AI-aided assistive device fitting model. According to the twelve o’clock position method, the one o’clock position of the central visual field defect represented a decrease of 1/12, the normal visual field value was defined as 1, and the visual field damage was converted in order. According to the visual field arc measurement method, the ratio of the defect area to the total visual field was converted into a specific value. Normal color vision was defined as 1, weak color was 0.8, color blindness was 0.5, and complete color blindness was 0. According to the results of contrast sensitivity of the MARS chart, normal contrast sensitivity (>1.5) was defined as 1, mild defect (1.04–1.48) as 2, severe defect (0.52–1.0) as 3, and depth defect (<0.48) as 4. For the rehabilitation needs factor, having distance needs were defined as 1, having near needs were defined as 2, having both distance and near needs was defined as 3, and having no needs was defined as 0.
Visualizing the database
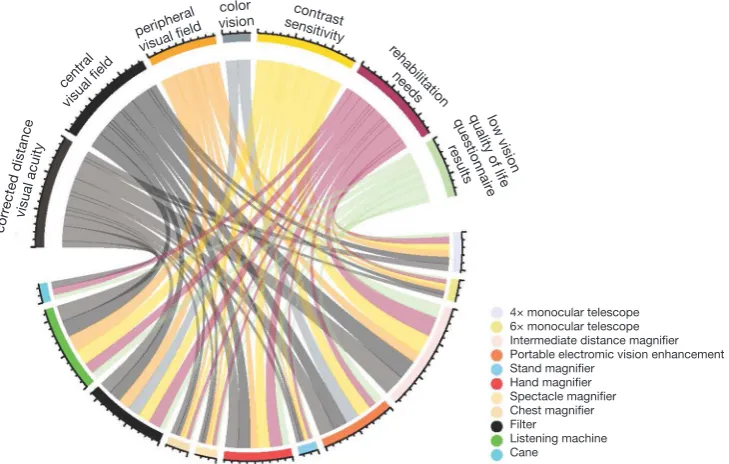
R (version 3.6.1) was used to call the “circlize” package to visualize the database (Figure 1).
Neural network construction
The main objective of the experiment was to construct a neural network model using the characteristic data of low vision patients (including visual function, rehabilitation needs, and quality of life score) with the corresponding data of device fitting, and to discover the relationship between them (11). According to the patient’s characteristic data, the model can predict the low vision device fitting information. For each patient, there were one or more adaptive device options, so the neural network model actually solved the problem of multi-label classification (12).
[image:3.595.46.288.97.245.2]In this experiment, we constructed a fully connected neural network model with four hidden layers. The input of
Table 1 Category of visual impartment
Category Presenting distance visual acuity Worse than Equal to or better than
0 – 0.3
1 0.3 0.1
2 0.1 0.05
3 0.05 0.02
4 0.02 Light perception
5 No light perception –
Figure 1 Respondence between various characteristic data of low vision patients and device fitting. low vision quality of life questionnair
e results color
vision
rehabilitation needs peripheral
visual field
central visual field
corr ected distance visual acuity
contrast sensitivity
4× monocular telescope 6× monocular telescope Intermediate distance magnifier Portable electromic vision enhancement Stand magnifier
Hand magnifier Spectacle magnifier Chest magnifier Filter
Listening machine Cane
Figure 2 Model architecture. x1
x2
x3
x4
x5
x6
x7
x8
y1
y2
y3
y4
y5
y6
y7
y8
y9
Y10
y11
X Y
Input layer
Output layers Hidden layers
128 64 32 16
the model was the feature data of the low vision patients (13). Eight feature parameters were considered, so the input dimension of the model for each patient was 8. There were 11 types of low vision devices, and the model needed to calculate the adaptation probability for each one, so the output dimension of the model was 11. The concrete structure of the model was described below (Figure 2):
A total of 629 samples were used in this experiment, 529
samples were used for model training, 50 samples were used for validation of the model, and 50 samples were used for performance testing. Based on the predicted results of the model, we classified the result by setting the threshold. The judgment formula was as follows:
0 1 i
, yi < threshold y =
, yi threshold
≥
[image:4.595.153.445.365.550.2]Table 2 The proportion of devices
Devices The number of
devices
Percentage
4X monocular telescope 80 6.7
6X monocular telescope 37 3.1
Intermediate distance magnifier 238 19.8
†P-EVES 167 13.9
Stand magnifier 48 4.0
Hand magnifier 142 11.8
Spectacle magnifier 37 3.1
Chest magnifier 61 5.1
Filter 137 11.4
Listening machine 181 15.1
Cane 73 6.1
Total 1,201 100
†, P-EVES: portable electronic vision enhancement systems.
Table 3 The number of devices obtained by patients
Number of devices Number of patients Percentage
≤2 447 71.1
≥3 182 28.9
[image:5.595.311.551.98.390.2]Total 629 100
Table 4 The leading causes of visual impairment
Cause The number of
patients
Percentage
Congenital cataract 121 19.2
Nystagmus 87 13.8
Congenital glaucoma 72 11.4
Corneal degeneration 68 10.8
Retinopathy of prematurity 59 9.4
Optic atrophy 54 8.6
High myopia 49 7.8
†AMD 40 6.4
Leber congenital amaurosis 23 3.7
Retin pigmentosa 13 2.1
Albinism 13 2.1
Congenital aniridia 10 1.6
Congenital microphthalmia 8 1.3
Cone dystrophy 7 1.1
Lens subluxation 5 0.8
Total 629 100
†, AMD: age-related macular degeneration.
where yi was the classified value from the output vector,
and the threshold was the given threshold value. It can be found from the above formula that Yi was derived from any element in the model output vector of 11 dimensions (low vision device type), the element less than the threshold value was assigned as 0 (indicating that the corresponding device was not suitable), and the element greater than or equal to the threshold value was assigned as 1 (indicating that the corresponding device was suitable) (14).
Results
Data distribution
Among the 629 patients, 400 (63.59%) were male. The age range of the study population was between 8 and 72 years, with a mean of 46.1±19.92 years. The proportion of various low vision devices was shown in Table 2. Four hundred and forty-seven (71.1%) patients received less than or equal to
two low vision devices, other 182 (28.9%) patients obtained greater than or equal to three low vision devices, and less than or equal to five low vision devices, as shown in Table 3. 43.21% of participants had moderate visual impairment, 26.54% had severe visual impairment, and 19.75% were blind. The leading causes of visual impairment were shown in Table 4. The frequently prescribed low vision devices were shown in Figure 1. The leading causes of visual impairment was consistent with some Chinese surveys (15). The relationship between vision category and low vision quality of life was shown in Table 5.
Statistical analysis
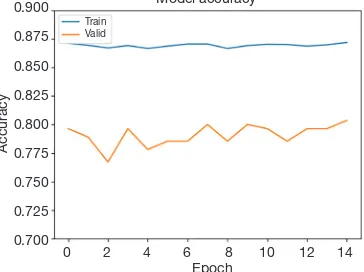
[image:5.595.45.287.373.440.2]the last epoch. The loss comparison curve and accuracy comparison curve of the training samples and validation samples in each training epoch were as follows (Figures 3,4):
The accuracy, precision, recall and F1 value of the model
performance in the test dataset with different threshold values were shown in Figure 5.
The meanings of the above curves (Figure 5) were as follows:
Assume that N_tt was the number of positive results both in the test data and predicted data, N_tf was the number of positive results in the test data while they were negative in predicted data, N_ff was the number of negative results both in the test data and predicted data, and N_ft was the number of negative results in the test data while they were positive in the predicted data.
P value (precision) was the proportion of positive identifications which was actually correct. In our paper, it represented the proportion of the patients that need for assistant adaptation predicted by the model were actually correct, but it did not mean that the higher the P value was, the better the result. We still need to consider about the R value. The value P was defined as follows:
tt
tt ft
N P =
N + N [2]
R value (recall rate) was the proportion of actual positives that were identified correctly among all the actual positives. In our paper, it represented the proportion of the patients that actually need for assistant adaptation were predicted correctly by the model, but it did not mean that the higher the R value was, the better the result. We still needed to consider about the P value. The value R was defined as follows:
tt
tt tf
N
R =
[image:6.595.336.523.86.230.2]N + N
[3] [image:6.595.47.286.108.234.2]Figure 3 Model loss curve comparison.
Figure 5 The accuracy, precision, recall and the F1 value of the model.
Figure 4 Model accuracy curve comparison. 0.60
0.55
0.50
0.45
0.40
0.35
0.30
0.25
0.20
Model loss
0 2 4 6 8 10 12 14 Epoch
Loss
Train Valid
0.900
0.875
0.850
0.825
0.800
0.775
0.750
0.725
0.700
Model accuracy
0 2 4 6 8 10 12 14
Epoch
Accuracy
Train Valid
1.0
0.8
0.6
0.4
0.2
0.0
Model loss
0.1 0.2 0.3 0.4 0.5 0.6 0.7 0.8 threshold
Value
[image:6.595.77.258.276.418.2]Precision Recall Accuracy F1
Table 5 The relationship between level of visual impairment and quality of life scores
†Level of visual
impairment
The number of patients
Quality of life scores
5 7 48.8
4 78 51.9
3 106 65.4
2 143 72.1
1 148 85.62
0 147 92.15
[image:6.595.76.258.466.602.2]The F1 value was calculated from the P value and R value by the following formula:
1 P R
F = P+ R
⋅
[4]
Value A (accuracy) was considered the comprehensive performance of the model in a positive result and negative result, and was defined as follows:
tt ff
tt tf ft ft
N N
A
N N + N N
+ =
+ + [5]
In the real fitting scene, we focused on the model performance in the positive result, but the model performance on the negative result was also very important. Therefore, we selected accuracy as the main evaluation criterion for model performance and F1 value as the auxiliary evaluation criterion (16).
By constructing a fully connected neural network model with four hidden layers, the input of the model was the characteristic data of low vision patients, and the output was the prediction of suitable devices. When the classification threshold of the model was 0.4, the accuracy was about 80%, and the F1 value was about 0.31. This threshold could be used as the classification judgment threshold of the model.
Discussion
There are about 1.3 billion visually impaired people in the world (1). Limited by the number of professionals and the uneven level of diagnosis and treatment, about 80 million people with visual impairment cannot enjoy rehabilitation services. The out-call method which is led by the China Disabled Persons Federation, can help more low vision patients receive professional device fitting. The main causes of low vision in southwestern Fujian are congenital diseases, the most common of which is congenital cataract. Other common causes include nystagmus, optic nerve atrophy, corneal degeneration, retinopathy of prematurity, etc. The causes are consistent with the relevant Chinese report (17) but are different from a few other developing countries, which shows that the level of ophthalmology and the prevention of congenital eye diseases are improving in China (18).
Like in the rehabilitation of disabilities, low vision rehabilitation is designed to improve patients’ self-care ability and quality of life, with device fitting being one of the most common forms ofrehabilitation (19). Compared
with other study’s which studied mostly young, visually impaired people, our study concentrated on middle-aged and elderly people from rural areas who had low education level and reading ability (20). Throughout the entire low vision device fitting process (including intermediate distance magnifier, portable electronic vision enhancement systems, 4× and 6× monocular telescope, hand magnifier, chest magnifier, stand magnifier, spectacle magnifier, filters, listening machine, cane), we found that the intermediate distance magnifier was suitable for the largest number of patients, while listening machine was the second most common. In contrast, the studies from other countries showed the highest acceptance for closed-circuit television (CCTV), and that telescope had low acceptance (21). The possible reason for this was that the majority of low vision patients from economically developing rural areas have no strong demand for reading and learning, but mainly for watching TV and listening. Therefore, it was necessary to further improve the quality of low vision patients in rural areas of China. Due to the low price and high popularity of smartphones in China, the electronic devices can be replaced by the magnifying function of smartphones` applications; thus, the fitting rate of electronic devices was not as high as before. Detailed visual function examination and the assessment of patients’ rehabilitation needs are critical for fitting the device. The selection of devices should proceed from simple to complex and from cheap to expensive (22). Therefore, the age, educational and economic level of patients should be considered as influencing factors of devices fitting (23).
et al. (27), they assert that the device fitting outcomes are determined by patients’ visual function, rehabilitation needs, and quality of life. Therefore, the usage of devices and comprehensive rehabilitation training can improve the quality of the patients’ lives (28). Additionally, the score of the Low Vision Quality of Life Questionnaire can also be used as a supplement to the visual function examination and rehabilitation needs (29) of patients, and, with psychological factors also greatly affecting the score, we should therefore also fully consider the mental health of patients (30).
Thus far, the research related to AI-aided device fitting for low vision patients has only used statistical models and to predict fitting results, but its reliability for clinical use has been negatively perceived (6). Most of the research on the low vision device fitting in China has focused on the rehabilitation work in big cities, so there is a lack of research on the larger rural areas. The working method of low vision rehabilitation is not mature in China, and our out-call device fitting model is conducive to the development of low vision rehabilitation in the vast rural areas of China (26). The research on the prediction model of AI-aided device fitting is helpful to explore the implementation of low vision rehabilitation programs in China. The out-call low vision device fitting program of the Second Affiliated Hospital of Fujian Medical University Visual Impairment Rehabilitation Instruction Center is in line with the policies of the Disabled Persons’ Federation of China and the cultural characteristics of China, and can thus lay a foundation for exploring of big data analysis in the AI-aided device fitting.
We constructed an AI-aided device fitting prediction model for low vision patients and used the neural network model to mine the associations between the attributes of the dataset, especially the correlation between the visual function, rehabilitation needs and device fitting. The prescription is a customized process; however, ophthalmologists can accurately prescribe prescriptions through the characteristics of patients, which is very important for the fitting (7). Devices fitting is thus actually an approximation problem. The individual’s fitting data gives the value of the function at some point, and the neural network can approximate the function by learning, which provides theoretical support for the AI-aided device fitting (8). At the same time, the parameters which defined the neural network will be determined by the dataset. We collected considerable patient data from previous fittings that can be used to train this neural network model for finding the appropriate parameters (31). By constructing a fully connected neural network model, the 629 collected
samples were iteratively trained, validated and tested. The training experiments showed that about 80% of the prediction accuracy and F1 value (about 0.31) were obtained on the test dataset when we set the classification threshold to be 0.4. The model had preliminary clinical application value.
The prediction accuracy of the model can be improved by increasing the amount of training dataset and consider more influencing factors for input into the model. The limitation of our research is that the validation of the model was based on a small sample rather than a prospective cohort study in the clinic.
Series studies (32) have shown the influencing factors related to the International Classification of Functioning (ICF) evaluation: the factors related to ICF affected low vision device fitting (33). Therefore, in terms of model input values, ICF assessment (34) should be regarded as the best match between person and devices (35). To improve the model in the future, we will take the ICF evaluation report as the input value of the model while expanding the sample quantity. In the future, our model can be applied to AI-aided devices fitting through comprehensive and scientific visual function examination and combined with patients’ private rehabilitation needs. This model can solve the problems of regional disequilibrium and uneven technological development in Chinese low vision device fitting.
Conclusions
In conclusion, based on the correlation between visual function, rehabilitation needs, quality of life scores and device fitting, we initially constructed a neural network model that can be used for AI-aided device fitting in low vision patients. In the future, as the number of patients’ data increases, the accuracy of this model and the clinic application value will be further improved.
Acknowledgments
Funding: This study was supported by the National Key Research and Development Program of China Sub-project Fund for Scholars (award number 2018YFC0116503) and the Science Research Foundation of Ministry of Health United Fujian Provincial Health, and Education Project for Tackling the Key Research (award number WKJ2016-2-12).
Footnote
Provenance and Peer Review: This article was commissioned by the Guest Editors (Haotian Lin and Limin Yu) for the series “Medical Artificial Intelligent Research” published in Annals of Translational Medicine. The article was sent for external peer review organized by the Guest Editors and the editorial office.
Conflicts of Interest: All authors have completed the ICMJE uniform disclosure form (available at http://dx.doi.
org/10.21037/atm.2020.02.161). The series “Medical
Artificial Intelligent Research” was commissioned by the editorial office without any funding or sponsorship. The authors have no other conflicts of interest to declare.
Ethical Statement: The authors are accountable for all aspects of the work in ensuring that questions related to the accuracy or integrity of any part of the work are appropriately investigated and resolved. This study was approved by the Ethics Committee of the Second Affiliated Hospital of Fujian Medical University ([2014] Ethical Examination Character [170] of the Second Affiliated Hospital of Fujian Medical University). Oral and written informed consent was obtained from all patients after the nature of the procedures had been fully explained.
Open Access Statement: This is an Open Access article distributed in accordance with the Creative Commons Attribution-NonCommercial-NoDerivs 4.0 International License (CC BY-NC-ND 4.0), which permits the non-commercial replication and distribution of the article with the strict proviso that no changes or edits are made and the original work is properly cited (including links to both the formal publication through the relevant DOI and the license). See: https://creativecommons.org/licenses/by-nc-nd/4.0/.
References
1. World Health Organization. Blindness and vision
impairment. 2018. Available online: https://www.who.int/ en/news-room/fact-sheets/detail/blindness-and-visual-impairment
2. Congdon N, O'Colmain B, Klaver CC, et al. Causes and prevalence of visual impairment among adults in the United States. Arch Ophthalmol 2004;122:477-85. 3. Robillard N, Overbury O. Quebec model for low vision
rehabilitation. Can J Ophthalmol 2006;41:362-6. 4. Guan Q, Wang Y, Du J, et al. Deep learning based
classification of ultrasound images for thyroid nodules: a
large scale of pilot study. Ann Transl Med 2019;7:137.
5. Lei Z, Yi Z. Big data analysis by infinite deep neural networks. Journal of Computer Research and Development
2016;53:68-79.
6. Engesser D, Engesser R, Stifter J, et al. Is the patient record sufficient for prescribing low-vision magnification
aids or is a consultation in a low-vision clinic required? Klin Monbl Augenheilkd 2019;236:907-10.
7. Watson GR, De l'Aune W, Stelmack J, et al. National
survey of the impact of low vision device use among veterans. Optom Vis Sci 1997;74:249-59.
8. Watson GR, De l'Aune W, Long S, et al. Veterans'
use of low vision devices for reading. Optom Vis Sci 1997;74:260-5.
9. Zhao J, Ellwein LB, Cui H, et al. Prevalence of vision
impairment in older adults in rural China: the China nine-province survey. Ophthalmology 2010;117:409-16, 416.e1.
10. Xue WW, Zhang P, Zou HD. Responsiveness and minimal
clinically important difference of the Chinese version
of the Low Vision Quality of Life Questionnaire after cataract surgery. Int J Ophthalmol 2019;12:504-9. 11. Shi H, Xie P, Hu Z, et al. Towards automated
ICD coding using deep learning. arXiv preprint arXiv:1711.04075, 2017.
12. Kucur ŞS, Holló G, Sznitman R. A deep learning approach
to automatic detection of early glaucoma from visual fields. PLoS One 2018;13:e0206081.
13. Wang M, Shen LQ, Pasquale LR, et al. An artificial intelligence approach to detect visual field progression
in glaucoma based on spatial pattern analysis. Invest Ophthalmol Vis Sci 2019;60:365-75.
14. Ilse M, Tomczak JM, Welling M. Attention-based deep multiple instance learning. arXiv preprint arXiv:1802.04712, 2018.
15. Gao G, Yu M, Dai J, et al. Demographic and clinical
16. Shelhamer E, Long J, Darrell T. Fully convolutional
networks for semantic segmentation. IEEE Trans Pattern Anal Mach Intell 2017;39:640-51.
17. Wu Z, Meng D, Fang C, et al. PITX3 mutations
associated with autosomal dominant congenital cataract in the Chinese population. Mol Med Rep 2019;19:3123-31. 18. Bakkar MM, Alzghoul EA, Haddad MF. Clinical
characteristics and causes of visual impairment in a
low vision clinic in northern Jordan. Clin Ophthalmol
2018;12:631-7.
19. Lorenzini MC, Wittich W. Factors related to the use
of magnifying low vision aids: a scoping review. Disabil Rehabil 2019:1-13.
20. Virgili G, Acosta R, Bentley SA, et al. Reading aids for adults with low vision. Cochrane Database Syst Rev 2018;4:CD003303.
21. Rinnert T, Lindner H, Behrens-Baumann W. At home
utilization of low-vision aids by the visually impaired. Klin Monbl Augenheilkd 1999;215:305-10.
22. Grein HJ. Low vision: provision of the visually
handicapped with magnifying aids. II. Matching and prescription. Ophthalmologe 2002;99:884-900.
23. Wilkinson ME, Shahid KS. Low vision rehabilitation: an update. Saudi J Ophthalmol 2018;32:134-8.
24. Burggraaff MC, van Nispen RM, Melis-Dankers BJ, et
al. Effects of standard training in the use of closed-circuit televisions in visually impaired adults: design of a training protocol and a randomized controlled trial. BMC Health Serv Res 2010;10:62.
25. Shuttleworth GN, Dunlop A, Collins JK, et al. How
effective is an integrated approach to low vision rehabilitation? Two year follow up results from south
Devon. Br J Ophthalmol 1995;79:719-23.
26. Dougherty BE, Kehler KB, Jamara R, et al. Abandonment
of low-vision devices in an outpatient population. Optom Vis Sci 2011;88:1283-7.
27. Rosenbloom AA. Prognostic factors in low vision
rehabilitation. Am J Optom Arch Am Acad Optom
1970;47:600-5.
28. Kang SH, Hong SW, Im SK, et al. Effect of myopia on the thickness of the retinal nerve fiber layer measured
by Cirrus HD optical coherence tomography. Invest Ophthalmol Vis Sci 2010;51:4075-83.
29. Marsland D, Leoussi AS, Norcross P. Disability abated: audio-cassettes for the visually impaired. J R Soc Health
1994;114:29-32.
30. Tabrett DR, Latham K. Factors influencing self-reported
vision-related activity limitation in the visually impaired. Invest Ophthalmol Vis Sci 2011;52:5293-302.
31. Zheng C, Johnson TV, Garg A, et al. Artificial intelligence
in glaucoma. Curr Opin Ophthalmol 2019;30:97-103.
32. Chang KF, Chang KH, Chi WC, et al. Influence of
visual impairment and hearing impairment on functional dependence status among people in Taiwan-An evaluation
using the WHODAS 2.0 score. J Chin Med Assoc
2018;81:376-82.
33. Leissner J, Coenen M, Froehlich S, et al. What explains
health in persons with visual impairment? Health Qual
Life Outcomes 2014;12:65.
34. World Health Organization. ICF International
classification of functioning, disability and health. Geneva: World Health Organization, 2001.
35. Arthanat S, Bauer SM, Lenker JA, et al. Conceptualization
and measurement of assistive technology usability. Disabil Rehabil Assist Technol 2007;2:235-48.