An Automatic Evaluation Method for Localization Oriented
Lexicalised EBMT System
Jianmin Yao+, Ming Zhou++, Tiejun Zhao+, Hao Yu+, Sheng Li+
+School of Computer Science and Technology
Harbin Institute of Technology, Harbin, China, 150001
{james, tjzhao, yu, shengli}@mtlab.hit.edu.cn
++Natural Language Computing Group
Microsoft Research Asia Beijing, China, 100080 [email protected]
Abstract
To help developing a localization oriented EBMT system, an automatic machine translation evaluation method is implemented which adopts edit distance, cosine correlation and Dice coefficient as criteria. Experiment shows that the evaluation method distinguishes well between “good” translations and “bad” ones. To prove that the method is consistent with human evaluation, 6 MT systems are scored and compared. Theoretical analysis is made to validate the experimental results. Correlation coefficient and significance tests at 0.01 level are made to ensure the reliability of the results. Linear regression equations are calculated to map the automatic scoring results to human scorings.
Introduction
Machine translation evaluation has always been a key and open problem. Various evaluation methods exist to answer either of the two questions (Bohan 2000): (1) How can you tell if a machine translation system is “good”? And (2) How can you tell which of two machine translation systems is “better”? Since manual evaluation is time consuming and inconsistent, automatic methods are broadly studied and implemented using different heuristics. Jones (2000) utilises linguistic information such as balance of parse trees, N-grams, semantic co-occurrence and so on as indicators of translation quality. Brew C (1994) compares human rankings and automatic measures to decide the translation quality, whose criteria involve word frequency, POS tagging
distribution and other text features. Another type of evaluation method involves comparison of the translation result with human translations. Yokoyama (2001) proposed a two-way MT based evaluation method, which compares output Japanese sentences with the original Japanese sentence for the word identification, the correctness of the modification, the syntactic dependency and the parataxis. Yasuda (2001) evaluates the translation output by measuring the similarity between the translation output and translation answer candidates from a parallel corpus. Akiba (2001) uses multiple edit distances to automatically rank machine translation output by translation examples. Another path of machine translation evaluation is based on test suites. Yu (1993) designs a test suite consisting of sentences with various test points. Guessoum (2001) proposes a semi-automatic evaluation method of the grammatical coverage machine translation systems via a database of unfolded grammatical structures. Koh (2001) describes their test suite constructed on the basis of fine-grained classification of linguistic phenomena.
significance test and linear correlation are calculated. Compared with previous works, ours is special in the following ways: 1) It is developed for localisation-oriented EBMT, which demands higher translation quality. 2) Statistical measures are introduced to verify the significance of the experiments. Linear regression provides a bridge over human and automatic scoring for systems.
The paper is organised as follows: First the localization-oriented lexicalised EBMT system is introduced as the background of evaluation task. Second the automatic evaluation method is further described. Both theoretical and implementation of the evaluation method are fully discussed. Then six systems are evaluated both manually and with our automatic method. Consistency between the two methods is analysed. At last before the conclusion, linear correlation and significance test validate the result and exclude the possibility of random consistency.
1 EBMT Evaluation Solution
1.1 EBMT System Setup
From Figure 1 you can get a general overview of our EBMT system.
Input sentence
Transfer <Phrase Alignment>
Translation result Resources
(Bilingual and monolingual) Example Base
(Software
manual) Match
[image:2.612.314.530.277.555.2]Recombine
Figure 1. Flowchart of the EBMT System
The EBMT system is developed for localization purpose, which demands the translation to be restricted in style and expression. This makes it rational to take string similarity as criterion for translation quality evaluation. The solution is useful because in localization, an example based machine translation system helps only if it outputs the very high quality translation results.
1.2 Evaluation Criteria
The criteria we utilise for evaluation include edit distance, dice coefficient and cosine correlation between (the vectors or word bag sets of) the machine translation and the gold standard translation. Followed is a detailed description of the three criteria.
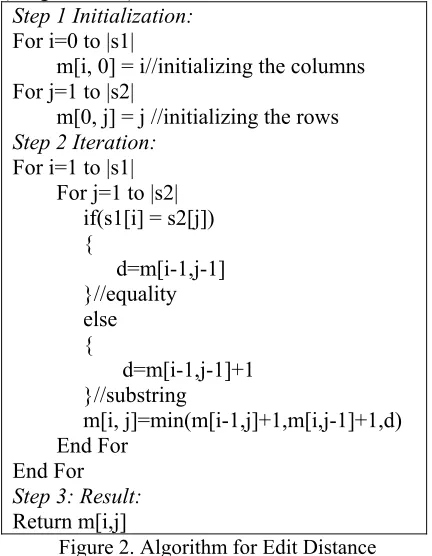
The edit distance between two strings s1 and s2, is defined as the minimum number of operations to become the same (Levenshtein1965). It gives an indication of how `close' or ‘similar’ two strings are. Denote the length of a sentence s as |s|. A two-dimensional matrix, m[0...|s1|,0...|s2|] is used to hold the edit distance values. The algorithm is as follows (Wagner 1974):
[image:2.612.90.295.433.573.2]Step 1 Initialization: For i=0 to |s1|
m[i, 0] = i//initializing the columns For j=1 to |s2|
m[0, j] = j //initializing the rows Step 2 Iteration:
For i=1 to |s1| For j=1 to |s2|
if(s1[i] = s2[j]) {
d=m[i-1,j-1] }//equality else {
d=m[i-1,j-1]+1 }//substring
m[i, j]=min(m[i-1,j]+1,m[i,j-1]+1,d) End For
End For Step 3: Result: Return m[i,j]
Figure 2. Algorithm for Edit Distance
The time complexity of this algorithm is O(|s1|*|s2|). If s1 and s2 have a `similar' length, about `n' say, this complexity is O(n2).
Taking into account the lengths of translations, the edit distance is normalised as
2 1
) 2 , 1 ( d 2 tDistance normal_edi
s s
s s + ×
=
task, it is a similarity criterion defined as follows: ∑ = × ∑= ∑ = × = n 1 i n 1 i 2 w2i 2 w1i n 1
i (w1i 2i) s2)
cos(s1,
w
(2) Where
w1i = weight of ith term in vector of sentence s1,
w2i = weight of ith term in vector for sentence s2,
n = number of words in sum vector of s1 and s2. The cosine correlation reaches maximum value of 1 when the two strings s1 and s2 are the same, while if none of the elements co-occurs in both vectors, the cosine value will reach its minimum of 0.
Another criterion we utilised is the Dice coefficient of element sets of strings s1 and s2,
2 1 2 1 2 ) 2 , 1 ( s s s s s s Dice + × = I (3) The Dice coefficient demonstrates the intuitive that good translation tends to have more common words with standard than bad ones. This is especially true for example based machine translation for localization purpose. 1.3 Relationship Among Similarity Criteria In this section we analyse the relationship between the criteria so that we have a better understanding of the experiment results.
If weight of all words are 1, i.e. each word has the uniform importance to translation quality, the cosine value becomes very similar to the Dice coefficient criterion. if we assume
= else 0 rs both vecto in occurs ith word the iff 1 bi = else 0 s1 of in vector occurs ith word the iff 1 1i b = else 0 s2 of in vector occurs ith word the iff 1 2i b then ∑ = × ∑= ∑ = × = n 1 i n 1 i 2 w2i 2 w1i n 1
i (w1i 2i) s2) cos(s1, w ∑ = ×∑= ∑ = = n i n i b i i b n i bi 1 1 2 2 2 1 1 2 1 2 1
1 1 12 1 s s s s n i n i b i i b n i bi × = ∑ = ×∑= ∑ = = I
Similar to (3), this is also a calculation of the number of words in common The Dice coefficient and cosine function have common characteristics. Especially when two strings are of the same length, we have
) 2 , 1 ( 2 1 2 1 2 1 2 1 1 1 2 1 2 1 2 1
1 1 12 1 ) 2 , 1 cos(
Dice s s s s s s s s s s s s s s s s s n i n i b i i b n i bi s s = + × = = × = × = ∑ = ×∑= ∑ = = I I I I
The above equation holds if and only if |s1| == |s2|. The experimental results will clearly demonstrate the correspondence between cosine correlation and Dice coefficient. The two values become more similar as the lengths of the two strings draw nearer. They become the same when the two sentences are of the same length.
The (normalized) edit distance evaluation has a somewhat different variance from the other two values. Edit distance cares not only how many words there are in common, but also takes into account the factor of word order adjustment. For example, take two strings of s1 and s2 composed of words,
s1 = w1 w2 w3 w4 s2 = w1 w3 w2 w4 Then, 1 4 4 4 2 2 1 2 1 2 ) 2 , 1 ( = + × = + × = s s s s s s Dice I 1 4 4 4 1 1 2 2 2 1 1 ) 2 , 1 cos( = × = ∑ = ∑ = × ∑ = = n i n i i b i b n i bi s s 5 . 0 4 4 2 2 2 1 ) 2 , 1 ( d 2 tDistance normal_edi 2 s2) ce(s1, editDistan = + × = + × = = s s s s
Edit distance and the other two criteria have their respective good aspects and shortcomings. So they can complement each other in the evaluation work.
of the three factors, while no more complexity arises from this combination.
2 Experiments and Results
2.1 Experimental Setup
Our evaluation method is designed to help in developing the EBMT system. It is supposed to sort the translations by quality. Experiments show that it works well sorting the sentences by order of it’s being good or bad translations. In order to justify the effectiveness of the evaluation method, we also design experiments to compare the automatic evaluation with human evaluation. The result shows good compatibility between the automatic and human evaluation results. Followed are details of the experimental setup and results.
In order to evaluate the performance of our EBMT system, a sample from a bilingual corpus of Microsoft Software Manual is taken as the standard test set. Denote the source sentences in the test set as set S, and the target T. Sentences in S are fed into the EBMT system. We denote the output translation set as R. Every sentence ti in T is compared with the corresponding sentence ri in R. Evaluation results are got via the functions cosine(ti, ri), Dice(ti, ri), and normalized edit distance normal_editDistance(ti, ri). As discussed in the previous section, good translations tend to have higher values of cosine correlation, Dice coefficient and lower edit distance. After sorting the translations by these values, we will see clearly which sentences are translated with high quality and which are not. Knowledge engineers can obtain much help finding the weakness of the EBMT system.
Some sample sentences and evaluation results are attached in the Appendix. In our experience, with Dice as example, the
translations scored above 0.7 are fairly good translations with only some minor faults; those between 0.5 and 0.7 are faulty ones with some good points; while those scored under 0.4 are usually very bad translations. From these examples, we can see that the three criteria really help sorting the good translation from those bad ones. This greatly aids the developers to find out the key faults in sentence types and grammar points.
2.2 Comparison with Human Evaluation In the above descriptions, we have presented our theoretical analysis and experimental results of our string similarity based evaluation method. The evaluation has gained the following achievements: 1) It helps distinguishing “good” translations from “bad” ones in developing the EBMT system; 2) The scores give us a clear view of the quality of the translations in localization based EBMT. In this section we will make a direct comparison between human evaluation and our automatic machine evaluation to test the effectiveness of the string similarity evaluation method. To tackle this problem, we carry out another experiment, in which human scoring of systems are compared with the machine scoring.
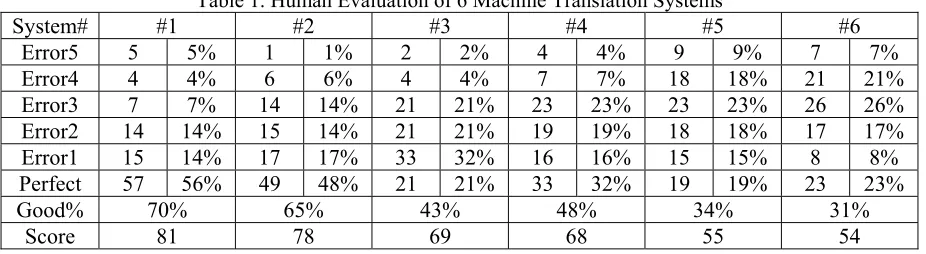
[image:4.612.74.537.591.718.2]The human scoring is carried out with a test suite of High School English. Six undergraduate students are asked to score the translations independent from each other. The average of their scoring is taken as human scoring result. The method is similar to ALPAC scoring system. We score the translations with a 6-point scale system. The best translations are scored 1. If it’s not so perfect, with small errors, the translation gets a score of 0.8. If a fatal error occurs in the translation but it’s still understandable, a point of 0.6 is scored. The worst translation gets 0
Table 1. Human Evaluation of 6 Machine Translation Systems
System# #1 #2 #3 #4 #5 #6
Error5 5 5% 1 1% 2 2% 4 4% 9 9% 7 7% Error4 4 4% 6 6% 4 4% 7 7% 18 18% 21 21%
Error3 7 7% 14 14% 21 21% 23 23% 23 23% 26 26%
Error2 14 14% 15 14% 21 21% 19 19% 18 18% 17 17%
Error1 15 14% 17 17% 33 32% 16 16% 15 15% 8 8%
Perfect 57 56% 49 48% 21 21% 33 32% 19 19% 23 23%
Good% 70% 65% 43% 48% 34% 31%
point of score. Table 1 shows the manual evaluation results for 6 general-purpose machine translation systems available to us. In table 1, Error5 means the worst translation. Error4 to Error1 are better when the numbering becomes smaller. A translation is labelled “Perfect” when it’s a translation without any fault in it. “Good%” is the sum of percent of “Error1” and “Perfect”. Because “Error1” translations refer to those have small imperfections. “Score” is the weighted sum of scores of the 6 kinds of translations. E.g. for machine translation system MTS1, the score is calculated as follows:
81 1 57 8 . 0 15 6 . 0 14
4 . 0 7 2 . 0 4 0 5 ) 1 (
= × + × + ×
+ × + × + × = MTS score
In table 2, the human scorings and automatic scorings of the 6 machine translation systems are listed. The translations of system #1 are taken as standard for automatic evaluations, i.e. all scorings are made on the basis of the result of system #1. In principle this will introduce some errors, but we suppose it not so great as to invalidate the automatic evaluation result. This is also why the scorings of system #1 are 100. The last row labele AutoAver is the average of automatic evaluations.
Table 2. Scoring of 6 MT Systems
System# #1 #2 #3 #4 #5 #6 Human 100 78 69 68 55 54
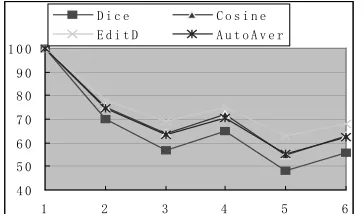
Dice 100 70 57 65 48 56
[image:5.612.335.511.111.234.2]Cosine 100 75 64 72 55 63 Edistance 100 78 69 75 63 68 AutoAver 100 74 63 71 55 62 Figure 3 presents the scorings of Dice coefficient, cosine correlation, edit distance and the average of the three automatic criterions in a chart, we can clearly see the consistency among these parameters.
4 0 5 0 6 0 7 0 8 0 9 0 1 0 0
1 2 3 4 5 6
D i c e C o s i n e E d i t D A u t o A v e r
Figure 3. Automatic Scoring of 6 MT Systems
In Figure 3, the numbers on X-axis are the numbering of machine translation systems, while the Y-axis denotes the evaluation scores.
4 0 5 0 6 0 7 0 8 0 9 0 1 0 0
1 2 3 4 5 6
[image:5.612.95.277.576.683.2]H u m a n A u t o m a t i c
Figure 4. Scoring of 6 MT Systems
The human and automatic average scoring is shown in Figure 4. The Automatic data refers to the average of Dice, cosine correlation and edit distance scorings. On the whole, human and automatic evaluations tend to present similar scores for a specific system, e.g. 78/74 for system #2, while 69/63 for system #3.
3 Result Analysis
The experimental results and the charts have shown some intuitionistic relationship among the automatic criteria of Dice coefficient, cosine value, edit distance and the human evaluation result. A more solid analysis is made in this section to verify this relationship. Statistical analysis is a useful tool to 1) find the relationship between data sets and 2) decide whether the relationship is significant enough or just for random errors.
The measure of linear correlation is a way of assessing the degree to which a linear relationship between two variables is implied by observed data. The correlation coefficient between variable X and Y is defined as
Y Xs
s Y X COV
Y
X
r
(
,
)
=
( , )(7) where
COV(X,Y) is the covariance defined by
∑
− −−
= ( )( )
1 1 ) ,
( X X Y Y
n Y X
COV i i
(8) The symbol meanings are as follows:
sX: sample standard deviation of variable X sY: sample standard deviation of variable Y n: sample size
Xi (Yi) : the ith component of variable X (Y)
From its definition, we know that the correlation coefficient is scale-independent and
−
1
≤
r
≤
1
. After we get the correlation coefficient r, a significance test at the levelα
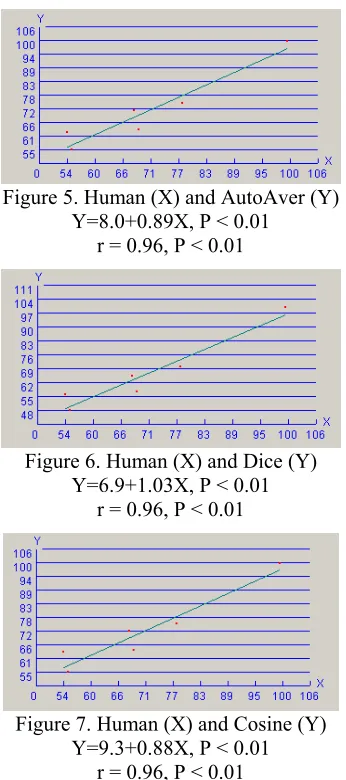
=0.01 is made to verify whether the correlation is real or just due to random errors. Linear regression is used to construct a model that specifies the linear relationship between the variables X and Y. A scatter diagram and regression line will be presented for an intuitionistic view of the relationship. The results are presented in the graphs below. In the graphs, the human evaluation results are placed on the X axis, while the automatic results are on the Y axis. Correlation coefficient and the linear regression equation are shown below the graphs. Taking into the sample size and the correlation coefficient, the significance level is also calculated for the statistical analysis.Figure 5. Human (X) and AutoAver (Y) Y=8.0+0.89X, P < 0.01
[image:6.612.337.507.67.193.2]r = 0.96, P < 0.01
Figure 6. Human (X) and Dice (Y) Y=6.9+1.03X, P < 0.01
r = 0.96, P < 0.01
Figure 7. Human (X) and Cosine (Y) Y=9.3+0.88X, P < 0.01
r = 0.96, P < 0.01
Figure 8. Human (X) and Edistance (Y) Y=23.3+0.74X, P < 0.01
r = 0.95, P < 0.01
It is a property of r that it has a value domain of [-1,+1]. A positive r implies that the X and Y tend to increase/decrease together. A minus r implies a tendency for Y to decrease as X increases and vice versa. When there is no particular relation between X and Y, r tends to have a value close to zero. From the above analysis, we can see that the Dice coefficient, cosine, and average of the automatic values are highly correlated with the human evaluation results with r=0.96. P < 0.01 shows the two variables are strongly correlated with a significance level beyond the 99%. While P < 0.01 for the linear regression equation has the same meaning.
Conclusion
Our evaluation method is designed for the localization oriented EBMT system. This is why we take string similarity criteria as basis of the evaluation. In our approach, we take edit distance, dice coefficient and cosine correlation between the machine translation results and the standard translation as evaluation criteria. A theoretical analysis is first made so that we can know clearly the goodness and shortcomings of the three factors. The evaluation has been used in our development to distinguish bad translations from good ones. Significance test at 0.01 level is made to ensure the reliability of the results. Linear regression and correlation coefficient are calculated to map the automatic scoring results to human scorings.
Acknowledgements
[image:6.612.99.272.319.709.2]Technology. Their help has contributed much to this paper.
References
A. Guessoum, R. Zantout, Semi-Automatic Evaluation of the Grammatical Coverage of Machine Translation Systems, MT Summit’ conference, Santiago de Compostela, 2001
Brew C, Thompson H.S, Automatic Evaluation of Computer Generated Text: A Progress Report on the TextEval Project, Proceedings of the Human Language Technology Workshop, 108-113, 1994. Christopher D. Manning, Hinrich Schutze,
Foundations of Statistical Natural Language Processing, the MIT Press, 1999, 530-572
Douglas A. Jones, Gregory M. Rusk, 2000, Toward a Scoring Function for Quality-Driven Machine Translation, Proceedings of COLING-2000.
Keiji Yasuda, Fumiaki Sugaya, etc, An Automatic Evaluation Method of Translation Quality Using Translation Answer Candidates Queried from a Parallel Corpus, MT Summit’ conference, Santiago de Compostela, 2001
Language and Machines. Computers in Translation and Linguistics, (ALPAC report, 1966). National Academy of Sciences, 1966
Niamh Bohan, Elisabeth Breidt, Martin Volk, 2000, Evaluating Translation Quality as Input to Product Development, 2nd International Conference on Language Resources and Evaluation, Athens, 2000. Shoichi Yokoyama, Hideki Kashioka, etc., An
Automatic Evaluation Method for Machine Translation using Two-way MT, 8th MT Summit conference, Santiago de Compostela, 2001
Sungryong Koh, Jinee Maeng, etc, A Test Suite for Evaluation of English-to-Korean Machine Translation Systems, MT Summit’ conference, Santiago de Compostela, 2001
Shiwen Yu, Automatic Evaluation of Quality for Machine Translation Systems, Machine Translation, 8: 117-126, 1993, Kluwer Academic Publishers, printed in the Netherlands.
Wagner A.R. and Fischer M., The string-to-stirng correction problem, Journal of the ACM, Vol. 21, No. 1, 168-173
V.I. Levenshtein, Binary codes capable of correcting deletions, insertions and reversals. Doklady Akademii Nauk SSSR 163(4) 845-848, 1965
Yasuhiro Akiba, Kenji Imamura, and Eiichiro Sumita, Using Multiple Edit Distances to Automatically Rank Machine Translation Output, MT Summit’ conference, Santiago de Compostela, 2001
Appendix: Automatic Evaluation Results
cosine Dice edistance* ` standard translation&EBMT translation
0.27273 0.27273 44/6=7 不是有效的扩展MAPI库。
是无效的extendedmapi库
0.43301 0.42857 28/6=4 电子邮件工具列表
列表mail工具
0.53452 0.53333 30/7=4 为此用户选择角色
选择role此用户
0.62994 0.625 32/4=8 插入下一个连续号码
插入下一序列号
0.7 0.7 80/16=5 以磅为单位将文字行在页面的垂直方向上移动
相对于页面以磅为单位移动文字行的纵向位置
0.72058 0.72 50/11=4 用图片格式插入链接的对象
将链接的对象插入为一幅图片
0.78335 0.78261 46/3=15 用文本格式插入链接的对象
以文本形式插入链接对象
0.81786 0.81633 98/20=4 以磅为单位将后续文字移动到与栏或图文框相关的水平位置
相对于栏或框架以磅为单位移动后续文字的水平位置
0.8528 0.84211 76/12=6 插入以数据记录号作为结尾的数据,然后是开关。
插入以开关后数据记录号结尾的数据
0.86772 0.86486 37/2=18 请选择要执行的操作:
选择要执行的操作:
0.875 0.875 32/1=32 最近使用文件列表
最近所用文件列表
0.90889 0.90476 42/2=21 计划远程邮件传递时程...
计划远程邮件传递...