Clinical Epidemiology
Dove
press
O r i g i n a l r E s E a r C h
open access to scientific and medical research
Open access Full Text article
Bias in identification of the best treatment
in a Bayesian network meta-analysis
for binary outcome: a simulation study
Taddele Kibret1
Danielle Richer2
Joseph Beyene1,2
1Department of Mathematics and
statistics, 2Department of Clinical
Epidemiology and Biostatistics, McMaster University, Hamilton, On, Canada
Correspondence: Joseph Beyene 1280 Main Street West, MDCL 3211, hamilton, On l8s 4K1, Canada Tel +1 905 525 9140 ext 21333 Fax +1 905 528 2814
Email [email protected]
Abstract: Network meta-analysis (NMA) has emerged as a useful analytical tool allowing comparison of multiple treatments based on direct and indirect evidence. Commonly, a hier-archical Bayesian NMA model is used, which allows rank probabilities (the probability that each treatment is best, second best, and so on) to be calculated for decision making. However, the statistical properties of rank probabilities are not well understood. This study investigates how rank probabilities are affected by various factors such as unequal number of studies per comparison in the network, the sample size of individual studies, the network configuration, and effect sizes between treatments. In order to explore these factors, a simulation study of four treatments (three equally effective treatments and one less effective reference) was conducted. The simulation illustrated that estimates of rank probabilities are highly sensitive to both the number of studies per comparison and the overall network configuration. An unequal number of studies per comparison resulted in biased estimates of treatment rank probabilities for every network considered. The rank probability for the treatment that was included in the fewest number of studies was biased upward. Conversely, the rank of the treatment included in the most number of studies was consistently underestimated. When the simulation was altered to include three equally effective treatments and one superior treatment, the hierarchical Bayesian NMA model correctly identified the most effective treatment, regardless of all factors varied. The results of this study offer important insight into the ability of NMA models to rank treat-ments accurately under several scenarios. The authors recommend that health researchers use rank probabilities cautiously in making important decisions.
Keywords: multiple treatment meta-analysis, mixed treatment comparison, ranking, network configuration
Background
Meta-analysis is a statistical procedure that can be used to synthesize evidence from multiple studies to determine the common effect when effect sizes are consistent, or to identify reasons for variation between studies when effects are inconsistent.1,2
The traditional meta-analysis method allows comparison of two interventions. In practice, there are often multiple therapies for a particular disease.3 Sound decision
making requires comparisons of all available, relevant competing interventions.4,5 The
comparative effectiveness of a range of interventions requires statistical methodology beyond classical meta-analysis methods.
Network meta-analysis (NMA), also called multiple treatments meta-analysis or mixed treatment comparison, is an extension of the traditional pairwise meta-analysis that enables comparisons between multiple interventions simultaneously,6 respecting
the randomization in the evidence.7 In practice, direct evidence may not be available for
Clinical Epidemiology downloaded from https://www.dovepress.com/ by 118.70.13.36 on 20-Aug-2020
For personal use only.
Number of times this article has been viewed
This article was published in the following Dove Press journal: Clinical Epidemiology
hyster
5
1 1gen
11
2gen
3
Mirena
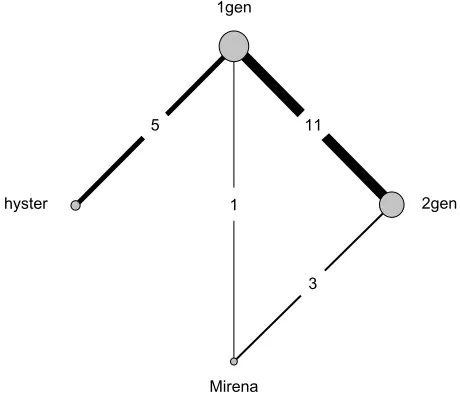
Figure 1 network configuration.
Note: Copyright © 2010. BMJ. Adapted from Middleton LJ, Champaneria R, Daniels JP, et al. hysterectomy, endometrial destruction, and levonorgestrel releasing intrauterine system (Mirena) for heavy menstrual bleeding: systematic review and meta-analysis of data from individual patients. 2010;341:c3929.28
Abbreviations: 1gen, first-generation hysteroscopic endometrial destruction technique; 2gen, second-generation nonhysteroscopic endometrial destruction technique; hyster, hysterectomy.
Dovepress Kibret et al
every pair of treatments. NMA enables researchers to obtain the relative efficacy of a particular intervention versus any compet-ing intervention even when direct evidence is not present, via a common comparator.8 NMA yields more precise estimates by
combining direct and indirect evidence versus direct evidence alone.4,6,7,9,10 In addition to relative effects, when conducted in
a Bayesian framework, NMA generates the probability that each treatment is ranked first, second, and so on.11,12 It has been
applied in clinical research areas such as diabetes,13
cardiovas-cular safety,14 cancer,15 anatomy,16–20 and drug development,21
and is gaining considerable favor among clinicians, guideline decision makers, and health technology agencies.22–24
Considerable research focused on methodological issues of NMA has been published in recent years; however, a limited number of simulation studies have been conducted. In particu-lar, few simulations have explored the operating characteristics of rank probabilities obtained from an NMA. Some concern has been raised about the use of rank probabilities in decision making. Researchers argue that rank probability is sensitive to various factors and it is biased when there is a paucity of direct comparisons. Because of this fragility, researchers claim that decisions based on rank probabilities should not be trusted unless accompanied with effect sizes of pairwise comparisons, such as means and their credible intervals, as in some cases individual treatments may be disqualified on the basis of cost or clinical contraindication.11,24–26 If there
are few trials per comparison, as in the study by Haas et al27
for neonatal mortality outcome, it may lead to the problem of overestimating rates, suggesting extra caution should be exercised when interpreting the treatment rankings. This study aims to investigate how rank probabilities obtained from a Bayesian NMA are affected by characteristics of the network, including network configuration, number of studies per com-parison, individual study sample sizes, and effect sizes. The simulation was conducted for a binary outcome.
Motivating example
A recently published article shared the results from pair-wise comparisons of four treatments in the reduction of heavy menstrual bleeding,28 including analysis of individual patient
data. The authors conducted a wide-range search for studies that compared hysterectomy (hyster), endometrial destruc-tion (both first-generadestruc-tion hysteroscopic [1gen] and second-generation nonhysteroscopic [2gen] techniques), and the levonorgestrel releasing intrauterine system (Mirena) from the Cochrane Library, MEDLINE, Embase, and CINAHL databases and reference lists. The authors found that the level of satisfaction with treatment was the most commonly measured outcome across all identified studies, with 21 out of
30 using this measure, and used it as their primary outcome measure. Direct and indirect comparisons among the four treatments were made without an NMA approach. The binary outcome data from 20 of these two-arm studies were avail-able, and the resulting network is shown in Figure 1.
The network plot reveals an unequal number of studies per comparison and the absence of direct evidence between some of the pairs of treatments (eg, hyster and Mirena). An NMA synthesizing all evidence simultaneously was not conducted and rank probabilities were not estimated.
Using the available raw data (from the identified studies), a Bayesian NMA was performed for the purpose of yield-ing probabilistic conclusions. It was possible to determine estimates for both relative effect sizes and rank probabilities through Markov chain Monte Carlo (MCMC) simulation sampling using an R package called gemtc. The pairwise estimates are available in Table 1. Based on this table, hysterectomy is the treatment yielding the greatest reduc-tion of patients’ dissatisfacreduc-tion regarding heavy menstrual bleeding, with the remaining three treatments relatively indistinguishable. These estimates are very similar to their findings despite the methods applied.
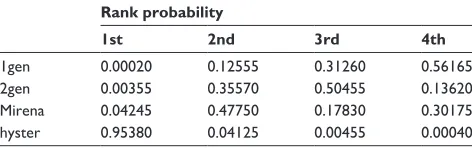
The rank probabilities of the four treatments are pro-vided in Table 2. This ranking supports the conclusion that hysterectomy is the most effective treatment. However, when working with real data, there is no way to know if any bias is present in the findings. This paper will consider what factors
Clinical Epidemiology downloaded from https://www.dovepress.com/ by 118.70.13.36 on 20-Aug-2020
Dovepress A Bayesian NMA simulation study
might influence these rank probabilities. The focus will be on the first rank probability (ie, the first column of Table 2). Using comprehensive simulations, possible sources of bias in networks similar to this one (eg, the effect of unequal studies per comparison) will be assessed.
The rest of this article is organized as follows. First, a brief description of the NMA method is provided. Next, the simulation approach is described, results are presented, and a discussion and limitations of the simulation are given. Finally, a conclusion is provided.
Methods
The NMA method relies on the fundamental assumptions of homogeneity, similarity, and consistency.29 Homogeneity
requires the effect of treatments to be similar across trials,30
similarity (or transitivity) requires that relative treatment effects are assumed to be exchangeable, and consistency (or coherence) requires that evidence from both direct and indirect comparisons is in agreement.4,29,31,32 Assumptions
can prove difficult to verify.33
In NMA, a network’s geometry uses nodes to represent inter-ventions and edges to represent the direct comparisons between
interventions. The amount of available information is often represented in network plots by varying the sizes of nodes and thickness of edges. The visual depiction of a network can reveal that some treatments are included in significantly more studies than others. This disparity may come from comparator prefer-ence bias, sponsorship bias, selective reporting bias, and time lag bias.4 Network geometries range from simple (a network with
only three treatments) to very complex (a network with multiple treatments).34 In this simulation study, graphical networks that
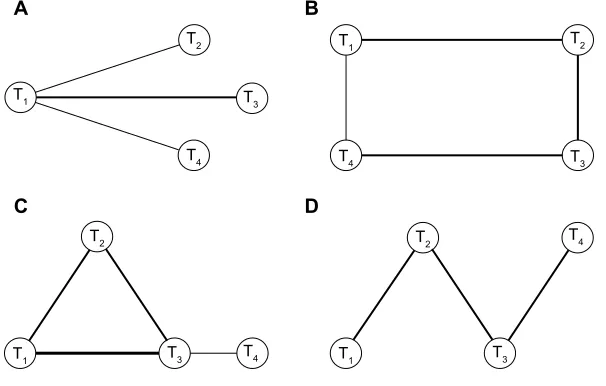
often result from systematic reviews were considered: star,35,36
loop, one closed loop,25,36,37 and ladder (linear)25,36,37 (Figure 2).
All of the four network patterns also exist together in the paper published by Lu and Ades.23 Each network comprises four nodes
representing four interventions (treatments one to four labeled T1, T2, T3, and T4). Except for the star pattern, each configuration has both direct and indirect evidence.
statistical details
In NMA, input data are summary statistics gathered from published literature. The aggregate input data might be available in two formats: arm-level summaries (eg, odds, absolute risk, hazard, mean) or contrast-level summaries (eg, odds ratio, risk ratio, hazard ratio, mean difference). Arm-level data, which is modeled with the exact likeli-hood rather than its normal approximation,6 were adopted
in this simulation study. Both frequentist and Bayesian frameworks can suitably fit models for either of the two data formats.38
Although inference based on NMA can be made in both frequentist and Bayesian frameworks, Bayesian NMA is more common and provides two advantages. First, it allows researchers to incorporate prior knowledge for parameters of interest and a rich and flexible family of models can be fitted. Second, treatment rank probabilities can be calculated easily. Employing a Bayesian framework requires the calculation of posterior distributions using MCMC methods. Procedures are described in detail by Salanti et al.11 Furthermore, Bayesian
inferences are exact for finite samples when appropriate priors are used (unlike frequentist inference, which relies on a normality assumption) and, hence, are more appealing, especially with small samples.
The calculation of rank probabilities is also straightfor-ward in the Bayesian framework. For every MCMC run, each treatment in the study is ranked based on the relative effect estimates. The proportion of MCMC cycles in which the treatment ranks first gives the probability that it is the best among all competing treatments in the study. Similarly, rank probabilities of being second best, third best, and so on are computed for every treatment.
Table 2 The treatment rank probabilities
Rank probability
1st 2nd 3rd 4th
1gen 0.00020 0.12555 0.31260 0.56165
2gen 0.00355 0.35570 0.50455 0.13620
Mirena 0.04245 0.47750 0.17830 0.30175
hyster 0.95380 0.04125 0.00455 0.00040
Note: Copyright © 2010. BMJ. Adapted from Middleton LJ, Champaneria R, Daniels JP, et al. hysterectomy, endometrial destruction, and levonorgestrel releasing intrauterine system (Mirena) for heavy menstrual bleeding: systematic review and meta-analysis of data from individual patients. 2010;341:c3929.28
Abbreviations: 1gen, first-generation hysteroscopic endometrial destruction technique; 2gen, second-generation nonhysteroscopic endometrial destruction technique; hyster, hysterectomy.
Table 1 Relative treatment effects of all possible comparisons
1gen 2gen Mirena hyster
1gen – 1.14
(0.78–1.61)
1.16 (0.54–2.50)
2.72* (1.51–5.05)
2gen 0.88
(0.62–1.28)
– 1.02
(0.50–2.09)
2.38 (1.23–4.95) Mirena 0.86
(0.40–1.84)
0.98 (0.48–2.01)
– 2.34
(0.89–6.17) hyster 0.37
(0.20–0.66)
0.42 (0.20–0.82)
0.43 (0.16–1.12)
–
Notes: *The figures in the table show estimated odds ratios along with 95% credible interval (CrI) for the treatment shown in the row relative to the treatment in the corresponding column. For example, we can see that more women were dissatisfied at 12 months after first generation endometrial destruction than after hysterectomy: odds ratio (95% CrI) 2.72 (1.51 to 5.05).
Abbreviations: 1gen, first-generation hysteroscopic endometrial destruction tech-nique; 2gen, second-generation nonhysteroscopic endometrial destruction techtech-nique; hyster, hysterectomy.
Clinical Epidemiology downloaded from https://www.dovepress.com/ by 118.70.13.36 on 20-Aug-2020
Dovepress Kibret et al
The general linear model for NMA has been proposed by several researchers.32,39 The model can be fitted for
dif-ferent types of data, including normal, binomial, Poisson, and multinomial. The following sections will review how the Bayesian NMA model can be fitted for arm-level study summaries of binary outcomes.
Fixed effects models in NMA
This section describes both fixed and random effects NMA models confined to binary outcomes. Suppose that there are N randomized controlled trials that compare K treatments. Let rik be the number of events of the ith clinical trial in the arm representing treatment k. Let nik represent the number of observations and pik denote the corresponding success probability for treatment k in study i. Then the distribution of the number of events is given by:
rik~Bin p n( ik, ik),i=1,…, ;N k=1 2, ,… K (1)
where pik represents the corresponding probability of a suc-cessful outcome for treatment k and is modeled on the logit scale as:
log (it ) log p , , , ; , ,
p i N b k K
ib
ib i pib =
- = = = =
1 µ 1 2… 1…
(2)
log (it p ) log p , log ( , )
p d p it d
ik ik
ik
i i k ik k
=
- = + ⇔ = +
-1 1
1
1 1 1
µ µ
(3)
with i =1, 2, …, N; k =2, …, k; b k where µi are the trial specific baselines representing the log odds of an event occur-ring in the referent treatment group (k = b). Then, di,1k are the
fixed trial-specific log odds of event occurrence in group k compared with the referent treatment. The logit link function maps the probabilities onto the real number line.
Random effects models in NMA
In a random effects model, each study i provides an esti-mate of the study-specific log odds, δi,1k which are assumed to be independent of the order in which they were carried out (exchangeable). Then, the random effects model is obtained by replacing di,1k in the above fixed effects model by δi,1k, ie,
log ( ) log ,
, , ; , , ; .
,
it p p
p
i N k k b k
ik
ik
ik
i i k
=
- = +
= = <
1
1 2 2
1
µ δ
… … (4)
It is typically assumed that δi bk, ~ (N dbk =d1k-d1b,σ )
2 .
The notation k b indicates that k is after b and d11=0. Prior distributions for basic parameters (d12, d13, d14, …) need to be assumed in the Bayesian framework while the remaining contrasts, called functional parameters, are defined in terms of those treatments compared with the baseline treatment directly assuming consistency. The functional parameters are written as:
d d d b K s K
t K s t
st= bt- bs = =
= <
, , , , ; , , , ;
, , , ; .
1 2 2 3
3 4
… …
… (5)
With regard to choice of priors for hyperparameters, it is common to set weakly informative priors that let the data speak, usually µi,dbk,β∼N( ,0 10 )
4 .4,32,39 For the likelihood of
binomial outcomes with logit link models, a uniform flat prior
A
C D
B
T1
T1
T1 T2
T2 T2
T2
T1
T3
T3
T3 T3
T4
T4
T4
T4
Figure 2 Type of network geometry considered in our simulation.
Notes: (A) Star geometry. (B) Loop geometry. (C) One closed loop geometry. (D) Ladder or linear geometry. T1 denotes a reference treatment and T2 to T4 are treatments
that are compared relative to the reference.
Clinical Epidemiology downloaded from https://www.dovepress.com/ by 118.70.13.36 on 20-Aug-2020
Dovepress A Bayesian NMA simulation study
for the standard deviation (ie, σ ∼Uniform ( , )0 5)40 is usually
used. A flat γ prior on the precision (ie, 1/σ2∼γ( .0 001 0 001, . ))
is another alternative. It assigns small weights to a large stan-dard deviation. This feature may be useful particularly when data are sparse to improve numerical stability and speed convergence of MCMC sampling.
The dramatic increase of interest in the Bayesian analysis is primarily because of the emergence of MCMC methods. While the MCMC method provides a convenient way to draw inference from complicated statistical models, there are some problems associated with this method. One of these problems is that convergence in MCMC sampler is a complex issue. It usually needs a large number of iterations to reach convergence. In addition, early MCMC iterations are highly sensitive to starting values of parameters and do not provide good information about the target distribution and, hence, are required to be thinned. The basic idea is that although the chains look divergent at early iterations due to different starting points, when the MCMC algorithm is converged, the chains should mix together and become indistinguishable from each other as they converge to the same posterior distribution. In this study, the package gemtc (http://cran.r-proct.org/web/packages/gemtc/index.html) from the R library, was used to implement the Bayesian NMA through MCMC simulation nicely, and is compat-ible with other packages that can conduct convergence diagnostics.
Simulation studies
In this section, the simulation design and results are provided. As outlined in the Background section, this simulation study addresses how an unequal number of studies per comparison affects the ranking of treatments and the influence of network configuration.
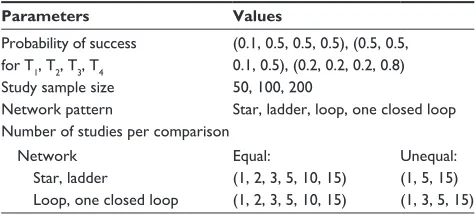
simulation design
In this study, four treatments were considered and two-arm level binary data were simulated. The treatments were denoted T1 (placebo), T2, T3, and T4. The parameters varied during simulation are given in Table 3. Three scenarios were considered. The first two scenarios used the success prob-ability conditions (0.1, 0.5, 0.5, 0.5) for (T1, T2, T3, T4). In both scenarios, three equivalent treatments were compared with a reference treatment, T1. The difference between the two scenarios was the position of the reference treat-ment within the network configuration, ie, T1 and T3 were interchanged. The third scenario with success probabilities (0.2, 0.2, 0.2, 0.8) for (T1, T2, T3, T4) compared a superior
treatment with the remaining equally inferior treatments. Under each of the three scenarios, four different network patterns, seven different numbers of studies per comparison, and three different study-level sample sizes were used to simulate arm-level data.
For the ladder and star geometries, the unequal number of studies (1, 5, 15) denoted the number of studies for the comparisons between treatments (T1 and T2, T2 and T3, T3 and T4) and (T1 and T2, T1 and T3, T1 and T4), respectively. Likewise, the unequal number of studies (1, 3, 5, 15) for loop and one closed loop geometries denoted the number of studies comparing the pairs of treatments (T1 and T2, T2 and T3, T3 and T4, T1 and T4), respectively. Lastly, for the completely connected loop geometry, the number of studies between (T1 and T2, T1 and T3, T1 and T4, T2 and T3, T2 and T4, T3 and T4) were set at (1, 2, 3, 5, 10, 15), respectively.
Using the parameters described above, binary data were generated from an appropriate binomial distribution. Then, the hierarchical Bayesian NMA model was fitted to perform statistical inference. In each MCMC simulation, the first 5,000 iterations were discarded as a burn-in to minimize the effect of initial values on the posterior distribution. Moreover, to minimize poor mixing (or slow convergence), chains were thinned by keeping every tenth simulated draw from each MCMC sequence. After burn-in and thinning, 2,000 iterations were used to estimate posterior distributions and make inferences about rank probabilities. For each simulation setting, this process was repeated 1,000 times. Convergence was assessed using the Brooks–Rubin diagnostic test where a potential scale reduction factor of 1.05 or lower was considered sufficient for convergence.41
The first rank probability estimates yielded from the MCMC process were averaged over the 1,000 simulations for each setting to create mean first rank probabilities. Two measures of performance, the bias for estimates of first rank probabilities and the standard deviation of the estimates over 1,000 samples, were calculated.
Table 3 Parameters varied during simulations
Parameters Values
Probability of success for T1, T2, T3, T4
(0.1, 0.5, 0.5, 0.5), (0.5, 0.5, 0.1, 0.5), (0.2, 0.2, 0.2, 0.8)
study sample size 50, 100, 200
network pattern star, ladder, loop, one closed loop Number of studies per comparison
network star, ladder
loop, one closed loop
Equal:
(1, 2, 3, 5, 10, 15) (1, 2, 3, 5, 10, 15)
Unequal: (1, 5, 15) (1, 3, 5, 15)
Clinical Epidemiology downloaded from https://www.dovepress.com/ by 118.70.13.36 on 20-Aug-2020
Dovepress Kibret et al
simulation results
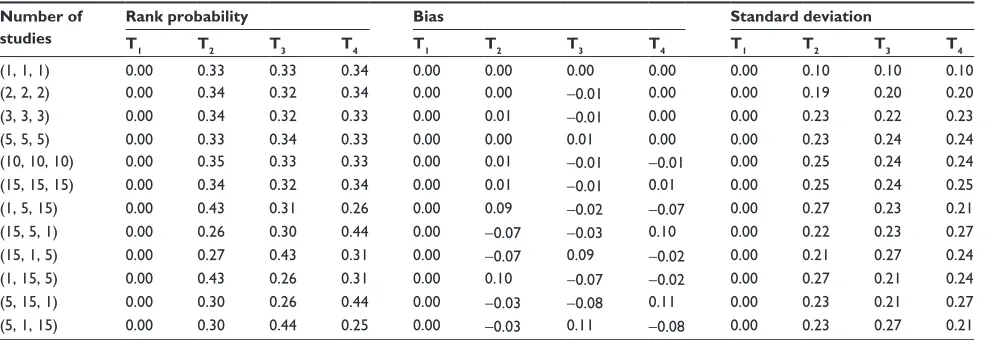
In this section, estimates of the mean, bias, and standard deviation of first rank probabilities for each simulation set-ting are given. For the first two sets of success probabilities, no difference between the average first rank probabilities of T2, T3, and T4 were expected. Table 4 shows results for a star geometry. For an equal number of studies per comparison, the star geometry identified treatments as expected with minimal bias. However, with an unequal number of studies per comparison, the star geometry showed large bias and large standard deviation.
The upward bias of the first rank probability corresponds to the treatment with the smallest number of studies in the network. All possible permutations of the unbalanced number of studies were checked and showed that the overestimation of the first rank probability always aligns with the treatment used in the fewest number of studies.
Table 5 shows results for the loop geometry. Here, T3 was consistently underestimated, albeit slightly, though it was expected to be equivalent in efficacy with T2 and T4.
In order to determine the impact of direct evidence, an additional simulation was conducted using a complete network. When direct evidence was available for all treat-ment comparisons, the model correctly estimated the ranks of treatments. These results are provided in Table 6.
The results from the one closed loop geometry are pro-vided in Table 7. As with the loop geometry, the rank prob-ability of T3 was underestimated while those of T2 and T4 were overestimated. The underestimation by the one closed loop configuration was more extreme than with the loop configuration. This appears to be related to the additional direct evidence in the one closed loop configuration; T3 was
compared with T1, T2, and T4 as opposed to only T2 and T4 in loop geometry.
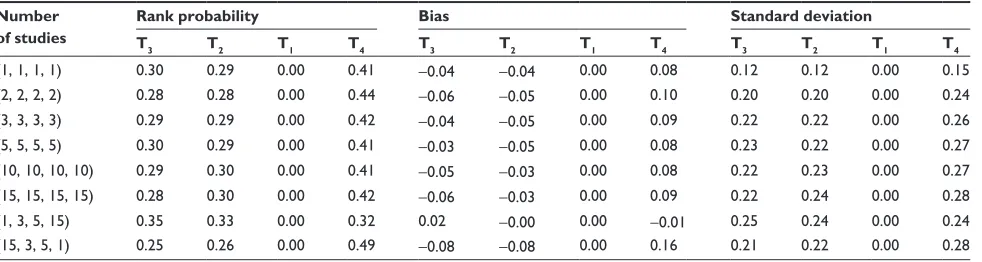
Table 8 displays the results of when the position of the reference treatment for the one closed loop network geometry was changed. This result shows that T4, the treatment that was compared only with the placebo, was favored as compared to the other two equivalent treatments, which were compared to one another.
Table 9 shows results for the ladder geometry. The first rank probability for T3 was underestimated as with the loop geometry, with even stronger bias.
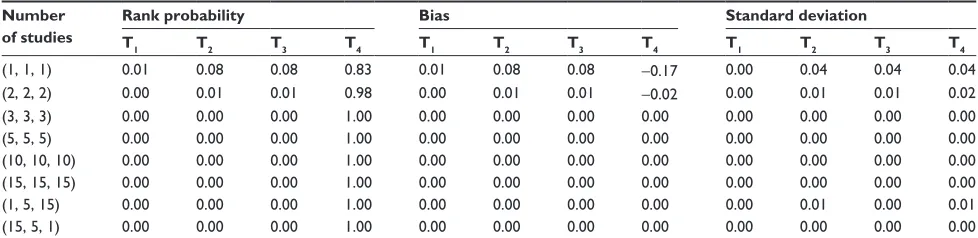
Table 10 shows results for the final scenario, when T4 is superior in efficacy compared to three equally less effective treatments. Here, as expected, T4 was identified by the model under each simulation setting as the most effective treatment with highest rank probability, regardless of the network geometry or placement of the superior treatment within it. The impact of the number of studies on the rank probability was negligible. In this scenario, bias and standard deviations were generally very small in all cases. The results were presented with a sample size of 50 for the star network pat-tern since the results were not markedly different for other network configurations or sample sizes, regardless of the position of the superior treatment.
Discussion
NMA offers a set of methods to model, visualize, analyze, and interpret a comprehensive picture of the evidence involving multiple treatments and to understand the relative merits of each intervention. In NMA, the Bayesian approach is becom-ing more popular than the frequentist approach. It provides a simple process for calculating the rank probabilities of
Table 4 Star network pattern with success probabilities (0.1, 0.5, 0.5, 0.5) and n=200
Number of studies
Rank probability Bias Standard deviation
T1 T2 T3 T4 T1 T2 T3 T4 T1 T2 T3 T4
(1, 1, 1) 0.00 0.33 0.33 0.34 0.00 0.00 0.00 0.00 0.00 0.10 0.10 0.10
(2, 2, 2) 0.00 0.34 0.32 0.34 0.00 0.00 -0.01 0.00 0.00 0.19 0.20 0.20
(3, 3, 3) 0.00 0.34 0.32 0.33 0.00 0.01 -0.01 0.00 0.00 0.23 0.22 0.23
(5, 5, 5) 0.00 0.33 0.34 0.33 0.00 0.00 0.01 0.00 0.00 0.23 0.24 0.24
(10, 10, 10) 0.00 0.35 0.33 0.33 0.00 0.01 -0.01 -0.01 0.00 0.25 0.24 0.24
(15, 15, 15) 0.00 0.34 0.32 0.34 0.00 0.01 -0.01 0.01 0.00 0.25 0.24 0.25
(1, 5, 15) 0.00 0.43 0.31 0.26 0.00 0.09 -0.02 -0.07 0.00 0.27 0.23 0.21
(15, 5, 1) 0.00 0.26 0.30 0.44 0.00 -0.07 -0.03 0.10 0.00 0.22 0.23 0.27
(15, 1, 5) 0.00 0.27 0.43 0.31 0.00 -0.07 0.09 -0.02 0.00 0.21 0.27 0.24
(1, 15, 5) 0.00 0.43 0.26 0.31 0.00 0.10 -0.07 -0.02 0.00 0.27 0.21 0.24
(5, 15, 1) 0.00 0.30 0.26 0.44 0.00 -0.03 -0.08 0.11 0.00 0.23 0.21 0.27
(5, 1, 15) 0.00 0.30 0.44 0.25 0.00 -0.03 0.11 -0.08 0.00 0.23 0.27 0.21
Note: T1 is reference treatment and T2 to T4 are treatments in comparison relative to this reference.
Clinical Epidemiology downloaded from https://www.dovepress.com/ by 118.70.13.36 on 20-Aug-2020
Dovepress A Bayesian NMA simulation study
Table 6 Loop (complete) network pattern with success probabilities (0.1, 0.5, 0.5, 0.5) and n=200
Number of studies Rank probability Bias Standard deviation
T1 T2 T3 T4 T1 T2 T3 T4 T1 T2 T3 T4
(1, 1, 1, 1, 1, 1) 0.00 0.33 0.33 0.34 0.00 0.00 0.00 0.00 0.00 0.19 0.19 0.19
(2, 2, 2, 2, 2, 2) 0.00 0.32 0.33 0.35 0.00 -0.01 0.00 0.01 0.00 0.23 0.23 0.23
(3, 3, 3, 3, 3, 3) 0.00 0.33 0.33 0.34 0.00 0.00 -0.01 0.00 0.00 0.23 0.23 0.24
(5, 5, 5, 5, 5, 5) 0.00 0.35 0.32 0.32 0.00 0.02 -0.01 -0.01 0.00 0.25 0.24 0.24
(10, 10, 10, 10, 10, 10) 0.00 0.32 0.33 0.35 0.00 -0.01 0.00 0.01 0.00 0.24 0.25 0.25
(15, 15, 15, 15, 15, 15) 0.00 0.34 0.33 0.33 0.00 0.01 -0.01 0.00 0.00 0.26 0.25 0.25
(1, 2, 3, 5, 10, 15) 0.00 0.37 0.33 0.29 0.00 0.04 0.00 -0.04 0.00 0.26 0.25 0.23
(15, 10, 5, 3, 2, 1) 0.00 0.29 0.34 0.38 0.00 -0.05 0.00 0.04 0.00 0.23 0.25 0.26
Note: T1 is reference treatment and T2 to T4 are treatments in comparison relative to this reference.
Table 7 One closed loop network pattern with success probabilities (0.1, 0.5, 0.5, 0.5) and n=200
Number of studies
Rank probability Bias Standard deviation
T1 T2 T3 T4 T1 T2 T3 T4 T1 T2 T3 T4
(1, 1, 1, 1) 0.00 0.36 0.24 0.39 0.00 0.03 -0.09 0.06 0.00 0.14 0.10 0.14
(2, 2, 2, 2) 0.00 0.35 0.26 0.38 0.00 0.02 -0.07 0.05 0.00 0.22 0.19 0.22
(3, 3, 3, 3) 0.00 0.35 0.26 0.39 0.00 0.02 -0.08 0.06 0.00 0.23 0.19 0.24
(5, 5, 5, 5) 0.00 0.37 0.25 0.37 0.00 0.04 -0.08 0.04 0.00 0.25 0.20 0.25
(10, 10, 10, 10) 0.00 0.36 0.25 0.39 0.00 0.03 -0.09 0.06 0.00 0.26 0.21 0.27
(15, 15, 15, 15) 0.00 0.36 0.24 0.40 0.00 0.03 -0.09 0.07 0.00 0.26 0.21 0.27
(1, 3, 5, 15) 0.00 0.42 0.25 0.33 0.00 0.08 -0.08 0.00 0.00 0.27 0.21 0.24
(15, 3, 5, 1) 0.00 0.31 0.25 0.44 0.00 -0.02 -0.08 0.11 0.00 0.23 0.20 0.26
Note: T1 is reference treatment and T2 to T4 are treatments in comparison relative to this reference.
Table 5 Loop network pattern with success probabilities (0.1, 0.5, 0.5, 0.5) and n=200
Number of studies
Rank probability Bias Standard deviation
T1 T2 T3 T4 T1 T2 T3 T4 T1 T2 T3 T4
(1, 1, 1, 1) 0.00 0.35 0.29 0.35 0.00 0.02 -0.04 0.02 0.00 0.13 0.12 0.13
(2, 2, 2, 2) 0.00 0.34 0.31 0.35 0.00 0.01 -0.03 0.02 0.00 0.22 0.20 0.21
(3, 3, 3, 3) 0.00 0.36 0.29 0.35 0.00 0.03 -0.05 0.02 0.00 0.24 0.21 0.24
(5, 5, 5, 5) 0.00 0.36 0.28 0.36 0.00 0.02 -0.05 0.03 0.00 0.25 0.22 0.25
(10, 10, 10, 10) 0.00 0.36 0.28 0.36 0.00 0.02 -0.06 0.03 0.00 0.27 0.23 0.26
(15, 15, 15, 15) 0.00 0.35 0.30 0.36 0.00 0.02 -0.04 0.02 0.00 0.25 0.23 0.25
(1, 3, 5, 15) 0.00 0.38 0.27 0.35 0.00 0.04 -0.06 0.02 0.00 0.25 0.21 0.25
(15, 3, 5, 1) 0.00 0.37 0.28 0.35 0.00 0.04 -0.05 0.02 0.00 0.25 0.21 0.24
Note: T1 is reference treatment and T2 to T4 are treatments in comparison relative to this reference.
Table 8 One closed loop network pattern with success probabilites (0.1, 0.5, 0.5, 0.5) and n=200
Number of studies
Rank probability Bias Standard deviation
T3 T2 T1 T4 T3 T2 T1 T4 T3 T2 T1 T4
(1, 1, 1, 1) 0.30 0.29 0.00 0.41 -0.04 -0.04 0.00 0.08 0.12 0.12 0.00 0.15
(2, 2, 2, 2) 0.28 0.28 0.00 0.44 -0.06 -0.05 0.00 0.10 0.20 0.20 0.00 0.24
(3, 3, 3, 3) 0.29 0.29 0.00 0.42 -0.04 -0.05 0.00 0.09 0.22 0.22 0.00 0.26
(5, 5, 5, 5) 0.30 0.29 0.00 0.41 -0.03 -0.05 0.00 0.08 0.23 0.22 0.00 0.27
(10, 10, 10, 10) 0.29 0.30 0.00 0.41 -0.05 -0.03 0.00 0.08 0.22 0.23 0.00 0.27
(15, 15, 15, 15) 0.28 0.30 0.00 0.42 -0.06 -0.03 0.00 0.09 0.22 0.24 0.00 0.28
(1, 3, 5, 15) 0.35 0.33 0.00 0.32 0.02 -0.00 0.00 -0.01 0.25 0.24 0.00 0.24
(15, 3, 5, 1) 0.25 0.26 0.00 0.49 -0.08 -0.08 0.00 0.16 0.21 0.22 0.00 0.28
Note: T1 is reference treatment and T2 to T4 are treatments in comparison relative to this reference.
Clinical Epidemiology downloaded from https://www.dovepress.com/ by 118.70.13.36 on 20-Aug-2020
Dovepress Kibret et al
interventions, incorporates prior knowledge, and fits more flexible models.
The primary purpose of this article was to examine the effect of various factors on rank probabilities of treat-ments in NMA through simulation. For the treattreat-ments compared in loop, one closed loop, and ladder network structures with an equal number of studies per comparison, the model-estimated rank probabilities exhibited bias. The model favored the treatment that was directly compared with the fewest number of treatments in the network patterns. The rank probability of the treatment that was compared with the largest number of treatments was always underestimated.
The simulations also showed that when two equally effective treatments in the same network are included in the same number of direct comparisons, the effectiveness of the treatments to which they are compared will affect the rankings. Treatments that are compared directly with inferior treatments yield ranks that are overestimated, while treatments that are exclusively compared with equal or superior treatments yield ranks that are underestimated. When there is an unequal number of studies per comparison for a given network structure, the model overestimated the rank probability of the treatment associated with smaller number of studies. The first rank probability’s
overestimation when it is the least-studied treatment is an artifact of a larger estimated variance for that treatment. The rank probabilities obtained from Bayesian NMA for loop, one closed loop, and ladder geometry can be reliable only when there is direct evidence for every treatment involved in the analysis or when there is an obvious superiority in efficacy. In other words, rank estimates for treatments that have never been directly compared should not be trusted. The position of the reference treatment in the network may affect conclusions from rank probabilities. Increasing the sample size of individual studies did not help to adjust the over/underestimation of the rank probabilities. These find-ings validate the concerns of Mills et al24 about using rank
probabilities for decision making.
There are some limitations of this simulation that must be noted. Although the Bayesian NMA model can be used broadly, only a binary outcome was considered in this simulation study. This study was also confined to only two-arm studies. In practice, multi-arm studies in NMA are often encountered where correlation is induced among contrasts that involve a common comparator and must be modeled.38,42 Furthermore, this study only focused on the
rank probabilities that each treatment is best, but the authors might be interested in investigating all of the ranks of avail-able treatments.
Table 9 Ladder network pattern success probabilities (0.1, 0.5, 0.5, 0.5) and n=200
Number of studies
Rank probability Bias Standard deviation
T1 T2 T3 T4 T1 T2 T3 T4 T1 T2 T3 T4
(1, 1, 1) 0.02 0.36 0.24 0.37 0.02 0.03 -0.09 0.04 0.00 0.09 0.07 0.09
(2, 2, 2) 0.00 0.37 0.25 0.38 0.00 0.04 -0.09 0.05 0.00 0.20 0.16 0.20
(3, 3, 3) 0.00 0.38 0.25 0.38 0.00 0.04 -0.09 0.05 0.00 0.23 0.18 0.23
(5, 5, 5) 0.00 0.37 0.25 0.38 0.00 0.04 -0.08 0.04 0.00 0.24 0.20 0.24
(10, 10, 10) 0.00 0.39 0.24 0.37 0.00 0.05 -0.09 0.04 0.00 0.26 0.21 0.26
(15, 15, 15) 0.00 0.37 0.25 0.38 0.00 0.04 -0.09 0.05 0.00 0.26 0.21 0.26
(1, 5, 15) 0.00 0.41 0.25 0.34 0.00 0.08 -0.08 0.00 0.00 0.26 0.21 0.25
(15, 5, 1) 0.00 0.32 0.25 0.43 0.00 -0.01 -0.09 0.09 0.00 0.22 0.19 0.25
Note: T1 is reference treatment and T2 to T4 are treatments in comparison relative to this reference.
Table 10 Star network pattern success probabilities (0.2, 0.2, 0.2, 0.8) and n=200
Number of studies
Rank probability Bias Standard deviation
T1 T2 T3 T4 T1 T2 T3 T4 T1 T2 T3 T4
(1, 1, 1) 0.01 0.08 0.08 0.83 0.01 0.08 0.08 -0.17 0.00 0.04 0.04 0.04
(2, 2, 2) 0.00 0.01 0.01 0.98 0.00 0.01 0.01 -0.02 0.00 0.01 0.01 0.02
(3, 3, 3) 0.00 0.00 0.00 1.00 0.00 0.00 0.00 0.00 0.00 0.00 0.00 0.00
(5, 5, 5) 0.00 0.00 0.00 1.00 0.00 0.00 0.00 0.00 0.00 0.00 0.00 0.00
(10, 10, 10) 0.00 0.00 0.00 1.00 0.00 0.00 0.00 0.00 0.00 0.00 0.00 0.00
(15, 15, 15) 0.00 0.00 0.00 1.00 0.00 0.00 0.00 0.00 0.00 0.00 0.00 0.00
(1, 5, 15) 0.00 0.00 0.00 1.00 0.00 0.00 0.00 0.00 0.00 0.01 0.00 0.01
(15, 5, 1) 0.00 0.00 0.00 1.00 0.00 0.00 0.00 0.00 0.00 0.00 0.00 0.00
Clinical Epidemiology downloaded from https://www.dovepress.com/ by 118.70.13.36 on 20-Aug-2020
Dovepress A Bayesian NMA simulation study
Conclusion
This simulation study revealed several occasions of bias of rank probabilities obtained from a Bayesian NMA. For example, for an unequal number of studies per comparison, the rank probability of the treatment with more studies was underestimated. In addition, the rank probability of the treat-ment that was directly compared with the placebo and an equivalent treatment simultaneously (eg, T2 and T4 in loop, ladder, and one closed loop geometries) gained spurious rank probabilities, whereas the rank probability of a treatment that was compared with two equivalent treatments (eg, T3 in loop, ladder, and one closed loop) was underestimated. In summary, decisions should not be made based on rank probabilities espe-cially when treatments are not directly compared (ie, ladder, one closed loop, star) as they may be ill-informed.
Acknowledgments
JB would like to acknowledge Discovery Grant funding from the Natural Sciences and Engineering Research Council of Canada (NSERC) (grant number 293295-2009) and Canadian Institutes of Health Research (CIHR) (grant number 84392). JB holds the John D. Cameron Endowed Chair in the Genetic Determinants of Chronic Diseases, Department of Clinical Epidemiology and Biostatistics, McMaster University.
Disclosure
The authors report no conflicts of interest in this work.
References
1. Hanka R. The handbook of research synthesis [review]. BMJ. 1994;309: 488–489.
2. Borenstein M, Hedges LV, Higgins JPT, Rothstein HR. A basic introduction to fixed-effect and random-effects models for meta-analysis. Res Synth Methods. 2010;1(2):97–111.
3. Song F, Loke YK, Walsh T, Glenny AM, Eastwood AJ, Altman DG. Methodological problems in the use of indirect comparisons for evaluating healthcare interventions: survey of published systematic reviews. BMJ. 2009;338:b1147.
4. Salanti G, Kavvoura FK, Ioannidis JP. Exploring the geometry of treatment networks. Ann Intern Med. 2008;148(7):544–553.
5. Jansen JP, Fleurence R, Devine B, et al. Interpreting indirect treatment comparisons and network meta-analysis for health care decision making: report of the ISPOR task force on indirect treatment comparisons good research practices: part 1. Value Health. 2011;14(4):417–428. 6. Hoaglin DC, Hawkins N, Jansen JP, et al. Conducting indirect treatment
comparison and network meta-analysis studies: report of the ISPOR task force on indirect treatment comparisons good research practices: part 2. Value Health. 2011;14(4):429–437.
7. Bucher HC, Guyatt GH, Griffith LE, Walter SD. The results of direct and indirect treatment comparisons in meta-analysis of randomized controlled trials. J Clin Epidemiol. 1997;50(6):683–691.
8. Lumley T. Network meta-analysis for indirect treatment comparisons. Stat Med. 2002;21(16):2313–2324.
9. Psaty BM, Lumley T, Furberg CD, et al. Health outcomes associated with various antihypertensive therapies used as first-line agents: a network meta-analysis. JAMA. 2003;289(19):2534–2544.
10. Wells GA, Sultan SA, Chen L, Khan M, Coyle D. Indirect Evidence: Indirect Treatment Comparisons in Meta-Analysis. Ottawa: Canadian Agency for Drugs and Technologies in Health; 2009. Available from: http://www.cadth.ca/media/pdf/H0462_itc_tr_e.pdf. Accessed September 15, 2014.
11. Salanti G, Ades AE, Ioannidis JP. Graphical methods and numerical summaries for presenting results from multiple-treatment meta-analysis: an overview and tutorial. J Clin Epidemiol. 2011;64(2):163–171. 12. Jonas DE, Wilkins TM, Bangdiwala S, et al. Findings of Bayesian Mixed
Treatment Comparison Meta-Analyses: Comparison and Exploration Using Real-World Trial Data and Simulation. Rockville, MD: Agency for Healthcare Research and Quality; 2013.
13. Elliott WJ, Meyer PM. Incident diabetes in clinical trials of antihypertensive drugs: a network meta-analysis. Lancet. 2007; 369(9557):201–207.
14. Trelle S, Reichenbach S, Wandel S, et al. Cardiovascular safety of non-steroidal anti- inflammatory drugs: network meta-analysis. BMJ. 2011;342:c7086.
15. Bangalore S, Kumar S, Kjeldsen SE, et al. Antihypertensive drugs and risk of cancer: network meta-analyses and trial sequential analyses of 324 168 participants from randomised trials. Lancet Oncol. 2011;12(1): 65–82.
16. Mclntosh A, Gonzalez-Lima F. Structural equation modeling and its application to network analysis in functional brain imaging. Hum Brain Mapp. 1994;2(1–2):2–22.
17. Fornito A, Yucel M, Patti J, Wood SJ, Pantelis C. Mapping grey matter reductions in schizophrenia: an anatomical likelihood estimation analy-sis of voxel-based morphometry studies. Schizophr Res. 2009;108(1–3): 104–113.
18. Ellison-Wright I, Glahn D, Laird AR, Thelen SM, Bullmore E. The anatomy of first-episode and chronic schizophrenia: an anatomical likelihood estimation meta-analysis. Am J Psychiatry. 2008;165(8): 1015–1023.
19. Lam SK, Owen A. Combined resynchronisation and implantable defibrillator therapy in left ventricular dysfunction: Bayesian net-work meta-analysis of randomised controlled trials. BMJ. 2007; 335(7626):925.
20. Hutton B, Joseph L, Fergusson D, Mazer CD, Shapiro S, Tinmouth A. Risks of harms using antifibrinolytics in cardiac surgery: systematic review and network meta-analysis of randomised and observational studies. BMJ. 2012;345:e5798.
21. Jones B, Roger J, Lane PW, et al. Statistical approaches for conducting network meta-analysis in drug development. Pharm Stat. 2011;10(6): 523–531.
22. Caldwell DM, Ades AE, Higgins JP. Simultaneous comparison of multiple treatments: combining direct and indirect evidence. BMJ. 2005;331(7521):897–900.
23. Li T, Vedula SS, Scherer R, Dickersin K. What comparative effectiveness research is needed? A framework for using guidelines and systematic reviews to identify evidence gaps and research priorities. Ann Intern Med. 2012;156(5):367–377.
24. Mills EJ, Thorlund K, Ioannidis JP. Demystifying trial networks and network meta-analysis. BMJ. 2013;346:f2914.
25. Mills EJ, Ioannidis JP, Thorlund K, Schunemann HJ, Puhan MA, Guyatt GH. How to use an article reporting a multiple treatment comparison meta-analysis. JAMA. 2012;308(12):1246–1253.
26. Hawkins N, Scott DA, Woods BS, Thatcher N. No study left behind: a network meta-analysis in non-small-cell lung cancer demonstrating the importance of considering all relevant data. Value Health. 2009; 12(6):996–1003.
27. Haas DM, Caldwell DM, Kirkpatrick P, McIntosh JJ, Welton NJ. Tocolytic therapy for preterm delivery: systematic review and network meta-analysis. BMJ. 2012;345:e6226.
28. Middleton LJ, Champaneria R, Daniels JP, et al. Hysterectomy, endometrial destruction, and levonorgestrel releasing intrauterine system (Mirena) for heavy menstrual bleeding: systematic review and meta-analysis of data from individual patients. BMJ. 2010;341:c3929.
Clinical Epidemiology downloaded from https://www.dovepress.com/ by 118.70.13.36 on 20-Aug-2020
Clinical Epidemiology
Publish your work in this journal
Submit your manuscript here: http://www.dovepress.com/clinical-epidemiology-journal Clinical Epidemiology is an international, peer-reviewed, open access, online journal focusing on disease and drug epidemiology, identifica-tion of risk factors and screening procedures to develop optimal pre-ventative initiatives and programs. Specific topics include: diagnosis, prognosis, treatment, screening, prevention, risk factor modification,
systematic reviews, risk & safety of medical interventions, epidemiol-ogy & biostatistical methods, and evaluation of guidelines, translational medicine, health policies & economic evaluations. The manuscript management system is completely online and includes a very quick and fair peer-review system, which is all easy to use.
Dovepress
Dove
press
Kibret et al
29. Cipriani A, Higgins JP, Geddes JR, Salanti G. Conceptual and technical challenges in network meta-analysis. Ann Intern Med. 2013;159(2): 130–137.
30. Donegan S, Williamson P, D’Alessandro U, Tudur Smith C. Assessing key assumptions of network meta-analysis: a review of methods. Res Synth Methods. 2013;4(4):291–323.
31. Dias S, Welton NJ, Caldwell DM, Ades AE. Checking consistency in mixed treatment comparison meta-analysis. Stat Med. 2010;29(7–8): 932–944.
32. Lu G, Ades AE. Assessing evidence inconsistency in mixed treatment comparisons. J Am Stat Assoc. 2006;101(474):447–459.
33. Ioannidis JP. Indirect comparisons: the mesh and mess of clinical trials. Lancet. 2006;368(9546):1470–1472.
34. Cipriani A, Barbui C, Salanti G, et al. Comparative efficacy and acceptability of antimanic drugs in acute mania: a multiple-treatments meta-analysis. Lancet. 2011;378(9799):1306–1315.
35. Trikalinos TA, Alsheikh-Ali AA, Tatsioni A, Nallamothu BK, Kent DM. Percutaneous coronary interventions for non-acute coronary artery disease: a quantitative 20-year synopsis and a network meta-analysis. Lancet. 2009;373(9667):911–918.
36. Greco T, Landoni G, Biondi-Zoccai G, D’Ascenzo F, Zangrillo A. A Bayesian network meta-analysis for binary outcome: how to do it. Stat Methods Med Res. Epub October 28, 2013.
37. Salanti G, Higgins JP, Ades AE, Ioannidis JP. Evaluation of networks of randomized trials. Stat Methods Med Res. 2008;17(3):279–301. 38. Franchini AJ, Dias S, Ades AE, Jansen J, Welton NJ. Accounting for
correlation in network meta-analysis with multi-arm trials. Res Synth Methods. 2012;3(2):142–160.
39. Lu G, Ades AE. Combination of direct and indirect evidence in mixed treatment comparisons. Stat Med. 2004;23(20):3105–3124.
40. Stettler C, Wandel S, Allemann S, et al. Outcomes associated with drug-eluting and bare-metal stents: a collaborative network meta-analysis. Lancet. 2007;370(9591):937–948.
41. Brooks SP, Gelman A. General methods for monitoring convergence of iterative simulations. J Comput Graph Stat. 1998;7(4):434–455. 42. Higgins JP, Whitehead A. Borrowing strength from external trials in a
meta-analysis. Stat Med. 1996;15(24):2733–2749.
Clinical Epidemiology downloaded from https://www.dovepress.com/ by 118.70.13.36 on 20-Aug-2020