Fuzzy Logic Energy Based Efficient Protocol in Wireless Sensor
Networks
S. Zindhu
Department Of Computer Science, Periyar University St. Joseph’s College of Arts and Science for Women, HOSUR – 635 126
Tamilnadu, India [email protected]
Abstract
Wireless Sensor Networks (WSNs) have been greatly developed in micro electro mechanical system (MEMS). WSN is used to study and monitor the environments towards climates changes. In environmental monitoring, sensors are randomly deployed over the interest area to periodically sense the physical environments for a few months or even a year. Therefore, to protract the network lifetime with limited battery capacity becomes a challenging issue. Low energy adaptive cluster hierarchical (LEACH) is the common clustering protocol. The aim of the protocol is to reduce the energy consumption by rotating the heavy workload cluster heads (CHs). The CHs election in LEACH is based on the probability model which will lead to inefficient in energy consumption. Due to the least desired CHs location in the network. In WSNs, the CHs location can directly influence the network energy consumption and further affect the network lifetime. A factor which will affect the network lifetime will be presented and the demonstration of fuzzy logic based CH selection conducted in base station (BS) will be carried out. To select suitable CHs that will protract the network first node dies (FND) round and consistent throughput to the BS, energy level and distance to the BS are selected an fuzzy inputs.
Keywords: Wireless Sensor Network, Cluster Head, Fuzzy Logic, First Node Dies
1. Introduction
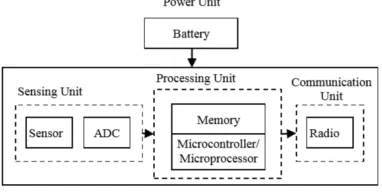
Wireless sensor network is one of the new technologies that will really change the world. Thousand of sensor nodes can form a huge intelligent WSN. Each sensor node is equipped with power unit, sensing unit, communication unit and processing unit as shown in the following figure. The sensor node is get powered by the power unit. It may consist of a small battery. It can sense elements such as temperature, light intensity and water level from this environment by using preloaded sensor unit. The analog signal given by the sensor unit will be converted into digital signal that is recognizable by the microcontroller unit based on the analog to digital converter module (ADC). Sensed data can be transmitted to base station through the communication unit. Wireless sensor node has
the ability to correspond among its peers rather than just directly communicate with base station.
Therefore, there are tons of possible communication methods to be considered in reducing the energy consumption, while maintaining the successive information delivered to the end user.
Fig. 1 Sensor Node Structure
and the centrality of sensor nodes. Fuzzy logic will be selecting the suitable CHs with other related sensor nodes.
In the routing protocols prolong the FND round and consistent throughput to the base station in every round. Further it does not need to know the location of the sensor nodes. Fuzzy Logic control is used to manipulate the linguistic rules into mathematical form. FL can perform fast and execute the real time decision with simplicity of the algorithm.
2. Cluster Model
One of the cluster based hierarchical routing protocol is related with LEACH protocol. It includes the fundamental theory of LEACH, the framework of the cluster formation and the disadvantages suffered by the LEACH protocol.
2.1 Cluster Based Hierarchical Routing Protocol
Each sensor node has transmitted their sensed data to the base station. Lifetime of the sensor node is shorter. It can reduce the energy consumption by only allowing the selected CH to transmit the aggregated data to the BS. First CH aggregated the collected data. Then the collected data transmit from the cluster member to reduce the long range transmission count. Further reduce the energy consumption, the network will be split into few clusters then to reduce cluster size and then reduce the energy consumption by the cluster members.
LEACH is one of the clustering protocols that can distribute the energy concentration in the same sensor node by rotating the CH. It will operate like rounds. Each round consist of two phases, ies set-up phase and steady phase. Set-up phase includes advertisement phase and steady phase includes schedule creation and data transmission. During each round the node is independently generates a random number between 0 and 1.
If the generated number is less than the threshold value T(n) which is defined by Eq. (1).
(1)
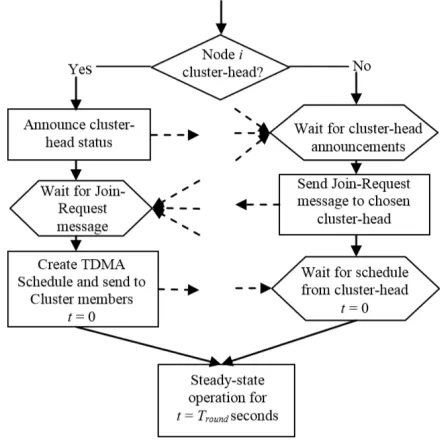
In this equation the r is the round which already ended, p is the proportion of the nodes to the CH and G is a set of nodes which have never been CH in the last 1/p rounds. Then the node will be elected as CH for the current round. Fig. 2 shows the flowchart of the LEACH protocol. This
protocol will be used after cluster head selection procedure. In fig.1, if the sensor node is elected to be a CH, it will broadcast a message to its surroundings to inform the other sensor nodes as it had been elected as CH. Non-CH sensor node , it may receive a few message from different CHs. It will decide to join the nearest CH based RSS. After some time, CH will again broadcast with time division medium access (TDMA) to its cluster. The cluster members will transmit their sensed data to the CH according to the predefined time slot shown in TDMA.
Fig. 2 Flowchart of the LEACH Protocol
Although the nature of LEACH protocol can distribute the heavy workload by rotating the CH, but the protocol faces some of the disadvantages are:
• Elected CH may locate near to each other.
• Number of elected CH is not consistent in each round.
• During each round, BS will receive more or no data.
• The elected CH may placed at the edge of the network.
The elected CH in LEACH protocol is based on probability model. The network overview to select suitable CH based on the critical parameters can improve the network lifetime.
2.2 Cluster Head Selection Using Fuzzy Logic Control
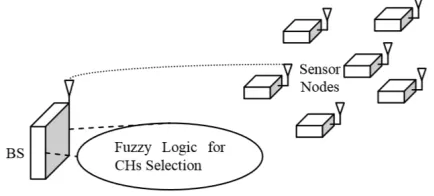
supply. The following Figure shows the centralized cluster selection model. Base station is loaded with the fuzzy logic control to compute desirable CH candidates. FL considering three fuzzy parameters which are energy, concentration and centrality. So, the network lifetime can be improved. Energy level is available in each node, concentration is the number of neighbor nodes and centrality is a value based on how close the nodes to the cluster.
Fuzzy inputs are used in this project. They are:
• Sensor Node Energy
• Distance to Base Station.
Sensor Node Energy means remaining energy level in the sensor node. Distance to the BS means the separate distance between the sensor node to the BS. Sensor node cans self measure the remaining energy via the ADC module in the microcontroller. The distance information can be obtained based on the received signal strength(RSS). And it can be measured based on how RSS is made.
Fig. 3 Centralized Cluster Selection Model.
Inputs of fuzzy inference system (FIS) are the energy and the distance of a particular node to the base station. Based on the rule base, FIS will compute and decide the output. Which is the fitness of the node to become a CH. BS will select p x total number of nodes to become CHs based on their fitness. Sensor nodes will be listed in a table from highest to lowest according to their fitness. The table restores every single round to keep the information up-to-date. So, the selected CH should be the best leader in every round.
3. System Model
Basic linear topology model had been constructed as shown in the fig. 4. BS represents the base station whereas node A, B and C are the sensor nodes. The distance
between node A and BS is set as 7R whereas node B and C are 6R and 5R away from the base station.
Fig. 4 Basic Linear Model.
In the wireless network model, some assumptions are used in the system as shown in.
• Each sensor nodes have enough power to
transmit from sensed data to reach the BS.
• Wide transmission range of BS is capable of using only single broadcasts to reach all the sensor nodes.
• Distance between sensor node and the base
station can be measured by RSS.
• Sensor nodes are homogenous, with the similar nodes model and same energy resources.
3.1 Radio Energy Model
In this model, the figure 3 shows the block diagram of transmitter and receiver in the radio energy model are used. The purpose of the radio model is to model the real communication activities in terms of energy consumption for sensor nodes. Based on the model, the figure 5 shows energy will be consumed during data transmission operation and the consumption is larger than data reception operation. The equation used to represent energy energy consumption during the transmission and reception for k bits message in the distance d between transmitter and receive node is given by Eq. 2. Where ETx-elec is energy model of transmit electronic and ETx-amp is energy model of transmit amplifier.
ETx(k,d) = ETx-elec(k)+ETx-amp(k,d)
(2)
The separate distance, d0 is the threshold for swapping amplification model, which can be calculated as
In this module, to receive k-bit message, Eq. (2) is expended as in the Eq. (3).
ERx(k) = Eelec(k) (3)
3.2 Cluster Heads Selection Based On Distance
In wireless communication, distance is one of the factors that affect the energy consumption as shown in Eq.2. Distance d refers to the relative distance among the CH, member nodes and the BS. Based on the modified linear topology as shown in the fig. 4.
Distance d1, d2 and d3 in Eq. 4 represent the total transmit by each sensor nodes.
ETotal = 2n(Eelec k) + n(Eeleck + ɛampk(d1)2) + n(Eeleck + ɛampk(d2)2
) + n(Eeleck + ɛampk(d3)2
)
ETotal = 5n(Eelec k) +(Eeleck) + nd12 + nd22 + nd32 +(ɛampk)
(4)
In that cases of n equals to 1 and n represents the number of sensor nodes, if node C becomes the CH, the overall energy consumed is less than node B and node A being selected as CH. Due to the fact that the node C is located nearer to the BS and compared to the larger distance to BS of the other nodes. Therefore the CH node is nearest the BS. Because the energy is consumption is lesser.
It can be proved the following cases where ETotal can be calculated based on Eq. (4).
Case 1: If A becomes CH, total energy consumption with n numbers of sensor nodes in B and in C.
ETotal = (5n + 1)(Eelec k) + (5nR2 +49R2 )(ɛampk)
Case 2: If B becomes CH, total energy consumption with n numbers of sensor nodes in A and in C.
ETotal = (5n + 1)(Eelec k) + (2nR2 +36R2 ) (ɛampk)
Case 3: If C becomes CH, total energy consumption with n numbers of sensor nodes in A and in B.
ETotal = (5n + 1)(Eelec k) + (5nR2 +25R2 )(ɛampk)
To refers Case2 if node B becomes CH and n= 5, the overall energy consumption is less than Case 3, followed by Case 1. From the all cases, it can be observed that node B is more suitable to become CH compared to the node C. The n number of nodes from A and B spend more energy to transmit to node C. By selecting CH in the middle of linear topology will produce less energy consumption per rounds. According to the equations, CH B will show less energy consumption per rounds compared to CH A and C, but the tradeoff is FND occurs faster.
3.3 Fuzzy Logic Based Cluster Heads Selection
Using Fuzzy Logic to consider both factors will improve the CH selection process. The optimum output can be obtained based on the fuzzy rule base system. Fuzzy inference technique is used. Due to its simple structure. In Mamdani method, there are four important steps are:
• Fuzzification : It transform the system inputs which are crisp values into fuzzy sets.
• Rule Evaluation : It refers to the fuzzified inputs and evaluate them to the antecedents of the fuzzy sets.
• Aggregate conclusion : The process of unification of the outputs of all rules.
• Defuzzication : It transform the fuzzy set obtained by the inference engine into a single crisp value.
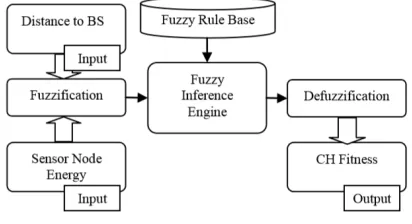
Fuzzy logic control diagram as shown in the fig. 5.
Fig. 5 Block Diagram of the Fuzzy Logic Control
through fuzzification process. Fuzzy inference engine will manipulate the inputs from fuzzification based on the rules that set in the fuzzy rule based.
Finally in the defuzzification module, the fuzzy set obtained from the inference engine needs to be transformed to the single crisp value. The common centre of area COA is used to calculate the crisp value using the following Eq.5.
Fitness = ( ʃ x. µA(x)dx / ʃxdx) (5)
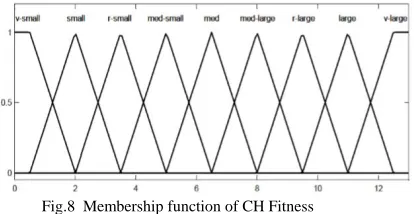
where µA(x) refers to the membership function of the fuzzy sets. Membership function of node’s energy and membership function of node’s distance are set for the simulation study. The linguistic variables used to represent the node distance are far, middle and near, as shown in the figure. 6. The linguistic variables used to represent the node’s energy are divided into three levels: high, medium and low as shown in figure .7. The output representing the CH selection chances is named as fitness and it is divided into 9 levels: very small, small, rather small, medium small, medium, medium large, rather large, large and very large as shown in the figure. 8.
The table.1 shows the fuzzy rule base that consist of 9 rules.
Fig. 6 Membership function of Node Distance
Fig. 7 Membership function of Node Energy
Fig.8 Membership function of CH Fitness
Referring to the distance’s rule, ‘middle’ is set to higher priority than near because the CH in the ‘middle’ zone will perform better than the ‘near’ zone which has been explained. Example of rule can be expressed as if the remaining energy is ‘low’ and the separate distance is ‘far’ then the fitness to be selected as CH will be ‘very small’. If the remaining energy is ‘high’ and the separate distance is ‘middle’, the fitness is considered ‘very large’.
In fuzzy logic based CH selection algorithm, BS loaded with fuzzy logic control will calculate the fitness for each node to become CH. The BS will select total number of CHs according to p X total number of nodes and p is the CH probability. The data transmission phase is similar to the LEACH steady state phase.
S.
No Energy Distance
Fitness
1 Low Far Very Small
2 Low Near Small
3 Low Middle Rather Small
4 Medium Far Medium Small
5 Medium Near Medium
6 Medium Middle Medium Large
7 High Far Rather Large
8 High Near Large
9 High Middle Very Large
4. Results and Discussions
The main difference between the LEACH and proposed protocol is the need of extra sensor node parameters as inputs into fuzzy logic in order to select suitable CH. Therefore an additional 24 bits of remaining energy and distance information are added to the data transmitted from member nodes to the CH. A total of 480 bits is added to the data transmitted from Ch to the BS as extra information for each cluster members.
5. Conclusions
In conclusion, the proposed method with global knowledge of the networks achieved its objective to prolong the first node dies (FND) round and has also improved the throughput to the BS before FND. By increasing the number of CH from5% to 7% will increase the data received at BS while only slightly decrease in FND round. The proposed method that consider remaining energy and separate distance can be improved by adopting some intelligent algorithm to modify the shape of each fuzzy set to search for more optimum values.
Acknowledgments
I would like to thank almighty God for his support throughout my life. I also thank my friends and family members who provide the full support.
References
[1] G. Pottie and W. Kaiser, “Wireless integrated sensor networks (WINS)”, Communications of the ACM, Vol. 43, No. 5, pp. 51-58, 2000.
[2] J. Zheng, and A. Jamalipour, “Wireless Sensor Networks A Networking Perspective”, Wiley-IEEE Press, pp. 87-89, 2009.
[3] W.R. Heinzelman, A. Chandrakasan and H. Balakrishnan, “Energy-efficient communication protocol for wireless microsensor networks”, Proceedings of the 33rd Annual Hawaii International Conference on System Sciences, pp. 3005-3014, 2000.
[4] Technology Review, “10 Emerging technologies that will change the world”, Technology Review, Vol. 106, No. 1, pp.33-49, 2003.
[5] I. Mahgoub and M. Ilyas, “Sensor Network Protocols”, CRC Press, pp. 3–11 - 3–13, 2006.
Author’s Biography