Copyright1999 by the Genetics Society of America
Spatial and Temporal Distribution of the Neutral Polymorphisms in the Last
ZFX Intron: Analysis of the Haplotype Structure and Genealogy
Jadwiga Jaruzelska,*
,1Ewa Zietkiewicz,
†,1Mark Batzer,
‡David E. C. Cole,
§Jean-Paul Moisan,**
Rosaria Scozzari,
††Simon Tavare´
‡‡and Damian Labuda
†,§§*Institute of Human Genetics, Polish Academy of Sciences, 60-479 Poznan, Poland,†Centre de Cance´rologie Charles-Bruneau, Centre de Recherche de l’Hoˆpital Sainte-Justine and§§De´partement de Pe´diatrie, Universite´ de Montre´al, Montreal, Quebec H3T 1C5, Canada, ‡Department of Pathology, Stanley S. Scott Cancer Center, Louisiana State University Medical Center, New Orleans, Louisiana 70112, §Department of Laboratory Medicine and Pathology, Banting Institute, Toronto, Ontario M5G 1L5, Canada, **Laboratoire de Ge´ne´tique Mole´culaire, Plateau Technique de l’Hoˆtel-Dieu, Centre Hospitalier Re´gional et Universitaire, 44035 Nantes, Cedes, France,††Dipartimento
Genetica e Biologia Molecolare, Universita “La Sapienza,” 00185 Rome, Italy and‡‡Departments of Biological Sciences and Mathematics, University of Southern California, Los Angeles, California 90089-1113
Manuscript received November 19, 1998 Accepted for publication March 19, 1999
ABSTRACT
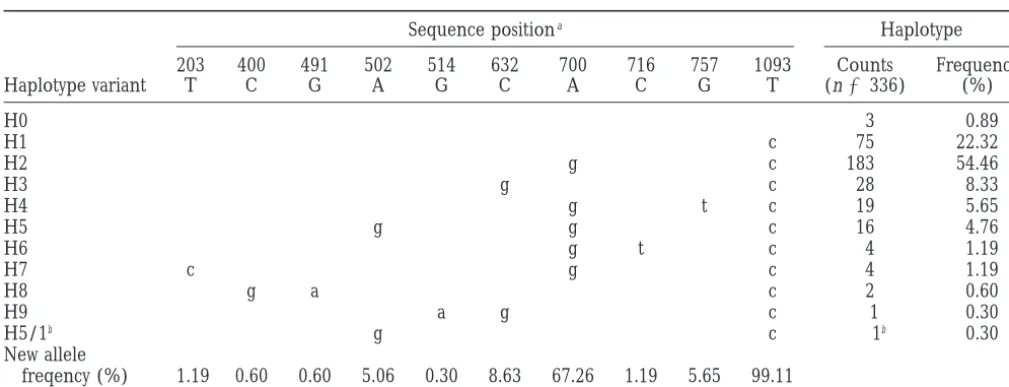
With 10 segregating sites (simple nucleotide polymorphisms) in the last intron (1089 bp) of the ZFX gene we have observed 11 haplotypes in 336 chromosomes representing a worldwide array of 15 human populations. Two haplotypes representing 77% of all chromosomes were distributed almost evenly among four continents. Five of the remaining haplotypes were detected in Africa and 4 others were restricted to Eurasia and the Americas. Using the information about the ancestral state of the segregating positions (inferred from human-great ape comparisons), we applied coalescent analysis to estimate the age of the polymorphisms and the resulting haplotypes. The oldest haplotype, with the ancestral alleles at all the sites, was observed at low frequency only in two groups of African origin. Its estimated age of 740 to 1100 kyr corresponded to the time to the most recent common ancestor. The two most frequent worldwide distributed haplotypes were estimated at 550 to 840 and 260 to 400 kyr, respectively, while the age of the continentally restricted polymorphisms was 120 to 180 kyr and smaller. Comparison of spatial and temporal distribution of the ZFX haplotypes suggests that modern humans diverged from the common ancestral stock in the Middle Paleolithic era. Subsequent range expansion prevented substantial gene flow among continents, separating African groups from populations that colonized Eurasia and the New World.
A
widespread effort to document the amount and Jorde et al. 1998 for a recent review). Nuclear DNAstudies have been focused on microsatellite markers geographic distribution of genetic variation in our
(Bowcocket al. 1994;Dekaet al. 1995;Jordeet al. 1995,
species is motivated by our curiosity about the origins
1997;Di Rienzoet al. 1998;Kimmelet al. 1998;Reich
and prehistory of human populations and our interest
andGoldstein1998) and on insertion polymorphisms in the genetic basis of different diseases. These issues
resulting from Alu retropositions (Batzer et al. 1994,
are closely related because the genetic bases of human
1996;Stonekinget al. 1997). Studies of
nonrecombino-conditions are a function of the present-day structure
genic portions of the Y chromosome are just now gain-of human populations, which by itself cannot be
under-ing momentum (see Jobling andTyler-Smith 1995; stood without knowing the mechanisms shaping the
HammerandZegura1996 for the reviews;Underhill
present genetic variation. Indeed, a starting point for
et al. 1997; Poloni et al. 1997; Scozzari et al. 1997;
studies that aim to explain the role of genetic variation
Hammeret al. 1998;Malaspinaet al. 1998).
in disease risk is a description of the quality, quantity,
Genetic systems differ in their capacity to reveal the and organization of genetic variation within and
be-information pertinent to current structure and likely tween human populations. With the advent of new
tech-population history. Due to differences in effective popu-niques of DNA analysis it is possible to investigate this
lation size, the time depth of the autosomal diversity variability directly. The greatest progress has been
is expected to be four times greater and the X-chro-achieved in the analysis of mitochondrial DNA (see
mosomal diversity three times greater than that of the Y-chromosome or mitochondrial genome. How far one can look back in time depends upon mutation rates.
Corresponding author: Damian Labuda, Centre de Recherche, Hoˆpital
The fast mutation rate of microsatellites makes them
Sainte-Justine, 3175 Coˆte-Sainte Catherine, Montreal, Quebec H3T
suitable for tracing recent evolutionary events, while the
1C5 Canada. E-mail: [email protected]
1These authors have contributed equally to this work. presence of recurrent parallel mutations makes
plasies frequent at a longer time range. Slower mutation of human chromosomes (J. Jaruzelska, E. Zietkie-wicz and D. Labuda, unpublished results; see also rate and virtually negligible probability of a recurrent
mutation in human and great ape lineages characterize Huanget al. 1998). In the present study, the ZFX
poly-morphisms were combined into haplotypes. The fre-classical protein markers, simple nucleotide changes
underlying restriction fragment length polymorphisms quencies of ZFX haplotypes and their geographical stratification in 15 globally distributed populations were (RFLPs) and Alu insertion polymorphisms. Studies of
these variants provided abundant data on polymorph- analyzed. The age of the underlying mutations and the time to the most recent common ancestor (TMRCA) isms dispersed throughout the genome. However, they
often suffered from ascertainment bias. Polymorphisms were estimated from the coalescent haplotype tree. The common distribution of the most frequent haplotypes were initially characterized in a small number of samples
primarily of European origin, which led to genotyping indicates a diversity that characterized the ancestral pop-ulation of modern humans. Differential patterns of hap-of extant world populations for polymorphisms known
from one human group. Neglecting polymorphisms that lotype variability in Africans and non-Africans reflect more recent events. The data are consistent with the were endemic in the compared populations resulted in
an inadvertent loss of pertinent phylogenetic informa- divergence of modern human groups from a common ancestral population z100 kyr ago, followed by range tion. Although the importance of ascertaining the
poly-morphisms in an unbiased manner in all groups of expansion leading to isolation by distance. populations under study is now widely recognized (
Bow-cocket al. 1991;MountainandCavalli-Sforza1994;
MATERIALS AND METHODS
RogersandJorde1996), only a few non-Y-chromosome
nuclear DNA segments have been systematically sur- Human DNA samples (nonnominative, characterized only
by their origin) represented 15 human populations from four
veyed for the presence of sequence polymorphisms in
continents. Europeans included Polish (30 unrelated
chromo-a number of distchromo-antly relchromo-ated populchromo-ations. Vchromo-arichromo-able sites
somes), French-Canadians from the Province of Quebec (23),
were assessed by direct sequencing in anz3-kb segment
Italians (19), and French (21); Asians were represented by
of theb-globin locus (Fullertonet al. 1994;Harding Siberian Nentsi (25), Japanese (21), and Chinese from
main-et al. 1997) and a 10-kb portion of the lipoprotein lipase land China (25); Amerindians by Ojibwa (19), Maya (23), and Karitiana from Brazil (16); Africans by Biaka Pygmies from
gene (Clarket al. 1998) in 349 and 142 chromosomes,
Central Africa Republic (22), M’Buti Pygmies from Congo
respectively. In another survey of 13 populations from
(22), Rimaibe (19), and Mossi from Burkina Faso (27), and
four continents, we screenedz20 independent
chromo-African-Americans from Michigan (24).
somes from each of these populations (total of 250) DNA variation within 1089 bp of the last intron of the ZFX by single-strand conformational polymorphism (SSCP) gene on Xp21.3 (Shimminet al. 1993) in the above sample
of 336 worldwide chromosomes was investigated by SSCP/
analysis for polymorphisms in an 8-kb segment of the
heteroduplex approach, as described earlier (Zietkiewiczet
dystrophin locus (Zietkiewicz et al. 1997). Most of
al. 1992a, 1997). Briefly, the analyzed segment was amplified
these studies indicate the effective population size to
in three overlapping fragments using the following primer
be in the range of z10,000 individuals, which is an pairs: (i) 59-CGGCAGACTGGCTAAACAA and 59-ATGCTTA order of magnitude lower than that concluded from TAACATATTTGAGGG (349 bp, annealing temperature 558);
(ii) 59-AGGACATGGCTGAAACAT and 59-GTGACAAAAAT
diversity data at the major histocompatibility complex
TTCCACTG (306 bp, 558); (iii) 59-GCTGTAAGTTAACGT
(Takahata 1993). Mitochondrial and microsatellite
AAGT and 59-CTGTTCCAGTTTCTTTGCG (666 bp, 508);
am-data suggest recent demographic expansion; this,
how-plification of the first two fragments was done in the presence
ever, is not the case of simple nuclear polymorphisms. of 2% formamide. Prior to electrophoresis in a 6% polyacryl-The highest molecular diversity is consistently seen in amide gel (acrylamide to bisacrylamide ratio 50:1 and 30:1),
the 666-bp PCR product was digested with EcoRI into
frag-sub-Saharan Africans, but it is variably interpreted as
ments of 319 and 347 bp. Mutations underlying gel mobility
being due to the older age of this population, the higher
variants were identified by dideoxy sequencing.
population size in Africa, and/or the greater gene flow
The mutation rate in the 1089-bp ZFX segment, estimated
on this continent. Because the history of a single locus from the human-chimpanzee and human-orangutan compari-is not sufficient to make conclusions about the hcompari-istory sons, was 2.55 (60.44) 3 1025 per generation assuming a
generation time of 20 yr. The ancestral state of the segregating
of populations, more variability data from independent
sites that were due to nucleotide substitutions was inferred by
nuclear loci are needed.
comparison with the orthologous positions in chimpanzee
Studying DNA diversity on the X chromosome offers
and orangutan DNA. Given the mutation rate in the order of
an advantage of straightforward and unequivocal deter- 1029per nucleotide position per year, there is a very small
mination of haplotypes in hemizygous (male) samples. chance that a recurrent event has taken place since the
diver-gence of these species from human lineage 5 and 12 mya. In
The X-chromosome-specific zinc finger protein (ZFX)
other words, the probability is negligible that a human allele
locus became of particular interest because of the virtual
identical with the corresponding site in chimpanzee and
absence of DNA diversity in its Y chromosome
homo-orangutan results from a back mutation or that three identical
logue, the ZFY gene (Dorit et al. 1995; Huanget al. mutations occurred independently after the separation of
1998). Therefore, we have characterized DNA variation these lineages. The identity by state of a human allele and
the corresponding positions in great apes is in practice
1093 ZFX Haplotypes in Human Populations
mount to their identity by descent. Thus, the human allele population varied from 0.3 to 99.1% (Table 1). The identical by state with the chimpanzee and orangutan or- average heterozygosity per polymorphic site was 8.9%, thologues was considered ancestral, whereas the other allele
corresponding to the nucleotide diversity p (or the
of the same polymorphic site was considered new.
mean number of pairwise differences per nucleotide
The derivation of haplotypes from the genotypes was
straightforward in hemizygous males (76 chromosomes), in position) of 0.082%. The latter values ranged from
homozygous female samples (112 chromosomes), and those 0.06% in Europeans to 0.10% in Asians, while African heterozygous at a single position (92 chromosomes). In multi- and Amerindian groups were characterized by p of ple heterozygotes (female samples having distinct alleles at
0.08% (Table 2). The number of polymorphisms in
more than one polymorphic site), the genotype data were
particular populations ranged from two to four (Figure
easily resolved into haplotypes when two polymorphisms were
present within a single SSCP-analyzed fragment (21 individu- 1B). One polymorphic site (700) was shared by all the
als). The remaining haplotypes (7 chromosome pairs) were groups; at another (1093), the new allele was fixed in inferred assuming most likely combinations of the unequivo- all non-African populations. Three sites (514, 632, and cally resolved haplotypes and taking into account their
distri-757) had the new allele present only in non-Africans,
bution among populations.
three others (203, 400, and 491) in Africans, while at
A number of summary statistics (haplotype diversity G, mean
number of pairwise differencesP, nucleotide diversityp, and two sites (502 and 716) the new allele had a patchy
different estimates ofu, the scaled mutation parameter) were distribution, presumably resulting from admixture (see compared using the Arlequin package v.1.1. (Schneideret al. discussion). Thus, the distribution of the polymor-1997). Arlequin was also used to perform neutrality tests
ac-phisms distinguished Africans from other continental
cording toEwens(1972),Watterson(1978),Tajima(1989),
groups.
and Chakraborty (1990), as well as to assess population
genetic structure by analysis of molecular variance (AMOVA; Nucleotide diversity parameters reported here could
Excoffieret al. 1992). For detailed description of the pa- be underestimated because of limitations of the SSCP rameters and tests please refer to the Arlequin help manual method. On the other hand, use of various gel condi-(http://anthropologie.unige.ch/arlequin/).
tions, analyzing partially overlapping fragments, as well
The maximum-likelihood estimate ofuusing the full
infor-as screening a large sample of chromosomes largely
mation in the sequence data set (a haplotype tree, including
the information about the ancestral state) was found using a improve the detection rate of DNA polymorphisms. We
computational method proposed byGriffithsandTavare´ estimate the efficiency of the SSCP/heteroduplex ap-(1994), implemented in the program genetree and available proach at well above 80%, especially given our long from the mathematical genetics group web page at http://
experience in using this technique (e.g., Zietkiewicz
stats.ox.ac.uk/. genetree was also used to find the distribution
et al. 1992a,b, 1997;Akalinet al. 1994). This is a conser-of the TMRCA and the distribution conser-of the ages conser-of the
underly-ing mutations, conditional on the gene tree, usunderly-ing the meth- vative estimate in light of the success rate of up to 98%
ods described inGriffithsandTavare´(1999); alternatively, reported by other authors (Hayashi1991; Ravnik-Gla-the average age of Ravnik-Gla-the mutations was computed from Ravnik-Gla-the vacet al. 1994;Welsh et al. 1997). Moreover,Huang frequencies of their new (nonancestral) alleles (Kimuraand
et al. (1998) sequenced the same ZFX segment in a Ohta1973;GriffithsandTavare´1998;Zietkiewiczet al.
sample of 29 worldwide chromosomes revealing only
1998).
Maximum-likelihood estimates ofuobtained with a constant the ubiquitous site 700. In this context the probability
population size model were compared with those using a that a frequent polymorphism was missed in our analysis model of exponential growth. In the exponential growth is very low.
model there is a decline of the population size backward in
The 10 polymorphic positions described above
co-time from a current size N05 u/3m(22,000 for the
maximum-segregated as 11 haplotype variants (Table 1). The
phy-likelihooduestimate of 1.66), such that the population size
at time t ago is Nt5N0e2bt. Using the genetree program with logenetic relations between these variants are
repre-the expansion rate parameterbof 0.1, 0.2, and 0.3 and the sented by a tree (Figure 1A) that summarizes the generatinguvalue of 1.66, we obtained no improvement in underlying history of mutations. The tree is rooted at the log-likelihood compared with the constant population size
the ancestral haplotype (H0), in which the alleles at all
model (i.e., no evidence for exponential population size
the polymorphic positions are identical by state with
expansion was found). The arbitraryb values selected were
lower than these suggested in the genetree manual (0.5 and the orthologous positions in nonhuman primates. Two
above) to keep them close to more realistic range. most common haplotypes, H1 and H2 are separated
from the ancestral one by one and two mutational steps, respectively, and from each other by a single mutation.
RESULTS
The only exception is the single copy of H5/1, which could be regarded as a recombinant of H5 and H1. Ten single-nucleotide polymorphisms within the
1089-bp sequence of the last ZFX intron were previously Given the mutation rate in the order of 1029per
nucleo-tide per year, the alternative routes of generating H5/ ascertained in a sample of 336 worldwide-distributed
chromosomes (J. Jaruzelska, E. Zietkiewicz and D. 1 through reverse/recurrent mutation at position 700 or at position 502 are much less likely.
Labuda, unpublished results). The ancestral and the
new allele at each site were inferred by comparison with The worldwide distribution of haplotype frequencies (Table 1), with H1 and H2 representing 77% of chromo-the orthologous great ape sequences (see materials
TABLE 1
Haplotypes generated from 10 polymorphic sites in the last intron of the ZFX gene
Sequence positiona Haplotype
203 400 491 502 514 632 700 716 757 1093 Counts Frequency
Haplotype variant T C G A G C A C G T (n5336) (%)
H0 3 0.89
H1 c 75 22.32
H2 g c 183 54.46
H3 g c 28 8.33
H4 g t c 19 5.65
H5 g g c 16 4.76
H6 g t c 4 1.19
H7 c g c 4 1.19
H8 g a c 2 0.60
H9 a g c 1 0.30
H5/1b g c 1b 0.30
New allele
freqency (%) 1.19 0.60 0.60 5.06 0.30 8.63 67.26 1.19 5.65 99.11
aNumbering is that of GenBank sequence HSZFXIN1-X58925; proposed ancestral and new alleles are denoted by upper- and lowercase, respectively.
bExcluded from statistical analysis (see the text).
to Ewens’ sampling theory (Ewens1972). The contribu- effect appears too small to influence the population variability of ZFX, which, according to Ewens-Watterson tion of these two frequent haplotypes was high in all
local populations with the exception of the Chinese, in and Tajima tests (not shown and Table 2, respectively), does not differ from that of a neutral locus.
which H1 was not observed. Except for the rare ancestral
haplotype H0 (found at low frequency in Mossi and We used a coalescent model to infer the time scale of the origin and evolution of polymorphic variation African-Americans), all others were derived from H1
and H2 (Figure 1A) and represented young variants within the ZFX segment. The distribution of coales-cence times and the ages of mutations depend on the based on coalescent analysis of both the full data and
the segregating sites separately (see below). The geo- mutation rate u: u 52Nmg, where N is the number of
chromosomes in the population (for the X-linked locus, graphical distribution of these young haplotypes was not
uniform (Figure 1B), resembling that of the underlying N corresponds to 1.5Ne, assuming equal contribution of
both sexes to Ne), andmgis the mutation rate per DNA
polymorphisms that differentiated between
Sub-Saha-ran Africans and populations from other continents. segment per generation. The Ne estimated from uP,
usingmg52.5531025per DNA segment per generation
Haplotype H9 was restricted to the Chinese population
and haplotypes H7 and H8 to Pygmies. The only haplo- (J. Jaruzelska, E. ZietkiewiczandD. Labuda, unpub-lished results) isz12,000 (i.e.,z18,000 chromosomes). type resulting from a recombination, H5/1, was found
in a single copy in Mossi. A relatively rare haplotype H6 The corresponding Neestimate (ofz20,000 individuals)
based upon uSis almost twice as large (Table 2). The
was present in African-Americans in addition to
popula-tions in Europe and Siberia, while a single copy of the maximum-likelihood estimate ofu conditional on the ZFX gene tree (uML) is 1.66 (60.43), and the
corre-otherwise African haplotype H5 was found in Maya. The
patchy distribution of these two haplotypes presumably sponding Neofz22,000 is close to that based onuS. In
what follows, we compare the distribution of mutational represents recent admixture events (seediscussion).
In the virtual absence of recombinations, the haplo- ages using different estimates ofu (and hence Ne). In
principle it is possible to allow for the effect of variability type diversity within the analyzed ZFX segment results
solely from mutation. Leaving aside the H5/1 recombi- in u when inferring the ages of mutations and coales-cence times (cf.,Tavare´et al. 1997), but here we treat
nant, the remaining haplotypes represent sequences
that can be treated formally as mitochondrial DNA and/ the values ofu as known.
The mutation tree shown in Figure 2 summarizes the or haplotypes in the nonrecombining portion on the Y
chromosome. The lower overall rate of evolution and results obtained by applying the approach ofGriffiths
andTavare´ (1999) to infer mutational ages. This tree lower diversity of the ZFX intron, as compared to other
genomic segments, suggests that selection may have is rooted because the ancestral state at each site is known. The distribution of haplotypes among the conti-acted on this sequence (J. Jaruzelska, E. Zietkiewicz
1095
ZFX
Haplotypes
in
Human
Populations
TABLE 2
Interpretation of molecular diversity at the ZFX locus
World African Non-African Asian Amerindian European
Data
Number of chromosomes (n): 335 113 222 71 58 93
Number of polymorphic sites (S ): 10 7 7 5 5 4
Number of haplotypes (k): 10a 7a 7 6 5 5
Population statistics
Haplotype diversity, G (SD) 0.64 (0.02) 0.63 (0.04) 0.63 (0.03) 0.63 (0.04) 0.64 (0.04) 0.57 (0.04)
Mean no. pairwise differences,P(SD) 0.89 (0.62) 0.84 (0.60) 0.89 (0.62) 1.12 (0.74) 0.82 (0.60) 0.67 (0.52)
Nucleotide diversity (%),p 5 P/L (SD) 0.082 (0.045) 0.077 (0.043) 0.082 (0.049) 0.103 (0.061) 0.075 (0.049) 0.061 (0.041)
Expectedu(based onP),uP5 P(SD) 0.89 (0.69) 0.84 (0.67) 0.89 (0.69) 1.12 (0.82) 0.82 (0.66) 0.67 (0.57)
Expectedu(based on S ),uS5S/Rn21(1/i) (SD) 1.56 (0.57) 1.32 (0.57) 1.17 (0.45) 1.03 (0.52) 1.08 (0.47) 0.78 (0.43)
Tajima’s estimator, D 20.95 20.83 20.51 10.18 20.57 20.30
Expectedu(maximum likelihood,uML(SD) 1.66 (0.43) 1.36 (0.62) 1.06 (0.49) 1.08 (0.49) 0.91 (0.47) 0.81 (0.46)
Expected number haplotypes, E(k) 8.0 6.4 7.3 5.7 5.7 5.1
Effective population sizeb
NeP(SD) 11,600 (9,000) 11,000 (8,800) 11,600 (9,000) 14,600 (10,700) 10,700 (8,800) 8,800 (7,500)
NeS(SD) 20,400 (7,500) 17,300 (7,500) 13,100 (5,900) 13,500 (6,800) 11,200 (6,100) 10,200 (5,600)
NeML(SD) 21,700 (5,600) 17,800 (8,100) 13,900 (6,400) 14,100 (6,400) 11,900 (6,100) 10,600 (6,000)
Coalescent timec, T
tree(SD) 2.52 (0.90) 2.70 (1.02) 2.57 (1.05) 2.62 (1.05) 2.61 (1.14) 2.79 (1.22)
aExcluding variant H5/1.
bMutation rate, 2.5531025per 1089-bp segment per 20-yr generation.
cIn N
theuPestimate (the corresponding values in kyr, using 20 yr per generation, are between parentheses). The expected TMRCA values of 2.5 and 3.1 Ne generation
units correspond to 1100 and 740 kyr, respectively. TMRCA also represents the expected age of the ances-tral haplotype H0. Two globally distributed haplotypes H1 and H2, which arose as the result of mutation at sites 1093 and 700, are 550 to 840 kyr and 200 to 400 kyr old, respectively. The estimated ages of the remaining haplotypes, i.e., those with the restricted or patchy geo-graphical distribution, vary from 5–9 to 120–180 kyr (Figure 2). The average age of each polymorphism esti-mated from the full data is very similar to the average age computed from just the frequencies of its new (non-ancestral) alleles (KimuraandOhta1973;Griffiths
and Tavare´ 1998; Zietkiewiczet al. 1998). Figure 3
compares the average ages of polymorphisms (in Ne
generation units) and associated 5 and 95% percentiles obtained from the new allele frequencies with those obtained from the full data using the estimatesuMLand uPofu. The expected age of the recombinant H5/1 is the same as that of haplotype H9.
Table 2 summarizes the population parameters esti-mated for the world, continents, and all non-Africans together. The estimates of population parameters based onpare generally (except for Asians) lower than these based on S, but this difference is not statistically signifi-cant. This holds, whether we consider the whole sample or its subsets as representative of the world population. Thus, these population groups look quantitatively simi-lar in spite of the qualitative differences in distribution of young haplotypes. The respective parameters calcu-lated for each of the 15 populations analyzed (not
Figure 1.—Maximum parsimony network of ZFX
haplo-types. Circle sizes in the tree are proportional to the haplotype shown) are within the range indicated by the standard
frequencies in the world (A), individual populations (B), or deviation values for the larger, continental groups. It is continents (C). In A, small numbers next to the lines connect- noteworthy that the coalescent time (Table 2) for the ing individual haplotypes indicate the underlying mutation
world and for the continental samples is almost
identi-sites. Note that most of the haplotypes can be derived from
cal, suggesting again that these groups spread recently
each other by a single change; the order of two mutations
separating haplotypes H1 and H8 is unknown; H5/1 is as- from a common ancestral stock and share most of their
sumed to result from the recombination between H1 and H5 earlier genetic history (see alsoDi Rienzoet al. 1998). (broken line). To assess the level of population structure, we
esti-mated the FSTparameter, describing the contribution
of variance among populations to total variance. The maximum-likelihood estimate ofu(uML), assuming
neu-FSTvalues were computed using an AMOVA test (
Excof-trality, random mating, and a constant population size,
fieret al. 1992) based on the pairwise distances between
the expected height of the tree (TMRCA) is estimated
haplotypes. The significance of the components of vari-at 2.5, and the standard devivari-ation of the height of the
ance was assessed by comparing observed levels with the tree is 0.9, time being measured in units of Ne
genera-distribution of 16,000 values obtained by randomiza-tions (Table 2). The corresponding expected TMRCA
tion. FSTcalculated for the world population, considered
value using the estimateuPofuis 3.1 Negenerations. Of
to be composed of 15 subpopulations, was 0.081, indicat-note, we found no significant evidence of exponential
ing that only 8.1% of the total variance resulted from population expansion (seematerials and methods).
the differences among populations andz92% was due Conversion of the age estimates above into years (Figure
to the variance within populations. When the world was 2) depends on the effective population size Ne.
divided into four continental populations or only into In Figure 2 we report the expected ages of the
muta-Africans and non-muta-Africans, FST values were 0.067 and
tions obtained using different values of u. The values
0.048, respectively. The FSTvalue for Africans was 0.064
shown alongside the tree indicate the expected ages in
1097 ZFX Haplotypes in Human Populations
Figure 2.—Gene tree of the ZFX polymorphisms in the sample of 335 worldwide chromosomes. Mutations are indicated on the branches at the distances propor-tional to their estimated average age (23107simulation runs),
us-inguML(maximum-likelihood esti-mate of u) or uP. The order of
mutations at positions 400 and 491 cannot be resolved. The values at the right correspond to the coales-cent times in Negenerations or,
between parentheses, in years (with a generation time of 20 yr and Neconditional onuMLoruP, i.e., Ne522,000 or 12,000,
respec-tively). The corresponding haplo-types are indicated below the tree; the presence of a specific haplo-type in the continental population is indicated by a filled box whereas a hatched box indicates the pre-sumed admixture (see text).
0.062. The results for Europe, Asia, and the Americas were nonsignificant, indicating the absence of popula-tion structure in these groups, which is consistent with the conclusions based on other summary statistics above.
DISCUSSION
The geographical distribution of the DNA diversity in the 1.1-kb ZFX segment is not uniform. Two out of 11 haplotypes (H1 and H2) are ubiquitous and repre-sent 77% of the worldwide sample of 336 chromosomes. Similar prevalence of common haplotypes was also found at other genomic loci. At the 2.67-kb b-globin segment (Harding et al. 1997), 5 common haplotypes
contributedz77% to the worldwide diversity in a
sam-Figure 3.—Comparison of the different estimates of the ple of 349 chromosomes, and at the 8-kb-long dys44
average ages of polymorphisms and of the time to the most segment, 6 frequent haplotypes representedz76% of recent common ancestor (TMRCA). Polymorphisms are or- the worldwide sample of 973 chromosomes (our unpub-dered according to increasing frequency of the new allele.
lished data). The remaining 9 haplotypes at the ZFX
Age estimates obtained from the new allele frequencies
locus have patchy or continentally restricted
distribu-(KimuraandOhta1973) are represented by the filled bars
and coalescent estimates from the full data conditional onuML tion. There is good reason to believe that the occurrence
anduPby the empty and hatched bars, respectively. The range of haplotype H6 in African-Americans is due to
Euro-between the 5th and 95th percentiles is indicated on the bars.
pean admixture in this population (Chakraborty et Percentiles for estimates based on the full data were obtained
al. 1992), although this will have to be confirmed by from the genetree program; those for the ages estimated from
studies of a greater number of local populations and/
the new allele frequencies were calculated as inGriffiths
observation ofSeielstad et al. (1994), who found evi- similar to the observation at the dystrophin locus ( Ziet-kiewicz et al. 1997) and could again indicate a high
dence of African admixture in the same Mayan samples,
reinforces our conclusion; African-American admixture degree of gene flow connecting the populations as well as continents. However, if such intercontinental genetic was also observed among other Amerindian populations
byA. Ruiz-Linares(personal communication). We can exchange existed during the last 100 to 200 kyr, why would a number of distinct young haplotypes persist in therefore tentatively assign 5 of the haplotypes (H0, H5,
H7, H8, and H5/1) to populations from Sub-Saharan isolation, either in Africa or outside, in Eurasia, and the Americas? Likewise, why would the oldest H0 occur at Africa. Haplotypes H3, H4, H6, and H9 appear specific
to the group of non-African populations. Quantitatively, detectable frequency only among Sub-Saharan Africans? We argue that if substantial genetic exchange occurred, the haplotype diversity (G values in Table 2) is similar in
Africa and the remaining continents. Summary statistics it was at the time of ancestral population divergence, preceding the expansion of modern groups. Thereafter, based on the mean number of pairwise differences (uP)
indicate the greatest diversity in Asia. However, similar gene flow was restricted by geographic isolation and physical distance between populations colonizing new to what was observed at the b-globin locus (Harding
et al. 1997), the estimates based on the number of segre- continents.
With reduced genetic drift, population growth could gating sites as well as maximum-likelihood estimates
from the whole data set show that the diversity is greatest be conducive to maintaining the frequency profile of polymorphisms characteristic of the ancestral stock in Africa (uSanduMLE).
All continentally restricted haplotypes except for the from which expanding populations diverged. The ex-cess of the number of segregating sites over the nucleo-ancestral H0 are estimated to have arisen between 120
and 180 kya and the present, on the basis of a coalescent tide diversity p (i.e., the negative value of Tajima’s D parameter) and the excess of the observed over ex-analysis of the full data, and between 160 kya and the
present using the mutation ages estimated from the new pected number of haplotypes, E(k), according toEwens
(1972) sampling (see World, Table 2) may suggest that allele frequency (Figures 2 and 3). In contrast, variants
H1 and H2 estimated at 550 to 840 and 200 to 400 a weak trace of the recent demographic growth is re-flected in our sample. However, selection could also be kyr, respectively, are found at high proportions in all
populations except from Chinese (Figure 2). The ab- evoked to explain these observations (J. Jaruzelska, E. Zietkiewicz andD. Labuda,unpublished results). sence of H1 from Chinese, where it is replaced by the
much younger haplotype H3, may reflect founder effect Moreover, other non-Y-chromosome nuclear loci stud-ied in a similar way provide no evidence for population associated with peopling of Asia and its subregions (e.g.,
Wang et al. 1991). The presence of H1 in two other expansion. Hey (1997) indicated that most nuclear genes show slightly positive skew in frequency spectrum, Asian populations, the paucity of H3 in Europeans, as
well as the tree structure in Figure 1A (indicating that and studies of b-globin, dystrophin, and LPL loci (Clark et al. 1998; Harding et al. 1997;Zietkiewicz
H1 “missing” in Chinese is an intermediary form
be-tween H0 and both H2 and H3) preclude the interpreta- et al. 1997, 1998) reported positive D associated with
the non-Y-chromosome nuclear diversity. On the other tion that the two most common haplotypes in the
Chi-nese reflect ancestral haplotype frequencies. Rather, it hand, these observations do not allow firm conclusions. The positive D values reported forb-globin, dystrophin, is the presence of H1 and H2 and their frequency profile
that are similar across the continents (Figure 1C), to- and LPL, as well as the negative ones observed here for ZFX were not significantly different from zero. This is gether with the oldest variant H0 that is still detectable
in Africa, which can be regarded as the ancestral con- further illustrated by the fact that the D values calculated here for individual populations were both positive and figuration.
Considering the continents separately, one obtains negative (not shown). The coalescent estimates from
b-globin data (Harding et al. 1997) did not perform
the same coalescent time (Table 2) as for the pooled
sample representing the world. A similar observation better under a model of expanding population than under a constant population size model, which was also was made with microsatellite data (Di Rienzo et al.
1998), which are consistent with the shared roots of the the case for ZFX (seematerials and methods). Thus, if there was any population size expansion, it was not contributing populations throughout the substantial
pe-riod of their earlier genetic history. Worldwide similarity detected by the exponential model or it was probably too recent to be detectable in the observed patterns of of the frequency profiles of the most common
haplo-types could reflect extensive gene flow between the con- ZFX and/or b-globin diversity. On the other hand, a model that assumes expansion from the Middle/Upper tinents. An AMOVA test performed to provide estimates
of variance components and of the F-statistics represent- Paleolithic up to the present is suggested by paleonto-logical studies (LahrandFoley 1998). A recent pop-ing the correlation of haplotypes at different levels of
hierarchical groupings revealed low variation among ulation growth is also consistent with genetic studies of mitochondrial DNA or nuclear microsatellites (Di
constituting populations or groups of populations as
1099 ZFX Haplotypes in Human Populations
Rogers and Harpending 1992; Jorde et al. 1997; Di have left no time (depending also upon the size of the expanding populations) for the system to fully recover
Rienzoet al. 1998;Kimmelet al. 1998). These genetic
systems, because of the higher mutation rates, are more and reach the equilibrium. As a result, we may observe either the shortage of segregating sites, as in non-African suitable for detecting expansion at relatively short
evolu-tionary time scales in the range of 100 kyr. In conclusion, populations at the dys44 locus (Zietkiewiczet al. 1998)
or a number of new sites that contribute touSbut very
most nuclear loci characterized for simple nucleotide
polymorphisms imply a different past in comparison little to nucleotide diversity, as in Africans at dys44 ( Ziet-kiewiczet al. 1998) and in this study. The net effect on
to mitochondrial or microsatellite studies (Jordeet al.
1995;Hey1997). the world diversity reflected bypand S may be that the data fit well and can be thus analyzed in terms of a Interestingly, the answer to these discrepancies may
lie in the analysis of extended haplotypes, where nuclear constant population size model.
Our interpretation of the ZFX data is supported by diversity generated by rare mutational events would be
enhanced by recombinational events, giving insight into similar results obtained for the b-globin (Harding et al. 1997) and dys44 (Zietkiewiczet al. 1998) loci. Taken
more recent population histories, and corresponding
to the time frame of mitochondrial and microsatellite together with mitochondrial, microsatellite, and paleon-tological evidence, these data suggest the divergence mutations. It should be emphasized that the virtual
ab-sence of recombinants in ZFX does not necessarily indi- of modern human groups from a common ancestral populationz100 kyr ago (taking into account that pop-cate lack of recombination in this region. Assuming the
genomic average of 44 crossovers per female meiosis ulation trees are usually shorter than these of the under-lying genes) followed by range expansion leading to the per generation (Broman et al. 1998) and taking into
account that only two-thirds of the X chromosome popu- isolation by distance. What is the geographic origin of the ancestral population? Greater genetic diversity in lation participates in female meioses, an average
geno-mic crossover rate is 1028per base pair per generation, Africans has frequently been taken as evidence of this
population’s antiquity (Nei et al. 1975; Batzer et al. i.e.,z1025 per 1089 bp in the ZFX segment analyzed.
Yet, informative chromosomal pairs that would lead to 1994;Horaiet al. 1995;Tishkoffet al. 1996). The fact
that genetic diversity outside of Africa can be interpre-detectable recombinants represent only 3% of all ZFX
haplotype combinations (in other words, 97% of recom- ted as being a subset of the African set has been seen as even more compelling evidence for the out-of-Africa binations between “noninformative” ZFX segments
re-main undetected). Thus, an apparent recombination origin (Stonekinget al. 1997;Jordeet al. 1998).
How-ever, in the dys44 study, the excess of the African diver-rate in ZFX is 331027, a hundred times less than the
mutation rate of 2.631025in the same segment. sity was shown to have accumulated only following the
divergence of modern humans (Zietkiewicz et al.
The ZFX data truncation (a single chromosome
rep-resenting the recombined haplotype 5/1 was excluded) 1998). Greater diversity in one group may be due to its better representation in the worldwide sample analyzed introduced for the sake of the coalescent analysis was
minimal. In some loci, however, the contribution of (Bowcocket al. 1991;MountainandCavalli-Sforza
1994;RogersandJorde1996) or to the way we group crossovers to haplotype diversity may be non-negligible.
Such an effect is very pronounced in the recently studied or define the populations. It may also reflect greater long-term effective population size following expansion LPL locus (Clarket al. 1998; Nickersonet al. 1998),
as well as in the dys44 locus (our unpublished data). In (Relethford 1995; Relethford and Harpending
1995;RogersandJorde1995) or particular history of this context the good fit between the mutational age
estimates based on the full ZFX data and those using founder effects, extinctions, and expansions of local populations examined (Takahata1994).
just the frequencies of the new allele (Figure 3) is
note-worthy. Similar concordance was shown for theb-globin Assuming that the ancestral population diverged and underwent range expansion in the Middle/Upper Pa-data ofHardinget al. (1997; see Figure 4 in
Zietkie-wiczet al. 1998). Although the latter age estimate has leolithic, old haplotypes could have been carried away from the place of origin and preferentially preserved a larger variance, it can be calculated for each mutation
in the haplotype without knowing the underlying tree. in populations that colonized new areas conducive to relatively uninterrupted growth and demographic pros-The genetic diversity measures, pointing to the
popu-lation size ofz10,000 to 20,000, presumably reflect the perity. Another model, which can be described as a single-species model (seeFoley1998), favors extensive size of the ancestral population or speciation bottleneck
rather than the harmonic mean of the effective sizes of gene flow among distant hominid populations over the whole Paleolithic and thus the contribution of dispersed the world population from Middle Pleistocene to the
present. Speciation bottleneck and/or divergence and ancient populations to modern human origins (re-viewed in Templeton 1997). The argument becomes range expansion from a relatively small ancestral
popu-lation would have a greater impact on the number of circular if assuming gene flow we subsequently argue that the presence of a haplotype in a geographically segregating sites than on the nucleotide diversity. If such
tween loci, and implications for human demographic histories.
there. Thus, a demonstration of an archaic lineage on
Genetics 148: 1269–1284.
one or another continent does not prove anything un- Dorit, R. L., H. AkashiandW. Gilbert,1995 Absence of
polymor-phism at the ZFY locus on the human Y chromosome. Science
der any of the above scenarios. With migration and
268:1183–1185.
range expansion playing an important role in all the
Ewens, W. J.,1972 The sampling theory of selectively neutral alleles.
underlying models, the geographic location of the mod- Theor. Popul. Biol. 3: 87–112.
Excoffier, L., P. SmouseandJ. Quattro,1992 Analysis of
molecu-ern human origin cannot be inferred from the genetic
lar variance inferred from metric distance among DNA
haplo-evidence alone. Paleontological findings and
paleocli-types: application to human mitochondria DNA restriction data.
matic data (Tattersall1995;LahrandFoley 1998) Genetics 131: 479–491.
Foley, R.,1998 Genes, evolution and diversity: yet another look
place the origin of the ancestral population in Africa
at the problem of modern human origins. Evol. Anthropol. 6:
or the Middle East, between the Klasies River and
Qaf-191–193.
zeh. Our data neither contradict nor prove this scenario. Fullerton, S. M., R. M. Harding, A. J. BoyceandJ. B. Clegg,1994
Molecular and population genetic analysis of allelic sequence
We believe, however, that integrating data from a variety
diversity at the humanb-globin locus. Proc. Natl. Acad. Sci. USA
of genetic systems and interpreting them in the context
91:1805–1809.
of the outside evidence will be more illuminating in Griffiths, R. C.,andS. Tavare´,1994 Ancestral inference in
popula-tion genetics. Stat. Sci. 9: 307–319.
this respect. The need for more extensive sampling of
Griffiths, R. C.,andS. Tavare´,1998 The age of a mutation in a
human populations from different geographic areas
general coalescent tree. Stochastic Models 14: 273–295.
and of different loci from the nuclear genome appears Griffiths, R. C.,andS. Tavare´,1999 The ages of mutations in
gene trees. Ann. Appl. Prob. (in press).
more than evident, and this study is one of the
contribu-Hammer, M. F.,andS. L. Zegura,1996 The role of the Y
chromo-tions to fulfill this task.
some in human evolutionary studies. Evol. Anthropol. 5: 116–134. Hammer, M. F., T. Karafet, A. Rasanayagam, E. T. Wood, T. K. Thanks to Dominik Gehl for his assistance in computing and to
Altheideet al., 1998 Out of Africa and back again: nested Raffaela Ballarano for typing the manuscript. This work was supported
cladistic analysis of human Y chromosome variation. Mol. Biol. by National Science Foundation grants DMS 95-04393 to S.T. and
SBR-Evol. 15(4): 427–441. 9610147 to M.B., by the Canadian Genome Analysis and Technology
Harding, R. M., S. M. Fullerton, R. C. Griffiths, J. Bond, M. J. Cox Program, and by the Medical Research Council of Canada grant
et al., 1997 Archaic African and Asian lineages in the genetic
to D.L. ancestry of modern humans. Am. J. Hum. Genet. 60: 772–789.
Hayashi, K.,1991 PCR-SSCP: A simple and sensitive method for detection of mutations in the genomic DNA. PCR Methods Appl.
1:34–38.
LITERATURE CITED Hey, J.,1997 Mitochondrial and nuclear genes present conflicting portraits of human origins. Mol. Biol. Evol. 14: 166–172. Akalin, N., E. Zietkiewicz, W. MakalowskiandD. Labuda,1994 Horai, S., K. Hayasaka, R. Kondo, K. TsuganeandN. Takahata,
Are CpG sites mutation hot spots in the dystrophin gene? Hum. 1995 Recent African origin of modern humans revealed by
com-Mol. Genet. 3: 1425–1426. plete sequences of hominoid mitochondrial DNAs. Proc. Natl.
Batzer, M. A., M. Stoneking, M. Alegria-Hartman, H. Bazan, Acad. Sci. USA 92: 532–536.
D. H. Kasset al., 1994 African origin of human-specific polymor- Huang, W., Y.-X. Fu, B. H. Chang, X. Gu, L. B. Jordeet al., 1998 phic Alu insertions. Proc. Natl. Acad. Sci. USA 91: 12288–12292. Sequence variation in ZFX introns in human populations. Mol. Batzer, M. A., S. S. Arcot, J. W. Phinney, M. Alegria-Hartman, Biol. Evol. 15(2): 138–142.
D. H. Kasset al., 1996 Genetic variation of recent Alu insertions Jobling, M. A.,andC. Tyler-Smith,1995 Fathers and sons: the Y in human populations. J. Mol. Evol. 42: 22–29. chromosome and human evolution. Trends. Genet. 11: 449–456. Bowcock, A. M., J. Kidd, J. L. Mountain, J. M. Hebert, L. Caroten- Jorde, L. B., M. J. Bamshad, W. S. Watkins, R. Zenger, A. E. Fraley utoet al., 1991 Drift, admixture, and selection in human evolu- et al., 1995 Origins and affinities of modern humans: a compari-tion: a study with DNA polymorphisms. Proc. Natl. Acad. Sci. son of mitochondrial and nuclear genetic data. Am. J. Hum.
USA 88: 839–843. Genet. 57: 523–538.
Bowcock, A. M., A. Ruiz-Linares, J. Tomfohrde, E. Minch, J. R. Jorde, L. B., A. R. Rogers, M. Bamshad, W. S. Watkins, P. Krakow-Kiddet al., 1994 High resolution of human evolutionary trees iak et al., 1997 Microsatellite diversity and the demographic with polymorphic microsatellites. Nature 368: 455–457. history of modern humans. Proc. Natl. Acad. Sci. USA 94: 3100– Broman, K. W., J. C. Murray, V. C. Sheffield, R. L. WhiteandJ. L. 3103.
Weber,1998 Comprehensive human genetic maps: individual Jorde, L. B., M. BamshadandA. R. Rogers,1998 Using mitochon-and sex-specific variation in recombination. Am. J. Hum. Genet. drial and nuclear DNA markers to reconstruct human evolution.
63:861–869. Bioessays 20: 126–136.
Chakraborty, R.,1990 Mitochondrial DNA polymorphism reveals Kimmel, M., R. Chakraborty, J. P. King, M. Bamshad, W. S. Watkins hidden heterogeneity within some Asian populations. Am. J. et al., 1998 Signatures of population expansion in microsatellite
Hum. Genet. 47: 87–94. repeat data. Genetics 148: 1921–1930.
Chakraborty, R., M. I. Kamboh, M. NwankwoandR. E. Ferrell, Kimura, M.,andT. Ohta,1973 The age of a neutral mutant per-1992 Caucasian genes in American Blacks: new data. Am. J. sisting in a finite population. Genetics 75: 199–212.
Hum. Genet. 50: 145–155. Lahr, M. M.,and R. Foley, 1998 Towards a theory of modern
Clark, A., K. M. Weiss, D. A. Nickerson, S. L. Taylor, A. Buchanan human origins: geography, demography and diversity in recent et al., 1998 Haplotype structure and population genetic infer- human evolution. Am. J. Phys. Anthropol. 27(Suppl.): 137–176. ences from nucleotide-sequence variation in human lipoprotein Malaspina, P., F. Cruciani, B. M. Ciminelli, L. Terranato, P.
lipase. Am. J. Hum. Genet. 63: 595–612. Santolamazzaet al., 1998 Network analyses of Y-chromosomal
Deka, R., L. Jin, M. D. Shriver, L. M. Yu, S. Decrooet al., 1995 types in Europe, Northern Africa, and Western Asia reveal specific Population genetics of dinucleotide (dC-dA)n·(dG-dT)npolymor- patterns of geographic distribution. Am. J. Hum. Genet. 63: 847–
phisms in world populations. Am. J. Hum. Genet. 56: 461–474. 860.
Di Rienzo, A.,andA. C. Wilson,1991 Branching pattern in the Mountain, J. L.,andL. L. Cavalli-Sforza,1994 Inference of hu-evolutionary tree for human mitochondrial DNA. Proc. Natl. man evolution through cladistic analysis of nuclear DNA
restric-Acad. Sci. USA 88: 1597–1601. tion polymorphisms. Proc. Natl. Acad. Sci. USA 91: 6515–6519.
be-1101 ZFX Haplotypes in Human Populations
Nickerson, D. A., S. L. Taylor, K. M. Weiss, A. G. Clark, T. G. Tajima, F.,1989 Statistical method for testing the neutral mutation Hutchinsonet al., 1998 Genome resequencing and variation hypothesis by DNA polymorphism. Genetics 123: 585–595. analysis in a 9.7 kb region of the human lipoprotein lipase gene. Takahata, N.,1993 Allelic genealogy and human evolution. Mol.
Nat. Genet. 19: 233–240. Biol. Evol. 10: 2–22.
Poloni, E. S., O. Semino, G. Passarino, A. S. Santachiara-Benere- Takahata, N.,1994 Repeated failures that led to the eventual suc-cetti, I. Dupanloupet al., 1997 Human genetic affinities for cess in human evolution. Mol. Biol. Evol. 11: 803–805. Y-chromosome P49a,f/TaqI haplotypes show strong correspon- Tattersall, I.,1995 The Fossil Trail: How We Know What We Think dence with linguistics. Am. J. Hum. Genet. 61: 1015–1035. We Know About Human Evolution. American Museum of Natural Ravnik-Glavac, M., D. GlavacandM. Dean,1994 Sensitivity of History. Oxford University Press, New York.
single-strand conformation polymorphism and heteroduplex Tavare´, S., D. J. Balding, R. C. GriffithsandP. Donnelly,1997 method for mutation detection in the cystic fibrosis gene. Hum. Inferring coalescence times for molecular sequence data.
Genet-Mol. Genet. 3: 801–807. ics 145: 505–518.
Reich, D. E.,andD. B. Goldstein,1998 Genetic evidence for a Templeton, A. R.,1997 Out of Africa? What do genes tell us? Curr. Paleolithic human population expansion in Africa. Proc. Natl. Opin. Genet. Dev. 7: 841–847.
Acad. Sci. USA 95: 8119–8123. Tishkoff, S. A., E. Dietzsch, W. Speed, A. J. Pakstis, J. R. Kiddet
Relethford, J. H.,1995 Genetics and modern human origins. Evol. al., 1996 Global patterns of linkage disequilibrium at the CD4
Anthropol. 4: 53–63. locus and modern human origins. Science 271: 1380–1387.
Relethford, J. H.,andH. C. Harpending,1995 Ancient differ- Underhill, P. A., L. Jin, A. A. Lin, S. Q. Mehdi, T. Jenkinset al., ences in population size can mimic a recent African origin of 1997 Detection of numerous Y chromosome biallelic polymor-modern humans. Curr. Anthropol. 36: 667–673. phisms by denaturing high-performance liquid chromatography. Rogers, A. R.,andH. Harpending,1992 Population growth makes Genome Res. 7: 996–1005.
waves in the distribution of pairwise genetic differences. Mol.
Wang, T., Y. Okano, R. C. Eisensmith, M. L. Harvey, W. H. Y.
Biol. Evol. 9: 552–569. Loet al., 1991 Founder effect of a prevalent phenylketonuria
Rogers, A. R.,andL. B. Jorde,1995 Genetic evidence on modern
mutation in the Oriental population. Proc. Natl. Acad. Sci. USA human origins. Hum. Biol. 67: 1–36.
88:2146–2150. Rogers, A. R.,andL. B. Jorde,1996 Ascertainment bias in estimates
Watterson, G. A.,1978 The homozygosity test of neutrality. Genet-of average heterozygosity. Am. J. Hum. Genet. 58: 1033–1041.
ics 88: 405–417. Schneider, S., J.-M. Kueffer, D. RoessliandL. Excoffier, 1997
Welsh, J. A., K. CastrenandK. H. Vahakangas,1997 Single-strand Arlequin ver. 1.1: a software for population genetic data analysis.
conformation polymorphism analysis to detect p53 mutations: Genetics and Biometry Laboratory, University of Geneva,
Switzer-characterisation and development of controls. Clin. Chem. 43: land.
2251–2255. Scozzari, R., F. Cruciani, P. Malaspina, P. Santolamazza, B. M.
Zietkiewicz, E., D. Sinnett, C. Richer, G. Mitchell, M. Vanasseet Ciminelliet al., 1997 Differential structuring of human
popula-al., 1992a Single-strand conformational polymorphisms (SSCP): tions for homologous X and Y microsatellite loci. Am. J. Hum.
detection of useful polymorphisms at the dystrophin locus. Hum. Genet. 61: 719–733.
Genet. 89: 453–456. Seielstad, M. T., J. M. Hebert, A. A. Lin, P. A. Underhill, M.
Zietkiewicz, E., L. R. Simard, S. B. Melanc¸on, M. VanasseandD. Ibrahim et al., 1994 Construction of human Y-chromosomal
Labuda,1992b Carrier status diagnosis in Duchenne muscular haplotypes using a new polymorphic A to G transition. Hum.
dystrophy with “conformational” DNA polymorphism. Lancet Mol. Genet. 3(12): 2159–2161.
339:134. Shimmin, L. C., B. H. ChangandW. H. Li,1993 Male-driven
evolu-tion of DNA sequences. Nature 362: 745–777. Zietkiewicz, E., V. Yotova, M. Jarnik, M. Korab-Laskowska, K. K. Slatkin, M.,andR. R. Hudson,1991 Pairwise comparisons of mito- Kiddet al., 1997 Nuclear DNA diversity in worldwide distributed
chondrial DNA sequences in stable and exponentially growing human populations. Gene 205: 161–171.
populations. Genetics 129: 555–562. Zietkiewicz, E., V. Yotova, M. Jarnik, M. Korab-Laskowska, K. K.
Stoneking, M., J. J. Fontius, S. L. Clifford, H. Soodyall, S. S. Kiddet al., 1998 Genetic structure of the ancestral population Arcot et al., 1997 Alu insertion polymorphisms and human of modern humans. J. Mol. Evol. 47: 146–155.
evolution: evidence for a larger population size in Africa. Genome