Determination of
Exponential Parameters
K. Irene Snyder
Wesley E. Snyder
Center for Communications and Signal Processing
Department Electrical and Computer Engineering
North Carolina State University
TR-91/11
Determination of Exponential Parameters
K. Irene Snyder
Department of Psychology
University of North Carolina at Chapel Hill Wesley E. Snyder
Deptof Radiology
Bowman Gray School of Medicine Winston-Salem, NC
The problem offinding the parameters of exponential processes is discussed. Difficulties with numerical approaches based on gradient descent are illustrated. A new method for finding those parameters is presented, which requires virtually no manual intervention, and which can find globally optimal estimates
1
Introduction
Researchers in perception and psycho-physics often find it necessary to plot data points or measurements in loga-rithmic curves against time. Displace-ment threshold determina-tion[31] , tilt aftereffect growth and decay[12,21] contrast and light adap-tation [37], vibrotactile sensitivity [15], and many others produce data that is best fit by logarithmic curves. Stevenson's power law and Atkins vn's more general equation[2] show a gen-erally exponential/logarithmic rela-tionship between sensation magnitude and stimulus intensity.
Quantification of the physiological processes underlying the obs~~ed be-havior often requires deterrmmng the parameters of an expon~nt~al func-tion; however, a difficulty lies In deter-mining the best fitting curve fo~ da~a on an exponential or Iogarithmic curve, since data unfortunately rarely
lies precisely on a simple exponential curve. In this paper, we address the fundamental problem of finding the best estimate of the parameters of an exponential-type functions, given noisy measurements of that function. The resulting technique is demon-strated here for simple exponential functions, but is generally applicable to more complex functions such as those described by Atkinson[2]. Given an exponential function such as
b ex y=a+ e ,
to find the values of the parameters a, band c which provide the best fit, we find the curve which minimizes the error, or the distance between the data points and the curve. We describe this error by
:~::)(yi- (a +bect;)]2 (1.1) i
1.1Gradient Descent
\ where E' and E" are the first and sec-ond derivatives ofE with respect x.
There are a number of problems inher-ent in gradiinher-ent descinher-ent-type methods:
• Parameter sensitivity The
ranges in the parameters, and their sensitivity to perturbations may easily differ by orders of magni-tude. For example, the parameter c described in the equations above is critical to the stability of the algo-rithm, and very sensitive to small errors. To compensate for this sen-sitivity, we divide the gradient by the second derivative (in the scalar case, or by some norm of the Hes-sian matrix for more complex prob-lems). While use of the second de-rivatives solves some of the sensitivity problem, it introduces a second problem: algebraic tedia.
• Representational complexityTo
perform gradient descent, one must analytically evaluate first and sec-ond partial derivatives. This alge-braic process, while straightfor-ward, is tedious and prone to error. Fortunately, there are now a num-ber of symbolic math software packa, _3 which can be used to automated this process. For the many users who do not have easy access to such tools, the simple process of correctly differentiating complex expressions is tedious and time consuming at best.
• n1~teaus Exponential functions
110.ve a notorious tendency to have
plateaus in the corresponding MSE fit functions. For example, Figure
1 illustrates the error measure of Equation (1) plotted vs. c with a and b held at their optimal values. The slope of this curve becomes
ar-bitrarily small as one moves to the left along- the c axis. If one choose a
(1.2)
An algebraic solution to this simulta-neous system of equations is intracta-ble. Thus, we are forced to consider numerical methods.
Gradient descent, a standard nu-merical technique for optimization, finds the minimum by stepping slowly down the slope since the slope always points away from the minimum (or at least, from some minimum). Given some scalar function Eix) , and a cur-rent estimate (at iteration
kiJ ·
fi
k) to find the downhill point x(k+ ) gradier descent usesThe easiest way to find the mini-mum of such an expression is to find the zeroes of the derivatives, but dif-ferentiating this equation gives us
three
deriva-tives:
stopping criterion for gradient de-scent such as "stop if the magnitude of the gradient is less than T', it is trivial to find such a point by mov-ing along the c axis away from the minimum.
• Local Minima
The primary flaw with gradient de-scent as a means of solving this type of minimization problem is that (unless it gets caught on a pla-teau), it finds the minimum ne: I.-st
to the starting point, which mayor may not be the absolute minimum.
1.2 Simulated Annealing
The minimization technique known as simulated annealing [19,1] avoids the problems of local minima and plateaus
I
I
I
I
I I
~
--0.5-x-0 0 -y-500
Figure 1.
Fit error vs. exponerrti.rl parameter c
and may be described as follows: 1. Choose (at random) an initial
value ofx.
2. Generate a point y which is a "neighbor" ofx.
3. IfE(y) < E(x), y becomes the new value ofx.
4. If E(y) > Et«) , compute
Py=exp(-E(x)-E(y)IT). IfbPy >
I!
for R (a random num er um-formly distributed between 0 and1) then accepty.
5. Decrease T slightly.
6. IfT> Tmin' go to 2.
In step 3, we perform a descent, so that we always fall "downhill". In step 4, we make it possible to sometimes move uphill and get out of a valley. In-itially, we ignore T and note that ify represents an uphill move, the prob-ability of acceptingy IS proportional to
e-(E(y) -E(x))IT . Thus, uphill moves
can occur, but are exponentially less likely to occur as the size of the uphill move Lccomes larger. The likelihood of an uphill move is, however, strongly influenced hy T. If T is very large, all moves will iJe accepted. As T is gradu-ally reduced, uphill moves become less likely until for low values of T,
T«(E(y) - E(x)), such moves essen-tially can; !-occur.
In the case of combinatorial optimiza-tion, where all the variables take on
only one of a small number (usually
Continuous Optimization (tree annealing)
much more difficult to quantify the concept of "neighbor".
In the next section, we describe a new minimization strategy, which handles continuously-valued van-abIes.
2
Continuous Optimization (treeannealing)
Although some work has been done on extending SA to problems with con-tinuous variables[36], the nature of the SA algorithm makes it best suited for solving problems in combinatorial optimization, in which the variables take on only discrete values. This is primarily due to the difficulty in speci-fying, for a particular problem, pre-cisely what the "neighborhood" of a continuously-valued variable is. We will not~ in this paper, attempt to sur-vey all the other (that is, not based on SA) methods for continuous optimiza-tion. See [8] for more information.
In this section, we discuss a method for finding the minimum of functions of continuously-: ilued vari-abIes. We find it convenie ;0 think of
the optimization problem a search: the minimum lies somewhere in a bounded hyperspace of dimension d. It is not practical to use any sort of array structure to store a representation of such a space, since the storage rapidly becomes prohibitive. Instead, we use a ti .~.
The minimization method de-scribed here, which we call "tree an-nealing" is an extension of the familiar Metropolis [23]algorithm of simulated annealing, but handles continuously valued variables in a natural way.
We assume we are searching for the minimum of some function Hix)
where the d-dimensional vector x has continuously-valued elements. Fur-thermore, we ass~e a bounded search space S c9\ , which we will represent with a dynamic data struc-ture.
We use a k-d tree in which each level of the tree represents a binary partition of one particular degree of freeriom(DOF). Each node may thus be interpreted as representing a hyper-rectangle, and its «hildren therefore represent the smal. hyperrectangles resulting from dividing the parent along one particular DOF. In Figure 2, we illustrate a one-dimensional energy function, and show how a resulting partition tree provides more resolution in the vicinity of minima.
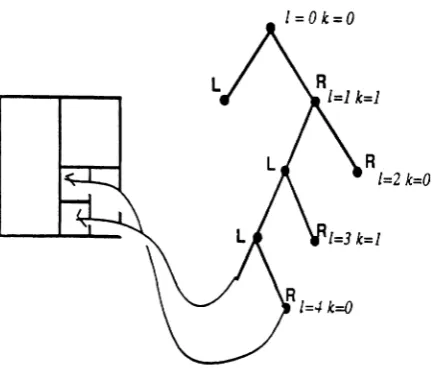
In Figure 3, we illustrate a 2-D
exam-Figllre 2. A one dimensional search space and corresponding partition tree It is important to remember that the tree is built using a random process therefore, the tree is
likely to possess more depth (resolution) in the vicinity of minima. Therefore this figure
shows only what the tree islikelyto be.
refinements.
I=Ok=O
R
1=2 k=O
Figure 3. A two dimensonal example
In general, for ad-dimensional problem,
a node at level l will divide the kth degree of freedom in half,
where k
=
I mod d The two chil-dren of each node represent the subspace resulting from dividing the parent subtree in half along thek
111 sample, in a 6 DOF problem, suppose the domain of DOF 4 is 0 ~ x4 ~ 1. Then a node at level 22 represents a partition ofDOF 4, a par- .n whosewidth IS
2l2~/6J
=0.0625.The mr-tropolis algorithm proceeds as follow"
1. Given a current estimate XES, generate a "neighboring" point y E S, with generation probability
g(yIx), It is necessary to assume
that g is symmetric in the following
sense:
g(y I x) =g(x I y ).
2. Accept the point y as the new esti-mate with .probability
min
(1
P(Y)) (2.1)'p(x) ,
where the probabilities are Gibbs,
(i.e., with form
p().) ex: exp
(_H~»).
Consider,for a moment, the form of Equation
(1). In it, we point out that the deci-sion to accept or reject y is based on a probability. A moment's reflection ,-11 convince the reader that this is equivalent to steps 3 and 4 of the simulated annealing algorithm,
Omitting for the moment discus-sion of annealing, that is, reducing T,
we consider how the Simulated An-nealing strategy is modified by this "tree annealing" (TA) algorithm.
2.1Growing and Searching the Tree
While the tree represents the ~_
tl-t~1·e search space, we build it with . _~ .. Jr resolution in the vicinity of lo-cal minima. To see how this works, let us assume the process has been run-ning for a while, and the tree has al-ready been partially built. At each node, two numbers have been stored,
"t. and nR , which represent how many times in the past that an acceptable point has been found in the left and right subtrees, respectively, of that node.
IThis description is sli-ttly different from the on- nresente' ~:.rlier, since we want to
Continuous Optimization (tree annealing)
g(y) is computed from the path of the descent down the tree by Equation
node visitr ,1 at level l, a
l represents
', or nR'~; .rrding to which direction as chosen at each l, Similarly, bZ rep-resents the n of the direction not cho-tance) and simply the history of the search itself-- areas that have been searched are more likely to be searched again. We must compensate for the second phenomenon.
Step 1 of the preceding procedure for growing and searching the tree im-plies a g(yIx) which does not actually depend on the current x. We will find this to be sufficient and henceforth will write the probability of generating a candidate y as simply g(y), regard-less of x. Note, however, that a g of this form violates the symmetry
g(: \=g(x) (unless it is uniform). The resulting Metropolis procedure will
not converge to the Gibbs distribution in general unless this asymmetry is accounted for. The following modifica-tion of Eq. (1.1) c.,n be proven [5] to
converge to the Gibbs density:
(2.2)
probabil-(2.3)
l represents the with
y
/\ al
PI = a/+b'1
. ( g(X)P(Y))
min 1,g(y)p(x) ·
Accept
(2.3)where ity.
Following the basic Metropolis schema, we are given a vector x, which we refer to as "the current sample" and corresponding objective Htx), To choose a candidate point:
1. Begin at the root and, at each node, choose either the left or right child
ran-n n
domly with probability nL+~R or nL+RnR'
respectively. Descend the tree to a leaf making left-right decisions inthis way.
1. Upon reaching a leaf, generate the point y
at random (uniformly) from the subspace defined by that leaf.
3. Compare x and y ar nake an
ac-cept/reject decision on J" "s decision is discussed in more detail ~. .henext sub-section. Ify is accepted, replace xby yas the current sample; else, ifyis rejected, x
remains the current sample.
4. If y was accepted, split the current leaf
(containing y), and create two new
daughter nodes, thus making more resolu-tion available at this node if it is ever ex-plored again.
5" Ascend the tree from the current sample to th.: root, updating "t. and nR at each node.
2.2 Accept/reject decisions
The accept/reject decision of step 3 is similar to the familiar one used in simulated annealing, but must be slightly modified to compensate for the fact that y was not drawn from the search space with uniform probability. That is, the history of the search im-poses a bias onto the search space. To see this, we consider the fact that the node values, "t. and nR depend on two factors, the occurrence of low energy values in leaves (the history of
Performance
3 Performance
Following an original suggestion of Kirkpatrick et.al., [19] to cool more slowly when the specific heat is high, sen. Finally, in Eq. (2.3) we divide by Vy.' the hypervolume of the leaf con-taining y to ensure thatg represents a
proper probability density. In [5], we show that the Gibbs distribution is 'l stationary state of the algorithm wi \ the modification of Equation 2.
~-
-~--:
I
I
/
Fi?"ure 3
Results of fitting a damped exponential. Dataisthe dotted line, Fit is the ;id line.
o -)(-500 28.03-y-40.17
Our e;·T~ ienr in attempting to find the pa.~metersof thefit shown in Fig-ure 3 are interesting. We repeat equa-tion(1.1) here for reference:
dS
c,' r =1 we use T f - rT, where
and d.Sis a small positive constant. C;
is a term easily related to the vari-ance of the energy. This form for r is one of a family of similar schedules which have been reported in the litera-turejl.], and differs only in the power to which Cvis raised
2.3 Anne« Ung schedule
In this section, we provide exam-ples of application of this new method for fitting data.
3.1 An asymptotic exponent.al
Figure 3 iflustrates ' the result of using tree annealing to find the pa-ram. ~ of an exponential fitby using tree ling.
L[(Yi- (a +beCX;)]2 i
This expression represents the squared error resulting from fitting a data set with an exponential which saturates at a non-zero asymptote. Straightforward attempts to produce a linear system of equations by taking logarithms fail, due to the additive constant a; and tho minimization is therefore unsolvable analytically.
Applying simple gradient descent failed miserably, since the step size re-quired for c is radically different from the appropririte step for a and b.
~Tse of second den"f.T8.ti ves to determine
Le correct step ... .:e required 1 fair
re-Performance
sult in a descent algorithm which would work if started in the proper place. We were eventually able to de-termine that the error function was convex (had only one minimum), but suffered from the plateau problem dis-cussed in section 1.1, so that if we started the descent at a large «-.5) negative value of c, our algorithm never moved, since all derivatives
. ',If \vere essentially zero. r~
This process required about two days of effort. We then typed
the
prob-lem description into INTEROPT,(de-scribed in the next section) and TA found the solution within about 30 sec-onds.
3.2 Response curves
Atkinson[2] has described the use-fulness of equations of the general
form V = r(JP - ~)1O-cp (3.1)
.where r and a are parameters which must often be determined by data fit-ting.
The expression presented [2, Eq. 17J relating subjective magnitude of taste to concentration is of this gen-eral form, but with the offset term set to zero:
S = mil lO-cw (3.2)
where a is normally == 1.33. Al-though means-squared error fits of equations of the form of Eq. 3.1 are not generally solvable by linear tech-niques, the more specific from of Eq. 3.2
is
solvable using linear methods, sim-ply by taking the log10 of both sides. However, we did not use this strategy. Instead, simply typed in the datapro-8
vided in Atkinson's paper, and the ex-pression of Eq. 3.2, and again found the optimum immediately. Interest-ingly, we found a better fit at
ex
=
1.6 than at the published 1.33. Then, as an added interesting experiment, we re-introduced the offset term, putting Eq. 3.2in the general form ofEq. 3.1,-cW
S = r(»P +wg)lO (3.3)
and estimated all four parameters.
Figure 4 shows the results (compare with Fig 8 in [2], except that we plot S vs. W linearly rather than log-log.)
I
,
,
Figure 4.
Data from [2] and result of fittingw,c,and a using TA.
.Interestingly, by abandoning the need for linear methods, and allowing the
Woterm, we find that the optimal esti-mate for a is now 1.39, much closer to the predicted 1.33, but that W
o is a
4
Interactive Optimization
Interactive Optimization
6 References
As we used TA, and as our col-leagues began to use it to solve their problems, it rapidly became apparent that a user-friendly interface to the optimization algorithm was needed. Consequently, one of the authors of this paper wrote a program called
INTEROPT, which provides this
inter-face. The user is asked to define his/her problem in a convenient, natural-language manner. INTEROPT
then takes the problem definition,
writes a program, compiles that pro-gram, and performs the optimization. In most instances, INTEROPT is able to solve general-purpose problems, without needing any manual interven-tion (such as parameter adjustments) at all. Most of the problems described in the previous section, diverse as they are, were solved with the same soft-ware. An example INTEROPT dia-logue is presented in Figure 5.
5
Conclusion
In this paper, we have introduced a new technique for solving nonlinear optimization problems-- in particular, those problems which have multiple minima: Tree Annealing. TA cannot (at this time) handle more than about 30 variables. Even with this restric-tion, TA seems to be a very exciting method, since NO analysis needs to be done to solve a large class of problems.
With INTEROPT the user simply
types in the function to be minimized, and the domain of the val~ables, and the program does the rest.
1. E.H.L. Aarts and P.J.M. van Laarhoven.
Simulated Annealing: Theory and Appli-cations D. Reidel Publishing Company, Dordrecht, Holland, 1987.
2. Atkinson, William H., 1982, "A Gen-eral Equation for Sensory Magni-tude" ,Perception and Psychophysics, vol. 31(1), pp. 26-40.
3. V. Badami, N. Corby, N. Irwin, and K. Overton, "Dsing range data for inspecting printed wiring boards".In Proc. IEEE Int. Conf. on Robotics and Automation, Phila-delphia, April, 1988.
4. H. Baker and T. Binford "A system for automated stereo mapping". In Proc.
Im-age Understanding Workshop pp. 215-222 Sciences Applications, Inc. 1982.
5. G. Bilbro "A Metropolis Procedure with Asymmetric Neighborhoods" Technical report TR- Center for Communications and Signal Processing, North Carolina State University, Raleigh, 1990.
6. G. Bilbro, M. Steer, R. Trew, and S. Sk-aggs. "Parameter extraction of microwave transistors using tree annealing",
IEEE/Cornell Conf. Digest, August,
1989.
7. C. Chow and T. Kanako "Automatic boundary detection of the left ventricle from cineangiograms" Computers in
Bio-medical Research, 5:388-409, 1972.
8. G. Dahlquist and A. Bjorck Numerical
Methods, Prentice-Hall, Englewood Cliffs, NJ 1974.
References
10.0. Faugeras et. ale "Towards a flexible vision system", In Robot Vision A. Pugh, ed., pp. 129-142. IFS, UK 1982.
11.0. Faugeras and M. Herbert "The repre-sentation, recognition, and locating of 3-D objects", International Journal of Ro-botics Research, 5(3), Fall, 1986.
12.Greenlee, Mark W. and Magnus-sen, Svein, 1987, "Saturation of the Tilt Aftereffect", Vision Research,
vol. 27, no. 6, pp. 1041-1043.
13.W. Grimson From Images to
Sur-faces: A Computational Study of the Human Early Vision System ". MIT
Press, Cambridge, 1982.
14.Y. Han, W. Snyder, and G. Bilbro, "De-termination of optimal pose using tree an-nealing", In Proc. IEEE Int. Conf. on Ro-botics and Automation, Cincinnati, May,
1990.
15.M. Hollins, A. Goble, B. Whitsel,
and M. Tommerdahl, "Time course and action spectrum of vibrotactile adaptation", Somatosensory and Motor Research, In review
10
16.R. Jarvis "A mobile robot for computer vision research". In Proc. Third Austra-lian Compo Sci. Conf., AustraAustra-lian Nat. Univ. Canberra, ACT, 1980.
17.R. Jarvis, "A laser time-of-flight range scanner for robotic vision", TR TR-CS-81-10, Camp. Sci. dept., Australian Nat. Univ. Canberra, 1981.
18.Kalos, M.H. and P. A. Whitlock, Monte Carlo Methods, Volume 1: Basics, Wiley and Sons, New York, 1986.
19.5. Kirkpatrick, C. Gelatt, and M. Vecchi, "Optimization by simulated annealing", Science, 220(4598):671-680, May 1983.
20.R. Lewis and A. Johnston, "A scanning laser rangefinder for a robotic vehicle. In
Proc 5th Int. Joint Conf Artificial Intelli-gence 1977.
21.Magnussen, Svein and Johnson, Tore, "Temporal Aspects of Spatial Adaptation: A Study of the Tilt Aftereffect", Vision Research, vol. 26, no. 4, pp. 661-672.1986.
22.D. Marr and T. Poggio. "A computational theory of human stereo vision",. In Proc. Royal Society ofLondon. (204), 1979.
23.Metropolis, N., A. Rosenbluth, M. Ro-senbluth, A. Teller and E. Teller, "Equa-tion of State Calcula"Equa-tions by Fast Com-puting Machines," J. of Chern. Physics, 21 (1953) 1087-1092.}
24.U. Mishra, A. Brown, and S. Rosenbaum, "DC and RF performance of 0.1u gate length AI.4SIn.S2As - Ga.3SIn. 62As pseu-domorphic hemts" IEDM Technical Di-gestDecember, 1988.
25.H. Nishihara "Prism: A practical real-time imaging stereo system". In Proc. of
References
26.D. Nitzan, A. Brain, and R. Duda,"The measurement and use of registered reflec-tance and range data in scene analysis."
Poe. IEEE 65,:206-220, Feb. 1977.
27.Y. Ohta and T. Kanade, "Stereo by intra-and interscanline search using dynamic
programming" TR CMU-CS-83-162,
Carnegie MellonU. Pittsburgh, 1983.
28.M. Oshima and Y. Shirai "Object recog-nition using 3-D information", IEEE
PAMI, PAMI-5(4):353-361, 1983.
29.R. Paul. Robotic Manipulators, Mathe-matics, Programming and Control MIT
Press, Cambridge, Mass. 1981.
30.M. Peleg and O. Campanella, "On the Mathematical form of psychophysical relationships with special focus on the perception of mechanical properties of solid ob-jects", Perception and Psychophysics, vol 44, no 5, 1988.
31. R. Scobey and C. Johnson,
"Psyophysical properties of displace-ment thresholds for moving tar-gets", Acta Psychologica vol 48,
1981
32.W. Snyder Industrial Robots, Computer Interfacing and Control" Prentice-Hall,
1984.
33. W. Snyder, G. Bilbro, A. Logenthiran, and S. Rajala "Optimal Thresholding-- a New Approach" Pattern Recognition Let-ters In review.
34.B. Spain Analytic Quadrics. Pergamon
Press, 1960.
35.Y. Tsuchiya, E. Inuzuka, Y. Suzui, and W. Yu. "Ultrafast streak camera", In
Proc. 13th Int. Congr. High Speed
Photo-graph and Photonics", Tokyo, Japan,
Au-gust 1978.
36. D. Vanderbilt and G. Louie, itA Monte Carlo Simulated Annealing Approach to
Optimization over Continuous
Vari-ables", J Comput. Phys. 36(1984)259-271.
-
References
%interopt
Do you want to optimize a function?no
Well then, would you like to fit some data?yes How many parameters does the fit have?3
How many variables does the fit have?l How many outputs does the fit have?l Data file name?demos/datal
How many data points are in that file?9
Now I need to know the parameters over which I should minimize What is the name of parameter number O?a
What is the name of parameter number l?b What is the name of parameter number 2?c
Now, I need to know the names of the variables
DONT USE y!
What is the name of variable number 0 x
Enter the function to be fit
use the form y[i] = f(x), with a different y[i] for each output y[O] = a + b * exp ( c *-x)
I'm now compiling your function. Please wait I'm now compiling the main program. Please wait
OK. We got that far. Now,_ tell me the max and min values on each variable What is the lower limit of a?20
What is the upper limit of a?50
What is the hat is the lower limit of b?-20 What is the upper limit of b?20
hat is the lower limit of c?-l What is the upper limit of c?O
I am now running your optimization:
Figure 5
Example application ofINTER OPT. A dialogueinwhich the user defines a problem of fitting the sum of two sine waves.
![Figure 4 shows the results (comparewith Fig 8 in [2], except that we plot S](https://thumb-us.123doks.com/thumbv2/123dok_us/1332954.1166263/9.558.305.523.266.516/figure-shows-results-comparewith-fig-plot-s.webp)
