Estimation of Student Performance Using
Artificial Intelligence with LMS Strategies
C.Palanichamy, Dr. R.Kavitha, V.Podhum Ponnu,
Assistant Professor, Department of Computer Science and Engineering, Chenduran College of Engineering and Technology, Lena Vilaku, Pilivalam (po), Pudukkottai, Tamilnadu, India
Professor, Department of Computer Science and Engineering, Velammal College of Engineering and Technology, Madurai to Rameshwaram High Road, Viraganoor, Madurai, Tamilnadu, India
M.E. Computer Science and Engineering, Department of Computer Science and Engineering, Chenduran College of Engineering and Technology, Lena Vilaku, Pilivalam (po), Pudukkottai, Tamilnadu, India
ABSTRACT: The objective of this system is to estimate the student's understanding level of a topic. The main purpose of this system is to improve the usage of artificial intelligence techniques using scoring algorithm for calculating the percentage of attentiveness of each students resides inside the particular class. The major perspective of this system is to improve the usage of artificial intelligence techniques using scoring algorithm for calculating the percentage of attentiveness of each students resides inside the particular class. The estimation of student’s understanding of the topic is assessed by analyzing the curve of the graph generated by this tool. One of the common tools to evaluate student’s performance is the course evaluation questionnaire to evaluate based on students’ perception. Their performances are compared over a regular updations composed of responses of students to a real course evaluation questionnaire using accuracy, precision, recall, and specificity performance metrics. Furthermore, the analysis shows that the instructors’ success based on the students’ perception mainly depends on the interest of the students in the course. The findings of the approach indicate the effectiveness and expressiveness of data mining models in course evaluation and higher education mining and moreover, these findings may be used to improve measurement instruments.
KEYWORDS: Learning Analytics, Learning Management Systems, Portability, Predictive Modeling, Student Performance
I. INTRODUCTION
he emergence of information and communications technologies (ICT) into higher education has significantly changed the way in which teachers teach and students learn. Using the internet to provide content has opened up the possibility to transform face-to-face courses into courses in which a significant amount of (blended courses) or all information (online courses) is delivered and accessible online. A vast majority of institutions use the internet in teaching, often through Learning Management Systems (LMSs), also known as Virtual Learning Environments (VLEs). LMSs can support student learning by providing content online, and by allowing for additional components such as quizzes, presentations and screencasts, assignments, and forums. Additionally, LMSs allow teachers to provide and manage
This paragraph illustrates the details of authors and copyright owners who owned this paper and having rights for the implementation mentioned in paper.
C.Palanichamy, Assistant Professor, Department of Computer Science and Engineering, Chenduran College of Engineering and Technology, Lena Vilaku, Pilivalam (po), Pudukkottai-622507.
Dr. R.Kavitha, Professor, Department of Computer Science and Engineering, Velammal College of Engineering and Technology, Madurai to Rameshwaram High Road, Viraganoor, Madurai, Tamil Nadu 625009.
V.Podhum Ponnu, M.E. Computer Science and Engineering, Department of Computer Science and Engineering, Chenduran College of Engineering and Technology, Lena Vilaku, Pilivalam (po), Pudukkottai-622507.
be gained into students’ online behavior, which in turn can be used to improve learning and teaching. The analysis of LMS data is often referred to as learning analytics, defined as “the measurement, collection, analysis and reporting of data about learners and their context, for purposes of understanding and optimizing learning and the environments in which it occurs”. Much research in the field of learning analytics has used LMS data for predictive modeling of student performance to predict students’ grades and to predict which students are at risk of failing a course.
This is an important step in learning analytics, as it informs the implementation of interventions, such as personalized feedback. Studies predicting student success in offline education have typically collected measurements using validated questionnaires, interviews, and observational techniques, with relevant theoretical concepts in mind so that the measurement can be geared towards the concepts that the researcher thinks need to be measured. The use of LMSs allows for tracing and analyzing students’ online behavior without the necessity of time-consuming data-collection. However, LMSs provide raw log data that are not concrete measurements of previously outlined theoretical concepts. It is therefore important to understand whether and how these data can be used for learning analytics. Recent studies show a wide variety in the analytical usage of LMS data: different kinds of analytical methods and predictors are used, often without explicit mention of the theoretical argumentation behind them. Moreover, many studies analyze LMS data of one or a few institutions, for one or only a few courses, or describe special cases (e.g., courss using tailor-made e-tutorial packages). This makes it hard to compare the different studies and draw general conclusions about the ways in which to use LMS data for predictive modeling. Moreover, the question is whether there actually is a single best way to predict student performance across a diverse set of courses. Studies that have used similar methods and predictors have nonetheless found different results in the correlational analyses and prediction models.
Fig.1 Decision Tree Diagram
Furthermore, the portability of the prediction models across the 17 courses, i.e., the effect of course, is analyzed. For
this we replicate the study of Gašević et al. within another institution with a larger sample of more similar courses. Moreover, to ensure comparability of findings, we only use predictors that are available for all courses. In addition, we analyze whether it is possible to identify students at-risk early on in a course, and to what extent these models can be used to generate targeted interventions. This system is to estimate the student's understanding ability about a topic. The purpose of this system is to efficiently utilize the usage of artificial intelligence techniques using scoring algorithm for calculating the percentage of attentiveness of each students within the particular class.
The estimation of student’s attentiveness is analyzed by the curve generated in the form of graph. In this system Microsoft visual studio2010 is used as the front end and SQL Server 2008 is used as the back end tool. SQL Data Reader is used to read the data from back to front end. Input is entered in the text format separately for student and staff, the chapters understood by the student is compared with the topics covered by the respective staff and the output is displayed in the form of graph as the result of the percentage calculated by scoring algorithm. The graph displayed in the output screen clearly represents the attentiveness of each student in their respective subjects. This will help the staffs to help the students lagging in their respective subjects (i.e.) understanding of the particular topic.
The objective of this project is as follows:
(a) With the help of this scoring algorithm, student’s psychology is studied.
(b) Instructor can easily analyze the students understanding capability of the subject.
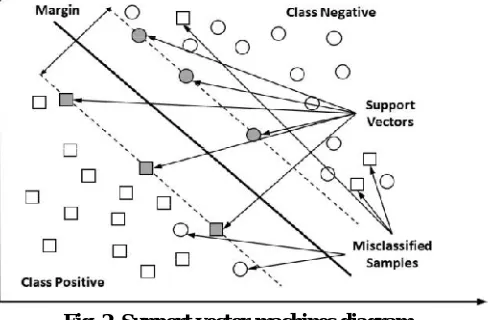
Fig. 2. Support vector machines diagram
Today, one of the biggest challenges of higher education institutions is the proliferation of data and how to use them to improve quality of academic programs and services and the managerial decisions. A variety of “formal and informal” procedures based on “qualitative and quantitative” methods is used by higher education institutions to solve problems, which keep them away from achieving their quality objectives. However, methods used in higher education for quality purposes are mainly based on predefined queries and charts to analyze the data. In addition, these methods lack the ability to reveal useful hidden information. Hidden information in large datasets is best analyzed with data mining techniques.
II. SYSTEMIMPLEMENTATION
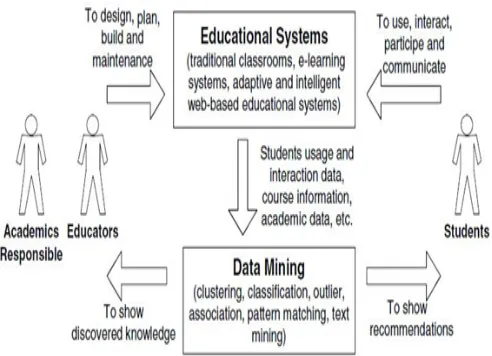
A. Educational Data Mining Portal
allocate resources and staff more effectively, make better decisions on educational activities to improve students’ success, increase students’ learning outcome, increase student’s retention rate, decrease students’ drop-out rate, and reduce the cost of system processes.
Fig. 3.Proposed System Architecture
B. Instructor Performance Evaluation
The most widely applied tool to evaluate the instructors’ performance in a course is through surveying students’ responses about the course and its instructor through a questionnaire. Since 1920’s, when student evaluations of instructor performance were first introduced to higher education systems, there has been an ongoing debate on the reliability and validity of these evaluations. The concern about student evaluations is based mainly on 1) students not having enough experience and maturity to evaluate the course and the instructor, 2) students’ evaluations being affected by popularity of the course and/or instructor, grades given by the instructor and course being compulsory or elective.
C. Decision Tree Approach
A decision tree algorithm aims to recursively split the observations into mutually exclusive subgroups until there is no further split that makes a difference in terms of statistical or impurity measures. Among the impurity measures that are used to find the homogeneity of instances in a node of the tree, Information Gain, Gain Ratio, and Gini Index are the most well-known ones. Usually, Information Gain is used in Iterative Dichotomiser (ID3), Gain Ratio in C4.5 and C5.0 (the successors of ID3) whereas Gini Index is used in Classification and Regression Trees (CART).
D. Classification Replica
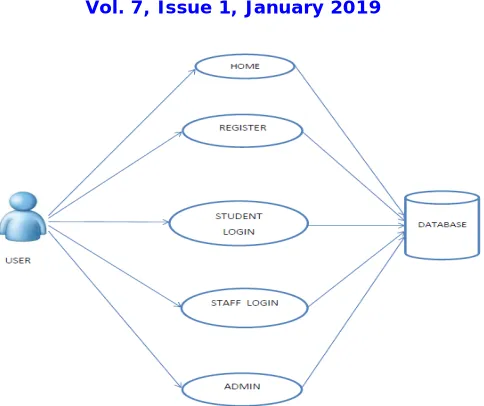
Fig. 4.Proposed System Usecase Diagram
III. LITERATURE SURVEY
A blended learning approach to course design and implementation - N. Hoic-Bozic, V. Mornar, I. Boticki – 2009 [1] Blended learning has become an increasingly popular form of e-learning, and is particularly suitable to the process of transitioning towards e-learning from traditional forms of learning and teaching. This paper describes the use of the blended e-learning model, which is based on a mixture of collaborative learning, problem-based learning (PBL) and independent learning, in a course ldquoTeaching Methods in Information Science,rdquo given at the University of Rijeka, Rijeka, Croatia.
This model is realized as a combination of a face-to-face environment and online learning, using a proprietary learning management system (LMS) named adaptive hypermedia courseware (AHyCo). AHyCo is based on adaptive hypermedia and in addition to supporting learning and testing, introduces completely new constructivist and cognitivist elements to education. By supporting collaborative and project-oriented activities AHyCo promotes students' motivation for learning and establishes learning as an active and interactive process. This paper describes both the technology for, and the methodological approach to, course design and development which is aimed at supporting the evolution from traditional teaching to active learning, and raising interest in the topics of e-learning and Web courseware development among IT students. A survey conducted in the end of the course showed that students were satisfied with the pedagogical approach, and their academic achievements were also better than expected. Particularly important is that the dropout rate was greatly diminished, which could be related to students' satisfaction with the support they received from the instructor and the system.
Towards networked learning analytics–A concept and a tool - S. Retalis, A. Papasalouros, Y. Psaromiligkos, S. Siscos, T. Kargidis – 2006 [2] Networked learning is much more ambitious than previous approaches of ICT-support in education. It is therefore more difficult to evaluate the effectiveness and efficiency of the networked learning activities. Evaluation of learners’ interactions in networked learning environments is a difficult, resource and expertise demanding task. Educators participating in online learning environments, have very little support by integrated tools to evaluate students’ activities and identify learners.
and alternatives in the domain taking into consideration the differences existing between cultures, countries, and ultimately between HEOs.
Learning analytics and educational data mining: Towards communication and collaboration - G. Siemens, R. S. Baker – 2012 [4] Growing interest in data and analytics in education, teaching, and learning raises the priority for increased, high-quality research into the models, methods, technologies, and impact of analytics. Two research communities -- Educational Data Mining (EDM) and Learning Analytics and Knowledge (LAK) have developed separately to address this need. This paper argues for increased and formal communication and collaboration between these communities in order to share research, methods, and tools for data mining and analysis in the service of developing both LAK and EDM fields.
Announcing open course: Learning and knowledge analytics - P. Long, G. Siemens, G. Conole, D. Gasevic – 2011 [5]. After about a year of planning, we can finally announce the following courses on edX focusing on learning analytics. The intent of these courses is to eventually lead into a MicroMasters and then advance placement in an in-development Masters of Science in Learning Analytics at UTA. Each course runs about three weeks and we’ve tried to settle on prominent analytics tools for educational data so the experience is one where skills can immediately be applied. We have exceptional instructors – world leaders in the field. We are, however, well aware of the gender imbalance. We had five faculty (women) who ended up dropping out due to existing commitments. If you’d like to help right this imbalance, email me and let me know courses or topics that you’d like to instruct in the LA domain.
Educational data mining: A review of the state of the art - C. Romero, S. Ventura – 2010 [6]. Educational data mining (EDM) is an emerging interdisciplinary research area that deals with the development of methods to explore data originating in an educational context. EDM uses computational approaches to analyze educational data in order to study educational questions. This paper surveys the most relevant studies carried out in this field to date. First, it introduces EDM and describes the different groups of user, types of educational environments, and the data they provide. It then goes on to list the most typical/common tasks in the educational environment that have been resolved through data-mining techniques, and finally, some of the most promising future lines of research are discussed.
IV. SYSTEMANALYSIS
A. Existing System
One of the common problems in higher education is the evaluation of student's performances in a course. The most widely applied tool to evaluate the student's performance in a course is through surveying students’ responses about the course and its instructor through a questionnaire. Since 1920’s, when student evaluations of instructor performance were first introduced to higher education systems, there has been an ongoing debate on the reliability and validity of these evaluations. The concern about student evaluations is based mainly on (a) students not having enough experience and maturity to evaluate the course and the instructor and ()b) students’ evaluations being affected by popularity of the course and/or instructor, grades given by the instructor and course being compulsory or elective. Educational mining concepts are critical now-a-days to solve or polarate the issues in mining activities, so it is very tough enough to analyze the student performance via their feedback. So a new system is required to provide solutions for these issues.
DISADVANTAGES OF EXISTING SYSTEM
(a) Prediction is purely based on probabilistic basis, so the user cannot expect more accuracy over result. (b) Time taken process for evaluation
B. Proposed System
The estimation of student’s understanding of the topic is assessed by analyzing the curve of the graph generated by this tool. SQL Data Reader is used to read the data from back to front end. Input is entered in the text format separately for student and staff, the chapters understood by the student is compared with the topics covered by the respective staff and the output is displayed in the form of graph as the result of the percentage calculated by scoring algorithm. Any instructor can view the student’s performance using the user id and login password by entering it in the Administrator channel. Then select analyze performance option in order to choose the student whose performance is to be analyzed. The output is displayed in the form of graphs one represents the topic covered by the instructor and the other represents the topic understood by the student. In particular, when arrival processes are modulated by independent Markov processes, we show that average delay grows at most logarithmically in the number of nodes in the network. Existing work provides explicitly computable and order-optimal delay bounds for time-correlated arrivals. Our work addresses the issues of general interference constraints and time-correlated heavy traffic simultaneously. We treat the general interference model use the concept of queue grouping to derive the order-optimal delay results. Queue grouping techniques have been used in to reduce scheduling complexity in switches and wireless networks.
ADVANTAGES OF PROPOSED SYSTEM
(a) Prediction is purely based on comparative results of two different and powerful algorithms, so the user can expect more accuracy over results compare to previous methodologies.
(b) Time Consumption is less and processing speed is high. (c) Performance is comparatively increased.
V. RESULTSANDDISCUSSION
In this section, we provided the simulated results of entire project with its practical proofs. The following figure shows the Home Page of the Proposed System.
Fig.5 Home Page
Fig.6 Registration Page
The following figure illustrates the Administrator Authentication View of the proposed system.
Fig.7 Administrator Authentication
The following figure illustrates the Staff Details View of the proposed system.
VI. CONCLUSIONANDFUTURESCOPE
In this system, data mining is utilized to analyze course evaluation questionnaires and here, the most important variables that separate “satisfactory” and “not satisfactory” instructor performances based on students’ perception are found. Hopefully, these can help students to improve their performances and irrelevant variables that do not differentiate “satisfactory” and “not satisfactory” student performances are also listed. Different dimensions of course and instructor effectiveness are measured with course evaluation questionnaires in higher education institutions and these findings may be used to improve measurement instruments. As a result, the contributions of this system is to the literature can be summarized as follows: firstly, effectiveness and expressiveness of data mining techniques, specifically decision tree algorithms, boosting, and learning management in higher educational mining are presented over a dataset from the daily life. Secondly, using the findings of the variable importance analysis for the classifiers, it is shown that there are many possible improvement areas in the design of the measurement instruments used in student's performance evaluation.
In future, the proposed work is further extended by means of some intensive algorithms such as Deep Learning and has a plan to improve the accuracy range higher than the proposed system.
REFERENCES
[1] A. M. Abaidullah, N. Ahmed, and E. Ali, “Identifying hidden patterns in students’ feedback through cluster analysis,” International Journal of Computer Theory and Engineering, vol. 7, no. 1, pp. 16-20, 2015.
[2] N. Delavari, S. Phon-Amnuaisuk, and M. R. Beikzadeh, “Data mining application in higher learning institutions,” Informatics in Education, vol. 7, no 1, pp. 31-54, 2007.
[3] M. Goyal, and R. Vohra, “Applications of data mining in higher education,” International Journal of Computer Science Issue, vol. 9, no. 2, 113-120, 2012.
[4] J. Luan, Data Mining and Its Applications in Higher Education in New Directions for Institutional Research, no. 113, Wiley Periodicals, Inc., 2002.
[5] J. Han, M. Kamber, and J. Pei, Data mining concepts and techniques, Waltham, MA: Morgan Kaufmann Publishers, 2012.
[6] J. Luan, “Data mining and knowledge management in higher education – potential applications,” In Proceedings of AIR Forum, Toronto, Canada, 2002.
[7] M. B. Behrouz, D. A. Kashy, G. Kortemeyer, and W. Punch. “Predicting student performance: an application of data mining methods with an educational web-based system,” In Frontiers in education, 2003. FIE 2003 33rd annual, IEEE, vol. 1, pp. T2A-13, 2003.
[8] V. Kumar, and A. Chadha, “An empirical study of the applications of data mining techniques in higher education,” International Journal of Advanced Computer Science and Applications, vol. 2, no. 3, 80-84, 2011.
[9] C. Romero, and S. Ventura, “Educational data mining: A survey from 1995 to 2005,” Expert Systems with Applications, vol. 33, pp. 135-146, 2007.
[10] B. K. Baradwaj, and S. Pal, “Mining Educational Data to Analyze Students’ Performance,” International Journal of Advanced Computer Science and Applications, vol. 2, no. 6, pp. 63-69, 2011.
[11] S. Calkins, and M. Micari, “Less-than-perfect judges: evaluating student evaluations,” The NEA Higher Education Journal, pp. 7-22, Fall, 2010. [12] J. Sojka, A.K. Gupta, D.R. Deeter-Schmelz, “Student and faculty perceptions of student evaluations of teaching: a study of similarities and differences,” College Teaching, vol. 20. No. 2, pp. 44-49, 2002.
[13] L. Coburn, Student Evaluation of Teacher Performance, ERIC/TME Update Series, 1984 [Online]. Available: http://ericae.net/edo/ED289887.htm.
[14] S.A. Radmacher, and D.J. Martin, “Identifying significant predictors of student evaluations of faculty through hierarchical regression analysis,” Journal of Psychology, vol.135, no. 3, pp. 259-269, 2001.
[15] S.M. Hobson, and D.M. Talbot, “Understanding Student Evaluations,” College Teaching, vol.49, no. 1, pp. 26-32, 2001. [16] A. Papoulis, Probability Random Variables. New York, NY, USA: McGraw Hill, 1965.
[17] M. Simon M, “On the probability density function of squared envelope of sum of random phase vectors,” IEEE Trans. Commun., vol. TC-33, no. 9, pp. 993–996, Sep. 1985.
[18] Joseph D. Novak, and Alberto j. Canas. “The theory underlying concept maps and how to construct and use them,” Inst. Human Mach. Cognition, Pensacola Fl, USA, Tech. Rep. IHMC Cmap Tools 2006-01 Rev 01-2008, 2006.
[19] H. Funaoi, E. Yamaguchi, and S. Inagaki, “ Collaborative concept mapping software to reconstruct learning processes,” Comput. Edu., vol. 1, pp. 306–310, 2002.
[20] N. Derbensteva, F. Safayeni, and A. J. Canas, “Experiments on the effect of map structure and concept quantification during concept map construction,” presented at the 1st Int. Conf. Concept Mapping, Pamplona, Spain, 2004.
[21] V. P. Gurupur and R. S. Sadasivam, “Representing process s concepts: Towards reducing semantic gap,” in Proc. 12th SDPS Transdisciplinary Conf. Workshop Integrated Syst., Des. Process Sci., 2009, pp. 173–180.
[22] D. J. Novak and D. B. Gowin, Learning How to Learn. New York, NY, USA: Cambridge Univ. Press, 1984.
5096–5099.
[26] T. Goldsmith, P. Johnson, and W. Action, “Assessing structural knowledge,” J. Educ. Psychol., vol. 83, pp. 88–96, 1991.
[27] C. C. Liu, P. H. Don, and C. M. Tsai, “Assessment bases on linkage patterns in concept maps,” J. Inf. Sci. Eng.. vol. 21, pp. 873–890, 2005. [28] Y. Zhongyum, “Optimization model of credit asset portfolio based on z-score,” in Proc. Int. Conf. Manage. Sci. Ind. Eng., Jan. 2011, pp. 112– 115.