ABSTRACT
FELTNER, DAVID TRAVIS. Effect of Interface Design on User Performance and
Cognitive Workload in Unmanned Aerial Vehicle Control Tasks. (Under the direction of Dr. David B. Kaber).
Unmanned Aerial Vehicles (UAVs) are becoming more prevalent in civilian and
military applications, from delivering online shopping parcels to executing top-secret
missions. Given their broad scope of application, UAVs present a unique set of human
factors issues and considerations different than those applied to conventional manned flight
systems. Interface control screens are complex, and convey a significant amount of important
information to pilots. However, the human pilot has finite cognitive capabilities to process
this information and display formats.
Piloting an UAV is a difficult task and can cause a significant workload, but a
properly designed interface can moderate this workload and potentially improve
performance. Researchers and designers need to evaluate and develop control interfaces that
minimize operator workload, improve performance, and promote safe airspace. The present
research evaluated an objective UAV interface evaluation tool for addressing the identified
design need. Using the Modified Ergonomic Guideline for Supervisory Control Interface
Design – Unmanned Aerial Vehicles (M-GEDIS-UAV), “baseline” and “enhanced” UAV
control interfaces were prototyped and evaluated in experimental trials. Each of the interfaces
yielded different M-GEDIS-UAV scores and were expected to produce different workload
and performance outcomes.
Twenty-four participants took part in the experiment to determine the performance
speed levels (Fast and Slow) served as a within-subject factor. Exposure to the speed conditions
was replicated to assess within-subject performance variability. The Enhanced Interface was
created with optimal conformance to human factors and UAV domain specific standards
while the Baseline Interface mimicked current commercial UAV interfaces. Each participant
performed two slow and two fast scenarios with their assigned interface. A subjective
workload rating was completed after each trial using the NASA-TLX (Task Load index).
Objective response measures included accuracy and completion time for determining
distance between objects in the airspace environment, fixing alarms, and identifying flight
parameter deviations.
Results revealed interface type to be significant for all time measurements with the
Enhanced Interface yielding faster completion times. Interface type was also significant for
the Distance and Coordinate estimation tasks, but was negligible in alarm fixes. Interface
type was not significant in workload, and speed was not significant for any Dependent
Variable (DV). There was also a consistent trial number effect across multiple DVs,
indicating a learning effect for participants throughout the experiment (despite extensive
advance training).
These findings indicate that the M-GEDIS-UAV is sensitive to UAV control interface
feature manipulations. The findings also indicate that the M-GEDIS-UAV can be used as a
tool for selecting among interfaces to identify an alternative imposing lower cognitive
workload. This finding was anecdotally supported by participant comments on interface
usability but is confounded by the fact that neither interface was more robust across vehicle
Overall, it was concluded that performance increased in use of the Enhanced
Interface, which the M-GEDIS-UAV predicted by assigning it a higher evaluation score. The
M-GEDIS-UAV tool shows promise for UAV interface workload prediction and additional
research should be conducted to assess the tool with additional workload measures on expert
© Copyright 2017 David Travis Feltner
Effect of Interface Design on User Performance and Cognitive Workload in Unmanned Aerial Vehicle Control Tasks
by
David Travis Feltner
A thesis submitted to the Graduate Faculty of North Carolina State University
in partial fulfillment of the requirements for the degree of
Master of Science
Industrial Engineering
Raleigh, North Carolina
2017
APPROVED BY:
_______________________________ David B. Kaber, PhD
Committee Chair
_______________________________ _______________________________
Nancy Currie, PhD Anne McLaughlin, PhD
DEDICATION
I would like to take the time to dedicate this work to my Family, Friends, and fellow
Soldiers whom all have supported me in different ways. To my Mom and Dad, thank you for
instilling me the work ethic and drive I leaned on so often. Specifically, I would like to
dedicate this work to Lisa, the love of my life, and my two little boys, Ryan and Josh, whom
never fail to bring a smile to my face. I strive to set an example of lifelong learning,
BIOGRAPHY
David Feltner was born in Bamberg, SC on October 11, 1986. He grew up in Summerville,
SC then moved to Puyallup, WA when he was ten years old. In 2004, he started his
undergraduate degree at the United States Military Academy at West Point. He graduated
with a Bachelor’s of Science with Honors in Engineering Psychology from West Point in
2008. After graduation, he commissioned as an Infantry Officer with follow on assignments
at Joint Base Lewis-McCord, Fort Benning, and Fort Campbell; during his service, he
deployed in support of Operation Iraqi Freedom and twice in support of Operation Enduring
Freedom / Operation Freedom’s Sentinel. Given the opportunity to serve as a professor at
West Point, he enrolled in the master’s program at North Carolina State University’s Edward
P. Fitts Industrial & Systems Engineering Department with a focus on Human Factors and
Ergonomics. He will graduate with a M.S.I.E. in May 2017 with a follow-on assignment as a
ACKNOWLEDGMENTS
First and foremost, I would like to thank Dr. David Kaber for his guidance and
support on this project and for being an invaluable advisor and mentor – starting from the
application process done while deployed all the way up to the final hours of data collection,
data analysis, and red-inking the final report. I would also like to thank my committee, Dr.
Nancy Currie and Dr. Anne McLaughlin, for taking their time and providing insights to help
me through the thesis process.
I would also like to thank my research partners, Isabel Zhang and James Shirley, for
going well above and beyond any reasonable expectation to rally and help me finish this
tome. To all those up in the Ergonomics Lab, thanks for dealing with my sense of humor and
thanks for all the help as I struggled to reacclimatize back to academia – I never took for
granted how much team work was needed to help me graduate. I would like to thank my
military brothers in arms – Lamar, Tim, and Brandon – whom always came through in the
clutch and acted as a QRF when I needed it most. To my buddies Frankie and Mosby, ya’ll
were always there when I needed you, even if I didn’t feel like it at the time.
Finally, I would like to take a few moments to thank Lisa and our crazy little boys.
You put up with me every day, which makes you a saint, and you even let me buy an old
Jeep so I can make memories with Ryan and Josh working out in the garage. I love you,
babe, and thank you for all that you do and for all that you sacrifice on a daily basis. I won’t
TABLE OF CONTENTS
List of Tables ...x
List of Figures ... xi
List of Abbreviations ... xiii
1. Introduction ...1
UAV State of Art ...1
2. Literature Review ...3
UAV Accident Data...3
Current Human Factors Studies ...7
Mental Workload Measures...15
Existing Interface Evaluation Methods ...18
Usability Testing ...18
Modified Cooper Harper – Unmanned Vehicle Device (MCH-UVD) ...20
GEDIS-UAV ...22
Modified GEDIS-UAV (M-GEDIS-UAV)...24
Selection of Workload Measurements and Interface Evaluation Tool ...30
3. Problem Statement...31
Research Motivation ...31
4. Method ...33
Participants ...33
Independent Variables...34
Scenarios ...34
Task Pacing ...36
Interface Variations ...37
4.2.3.1 Enhanced Interface ...40
4.2.3.2 Baseline Interface...48
Interface Evaluations ...55
Tasks...58
Set-Up and Apparatus ...65
Design of Experiment ...66
Dependent Variables ...68
Sub-Tasks Time and Accuracy / Error...68
4.6.1.1 Coordinate Task ...68
4.6.1.2 Distance Task ...69
4.6.1.3 Fix Alarm Task ...69
4.6.1.4 Prioritize Alarm Task ...69
Subjective Ratings (NASA-TLX) ...70
Procedure ...70
Demographic Questionnaire...70
Training ...71
Experiment ...72
Hypotheses ...73
Data Analysis ...74
5. Results ...76
Coordinate Task Time and Error ...77
Distance Task Time and Error ...79
Fix Alarm Task Time and Accuracy ...80
Prioritize Alarm Task Time and Accuracy ...81
System Parameter Warning Time and Accuracy ...82
NASA-TLX ...83
Predictive M-GEDIS-UAV Scores...84
6. Discussion...86
M-GEDIS-UAV Pedigree ...86
Sub-Task Completion Times ...87
Perceived Workload...90
Event Rate Manipulation ...91
M-GEDIS-UAV Selectivity ...92
Trial Number Effect ...93
7. Conclusion ...94
Applications ...95
Limitations ...95
Future Work ...97
8. References ...100
9. Appendices ...106
Appendix A: Enhanced Interface Mission and Map Sheets ...107
Appendix B: Baseline Interface Mission and Maps Sheets ...109
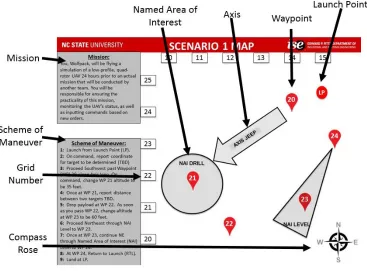
Appendix C: Scenario 1 and Scenario 2 Maps for Enhanced and Baseline Interfaces ...111
Appendix D: Heuristic Evaluation ...112
Appendix E: Mission Query Bank and Justifications ...114
Appendix F: NASA-TLX ...115
Appendix G: Informed Consent ...118
Appendix I: Enhanced Interface Instructions ...122
Appendix J: Baseline Interface Instructions ...135
Appendix K: Scenario Timelines ...147
List of Tables
Table 2.1: Constrained Review of UAV Interface Design Deficiencies...14
Table 2.2: GEDIS-UAV’s Indicators and Sub-Indicators ...23
Table 2.3: M-GEDIS-UAV Color Indicator Score Sheet ...27
Table 2.4: Global M-GEDIS-UAV Score ...28
Table 4.1: Modifications for Enhanced and Baseline Interface Variations ...40
Table 4.2: M-GEDIS-UAV Evaluation Results ...58
Table 4.3: Treatments for Participants ...67
Table 4.4: Example Experiment Procedure ...73
Table 4.5: DOF Breakdown for ANOVA Model...75
Table 5.1: Descriptive Statistics for Dependent Variables by Interface and Speed ..76
Table 5.2: Descriptive Statistics for Dependent Variables by Interface and Speed ..76
Table 5.3: Summary of Statistically Significant Effects ...77
Table 5.4: Predictability of M-GEDIS-UAV Score on Dependent Variables...85
Table 5.5: Predictability of M-GEDIS-UAV Score on Dependent Variables...85
List of Figures
Figure 2.1: Modified Cooper Harper Scale for Unmanned Vehicle Displays ...21
Figure 4.1: Scenario 1 Map for Baseline Interface ...35
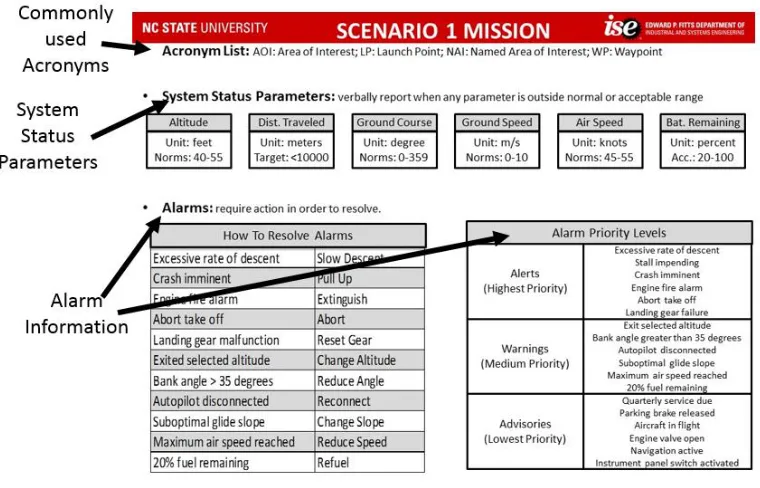
Figure 4.2: Scenario 1 Mission Detail for Baseline Interface ...36
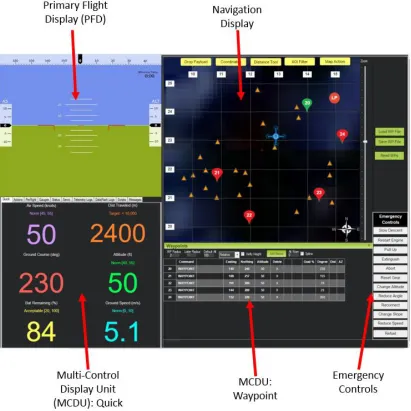
Figure 4.3: Common Interface Components ...38
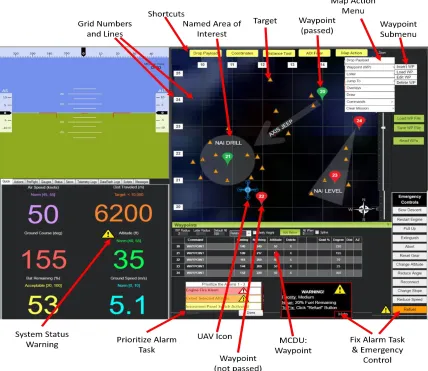
Figure 4.4: Enhanced Interface Features ...41
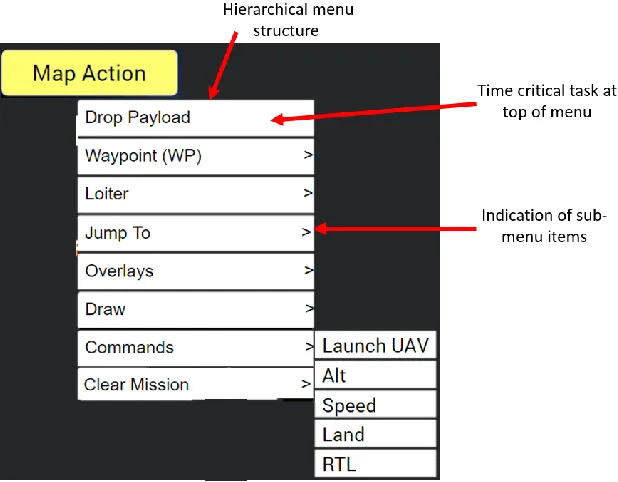
Figure 4.5: Enhanced Interface Map Action Menu ...42
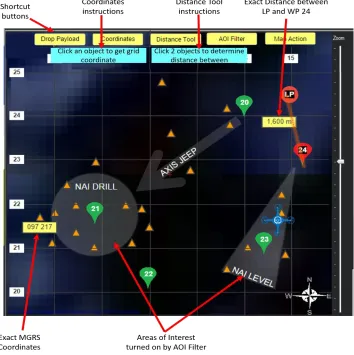
Figure 4.6: Enhanced Interface Navigation Display ...43
Figure 4.7: Primary Flight Display Components ...44
Figure 4.8: Enhanced Interface MCDU Quick Display ...45
Figure 4.9: Enhanced Interface MCDU Actions Tab ...46
Figure 4.10: Enhanced Interface MCDU Waypoints ...47
Figure 4.11: Enhanced Interface Alarms to which users responded ...48
Figure 4.12: Baseline Interface Features ...49
Figure 4.13: Baseline Interface Map Action Menu ...50
Figure 4.14: Baseline Interface Navigation Display...51
Figure 4.15: Baseline Interface MCDU Quick Display ...52
Figure 4.16: Baseline Interface MCDU Actions Tab ...53
Figure 4.17: Baseline Interface MCDU Waypoints ...54
Figure 4.18: Baseline Interface Alarms to which a user responded ...55
Figure 4.19: Heuristic Evaluation Results ...57
Figure 4.21: Coordinate (estimation) Task Performance with Enhanced and Baseline
Interfaces ...61
Figure 4.22: Distance (estimation) Task Performance with Enhanced and Baseline Interfaces ...62
Figure 4.23: Fix Alarm Task with Enhanced and Baseline Interfaces ...63
Figure 4.24: Prioritize Alarm Task Comparison ...64
Figure 4.25: System Parameter Deviation Monitoring with Enhanced and Baseline Interfaces ...65
Figure 4.26: Experiment Setup ...66
Figure 4.27: Coordinate Task Error ...68
Figure 5.1: Mean Coordinate Task Time by Interface ...78
Figure 5.2: Baseline and Enhanced Interface Coordinate Task Deviation by Trial .78 Figure 5.3: Mean Distance Task Time by Interface ...79
Figure 5.4: Mean Distance Deviation % by Interface ...80
Figure 5.5: Mean Fix Alarm Time by Interface ...81
Figure 5.6: Mean Prioritize Alarm Time by Interface ...82
Figure 5.7: Mean Parameter Warning Detection Time by Interface ...83
Figure 5.8: Mean NASA-TLX Workload Rating by Scenario ...84
List of Abbreviations ANOVA Analysis of Variance
AOI Area of Interest
CRD Completely Randomized Design
DV Dependent Variable
DOF Degrees of Freedom
FAA Federal Aviation Administration
ICC Intra-class Correlation Coefficient
IV Independent Variable
LP Launch Point
MCDU Multi-Control Display Unit
MCH UVD Modified Cooper Harper – Unmanned Vehicle Device
M-GEDIS-UAV Modified Ergonomic Guideline for Supervisory Control Interface
Design – Unmanned Aerial Vehicles
NAI Named Area of Interest
NAS National Airspace System
NASA-TLX NASA Task Load Index
NextGen Next Generation Air Transportation System
PFD Primary Flight Display
RCBD Randomized Complete Block Design
SPD Split Plot Design
UAS Unmanned Aircraft Systems
1. Introduction UAV State of the Art
In the 1990s, UAVs became a key component of high-tech military arsenals ranging
from the U.S. and Europe, to Asia and the Middle East. UAVs have played key roles for US
military forces deployed in many countries (Tvaryanas, Thompson, & Constable, 2006).
Currently, military and government agencies represent the major users of UAVs. There is a
large call for the expansion of UAVs into a variety of domestic and commercial operations.
With the potential for increased task efficiency and safety, unoccupied aircraft are growing in
use to support a broad range of operations, including aerial photography, surveying land and
crops, monitoring forest fires and other environmental conditions, and protecting borders and
ports against intruders (Dorr & Duquette, 2010). With these applications in mind, the Federal
Aviation Administration (FAA), along with many private agencies, is extensively
investigating the integration of UASs into the National Airspace System (NAS), with safety
at the forefront of the research. The Next Generation Air Transportation System (NextGen) is
a major FAA initiative combining increased aviation automation with new procedures to
achieve increased economic, safety, and security benefits by 2025 (Prevot, Lee, Smith, &
Palmer, 2005). The NextGen system and the US Army’s UAV System Roadmap 2010-2035
(US Army, 2010) have major implications for UAV operation and, as such, users have high
expectations for UAV usability and mission accomplishment.
UAVs present a unique set of human factors issues and considerations different than
those associated with conventional manned flight (Hobbs, 2010; Kaliardos & Lyall, 2014).
situations and decision making but operators are remote to the technology. Pilots rely
entirely on visual displays to understand the state of the aircraft and the surrounding
environment (Hobbs, Cardoza, & Null, 2015). Display interfaces represent critical
interaction links between the human operator and machine. Supervisory control interfaces
are a key technology for pilots to efficiently control vehicles. Interface screens are complex,
and convey a significant amount of important information to pilots. However, the human
pilot has finite cognitive capabilities to process the information being displayed. These
human-machine systems are only as effective as the pilot’s ability to process the information
being presented at the control interface, despite the cutting edge technology enabling
unmanned aviation. Therefore, it is imperative that UAV interfaces effectively support pilot
information processing and control task performance.
Given the state-of-the-art in UAV technology, several research questions were
formulated as a basis for a literature review. The questions included: (1) What are the current
issues UAV pilots have with supervisory control interfaces? (2) What impact has control
interface design had on UAV operation? (3) What studies have been completed on UAV
interface design features in relation to cognitive workload? (4) What interface evaluation
methods are currently used in UAV domains, and what are the benefits and limitations of
2. Literature Review UAV Accident Data
Although UAV technology is continuously improving, the frequency of system
failures is expected to rise due to increases in system complexity and opportunities for human
and mechanical failures (Booher, 2003). Since 1986, the accident rate for unmanned aircraft
has been significantly higher than for manned aircraft. In the period from 1986-2002, three
types of unmanned aircraft operated by the US Military – Predator, Hunter, and Pioneer –
were lost with accident rates of 32, 55, and 334 per 100,000 hours respectively (Department
of Defense, 2003). This compares unfavorably with the rate for general aviation of
approximately one accident per 100,000 hours. The accident rate for Predators has reduced
significantly since 2002, but remains at about 10 times the general aviation rate (Nullmeyer
& Montijo, 2009).
Williams (2004) reviewed all current information on US Military UAV accidents to
determine to what extent human error contributed to those accidents, and to identify specific
human factors involved in accidents. Personnel from the Safety Centers of the Army, Navy,
and Air Force were contacted and they analyzed UAV operations, including Hunter, Shadow,
Pioneer, Predator, and Global Hawk deployments. Accidents were classified into broad
categories, based on whether the accident was related to human factors or was a failure of an
aircraft component, and then further stratified within human factors issues. Accidents
classified as being human factors-related were broken down into (a) human factors issues of
alerts/alarms, (b) display design, (c) procedural error, (d) skill-based error, or (e) other. The
and Williams (2004) postulated that many of the accidents could have been anticipated
through an analysis of the interfaces used to control the vehicles and operating procedures.
Most UAV control interfaces were not developed based on established aviation display
concepts, and many of the mishaps reported involved a problem with the command interface
to the system. Williams did not discuss further the specific issues found in interfaces,
alluding only to a lack of adherence to current domain convention.
Related to the Williams (2004) study, Tvaryanas, Thompson, and Constable (2006)
analyzed 10 years of unmanned aircraft mishaps in the US Military. A mishap was defined as
an unplanned occurrence or series of occurrences, resulting in damage or injury (Tvaryanas
& Thompson, 2008). In total, just over 60 % of mishaps were judged to involve human
factors in one form or another, with slight differences occurring within each of the armed
services. The Air Force UAS accidents included automation problems, inadequate
instrumentation or feedback to the operator, and channelized attention. The primary human
factors issues that the Army identified were lack of situation awareness, communication
during alarm states, and cognitive overload, described as operators being unable to process
pertinent information leading to errors. Tvaryanas et al. showed that pilots exhibited an
over-reliance on textual information when experiencing cognitive overload, accompanied by
underutilization to other interface features and mediums. Across all services, there were
issues involving control interfaces that contributed to operator error. Specific issues,
included poor decision support systems, poor workstation design, lack of interface
also identified as being prevalent across UAV platforms, across military branches, and to
represent opportunities for UAV design improvements.
Yesilbas and Cotter (2014) reviewed over 300 US Air Force and Accident
Investigation Board accident reports of UAV accident reports from 2000 to 2013. In line
with Williams (2004) and Tvaryanas et al. (2006), the researchers suggested that about 60 %
of the remotely piloted aircraft mishaps involved operation-related human casual factors.
Based on the relatively stable accident rate over the years, and consistent identification of
accident causal factors, this paper reinforced that the point that researchers and designers
have data to use as a basis for improving UAV design and potentially preventing user errors.
However, even though data may exist, the tools to help designers create the most effective
interfaces and systems have either not been created, validated, or utilized when designing and
fielding systems.
Giese, Carr, and Chahl (2014) conducted an analysis of all Air Force Predator
mishaps over the past 15 years, attempting to determine the impact of human factors issues
within these mishaps. Researchers used the official investigation reports from the US Air
Force Accident Investigation Board and reviewed accidents that resulted in a fatality, loss of
an aircraft, or property damage greater than $2 million (Giese et al., 2014). Among 52 events
reviewed, Giese et al. documented that 42 % of those mishaps involved human error as the
main or a contributing cause. Moreover, 30 % of mishaps involving human error identified
system design of technology (interfaces, guidance material, etc.) as a contributing factor in
the accident. Endsley (2000) has previously observed that poor aviation system design has
ineffective way, and excessive attention demands. For the Predator mishaps, in which poor
technology design contributed to operational problems, two major areas of concern were the
design of heads-up displays, along with warnings and cautions (Giese et al., 2014). This
suggests that the interfaces between humans, computers, and aircrafts are not optimally
designed for the tasks to be performed, especially in terms of accommodating user
limitations. Giese et al.’s analysis did not further investigate pilot needs, or make any
specific suggestions for optimizing interface designs.
Not surprisingly, operator flight experience has been shown to be an advantage when
controlling an unmanned aircraft that requires stick and rudder inputs (Schreiber, Lyon,
Martin & Confer, 2002). However, a lack of traditional flight experience may be less
relevant for systems that are largely controlled via a computer interface (Barnes, Knapp,
Tillman, Walters, & Velicky, 2000). Most UAV pilots do not have manned piloting
experience, and teleoperate – remotely pilot – the UAV from afar using a computer-based
interface (Cahillane, Baber, & Morin, 2012). The control interfaces are, therefore, intended to
communicate all vehicle information to the pilot. This design intention places a significant
burden on the designer and emphasizes the need for interface design tools.
A challenge common to all pilots teleoperating UAVs is the reduced set of perceptual
cues available through control interfaces, as compared to an out-of-cockpit view in a manned
aircraft. The pilot of a UAV is limited to perceiving information as presented by control
interfaces and in the defined format of the interface; they are often deprived of rich
surrounding environment cues as used by conventional pilots. The perceptual gulf between
were unaware they were receiving direct small arms fire until they saw fuel splash on the lens
of an on-board camera (indicating a gross failure in pilot situation awareness). UAV
interfaces need to provide system-state information and control action feedback to operators
in order to support performance (Lam, Mulder, & Van Passen, 2007). The vehicle attack
situation further illustrates the limitation of operator understanding of vehicle and
environment states in terms of interface content as well as the necessity to design displays to
reduce operator workload and maximize situation awareness.
Despite being referred to as “unmanned,” many of the major challenges facing UAVs
relate to human factors and human limitations. For example, what information do UAV pilots
need and how can it be presented in a cogent manner that does not overload pilot information
processing capabilities? These are human factors issues that can provide an opportunity to
optimize interface features or functions in order to facilitate high pilot performance. In the
next section, UAV human factors studies are reviewed with a focus on how to properly
design interfaces to moderate workload and reduce errors.
Current Human Factors Studies
The mounting interest for unmanned aviation is a direct result of demonstrated
vehicle capabilities and potential in many fields. As existing unmanned aircraft automation
technological has been fine-tuned for reliability, human factors issues in vehicle control have
come to the forefront of systems design. Over the past 15 years, the human factors field has
conducted a significant number of studies on UAV interfaces that have attempted to identify
how control interfaces can be enhanced. These efforts have been aimed at improving
Olson and Wuennenberg (2001) proposed that UAV interface design requirements
must be developed for each level of autonomy, given that there is no one standard
appropriate for all UAVs. With this in mind, they proposed a set of user interface design
guidelines for supervisory control of UAVs. Automation behavior, such as system status and
flight control functions, need to be highly visible to the operator to facilitate situation
awareness. Users should find it easy to extract meaning from displays quickly; designers
should minimize information access costs by highlighting relevant information and
displaying information in appropriate formats (Olson & Wuennenberg, 2001). Designers
should direct user attention to changes in system status by highlighting changes in relevant
areas of displays and reducing time to detect a change by making the data more salient.
Lastly, Olson and Wuennenberg (2001) recommended easy protocols for pilots to re-instruct
an automated system or make it quick to change UAV actions as necessary. Olson and
Wunnenberg’s recommendations highlight the need for effective interface designs for users
regardless of the specific UAV control task or level of automation.
Pedersen, Cooke, Pringle, and Connor (2006) documented the perspectives of two
UAV operators, including vehicle piloting issues. There was no empirical work as part of this
research; however, the identified issues represent expert opinions. The pilots identified some
problematic interface designs, which could be easily fixed. The Predator interface was
identified as causing eye fatigue by including red graphics on blue background or black
lettering on a red background – this display led to extra stress and fatigue for the operator.
Additionally, the interface symbology was not intuitive and caused operator reliance on
stress for pilots in terms of the need to use working memory. Unfortunately, such interface
designs have been tested, approved and fielded by the US Army with unresolved issues that
compromised pilot performance. As seen from the perspective of expert users, there is a
need to continue to iteratively improve the Predator system design. By addressing
established human factors design standards in interfaces, such as that used to control the
Predator, designers can decrease user workload and improve mission performance.
Calhoun and Draper (2006) conducted studies that hypothesized multisensory
interfaces would improve UAV operator performance, and that awareness could be improved
through sensory stimulation akin to that experienced by pilots in non-remote control settings.
The researchers determined that visual interfaces could be augmented with synthetic views,
effectively overlaying information on camera feeds. These synthetic views increased pilot
situation awareness, reduced search time, and reduced workload. Moreover, tactile feedback
on the control stick was used to cue pilots to the presence of turbulence. This tactile feedback
improved landing accuracy, increased situation awareness, and reduced pilot workload.
Calhoun and Draper (2006) showed that there are specific features of visual interfaces and
physical controls that can be manipulated to increase performance and decrease operator
workload.
Williams (2006) conducted an in-depth review of unmanned vehicle accidents, solely
focusing on accidents that involved flight control. In a study of the Global Hawk UAV,
Williams explained how the system was not designed to receive inputs from a pilot, as the
design was intended to automate the user out of the system. The lack of capability for a pilot
Global Hawk on runways. Similarly, Williams reviewed a Helios accident, another large
scale UAV, where the control panel was not designed for pilots to input commands during
exigent circumstances. The pilot was not able to navigate and prevent the loss of the vehicle
during off-nominal conditions, resulting in the loss of multimillion-dollar aircraft. Williams
concluded that improvements to the control interface – specifically the inputs and system
feedback - could be used to decrease errors during use.
Drury, Richer, Rackliffe, and Goodrich (2006) compared situation awareness for two
UAV interfaces in an attempt to mitigate shortcomings in pilot awareness due to a limited
display field-of-view or “soda-straw” effect. The “soda-straw” effect is when the pilot loses
an understanding of what is going on around them because they are only receiving inputs
from a small view of the environment, as would be the case in viewing the world through a
soda-straw. While doing a search and rescue task with an augmented interface, pilots felt
they had a better understanding of their location in the environment and were able to more
quickly and accurately execute tasks with the augmented visual interface. When provided
contextual information via pre-loaded terrain data, pilots were better able to comprehend 3D
spatial relationships between the UAV and points on a map. This increased spatial
understanding significantly improved pilot performance in the search and rescue tasks, and
simultaneously increased situation awareness and decreased mental workload.
Chen, Barnes, and Harper-Sciarini (2010) reviewed research pertaining to human
performance issues in supervisory control of unmanned vehicles. Chen et al. determined that
augmented reality, or synthetic vision, was an effective means by which to enhance pilot
contextual information about the surrounding terrain enhanced user spatial understanding and
improved performance on search tasks across multiple platforms. Additionally, the
researchers validated the recommendations set forth by Olson and Wunnenberg (2001) that
interfaces should highlight changes and direct user attention to relevant areas of displays.
Many UAV systems are highly automated and it is difficult for users to detect system state
changes. By making system status abnormalities salient, interfaces can decrease operator
workload under off-nominal situations when more resources need to be directed towards
decision-making.
Neville, Blickensderfer, Archer, Kaste, and Luxion (2012) conducted a cognitive
work analysis to identify human machine interface design requirements aimed at improving
challenges unique to UAV pilots. The researchers adopted a multi-pronged approach to
understand pilot difficulties in vehicle control. They conducted critical event interviews with
10 expert UAV pilots where the pilots ‘walked through’ the event from beginning to end;
after completing the walkthrough, the researchers followed up with specific questions to
better understand pilot actions and interactions with the vehicle. Additionally, the
researchers observed operations at a Predator ground control station, analyzed mishap
summaries and reviews, and had two UAV subject matter experts consult during the process.
Through these methods, Neville et al. (2012) identified six overarching areas where
human-machine interfaces could be improved, including: (a) better communication of status and
environment information, (b) reduced demand on memory, (c) support for attention
management, (d) more robust feedback-control loops, (e) improved error avoidance,
identified what information should be available to users but did not provide specific design
suggestions on how interfaces should deliver such information.
Lu et al. (2013) assessed the effect of a UAV situation-augmented display on pilot
Level 3 situation awareness as compared to a conventional control display. The planned
trajectory of the UAV was diagramed in a Cartesian space formed by two axes: altitude
(vertical) and velocity (horizontal). The researchers hypothesized that if an abnormality
occurred, the deviation could be more easily detected in the augmented display. Participants
using the situation-augmented display were 2.67 seconds faster in detecting abnormalities
than those using the conventional display. The effects of the situation-augmented display on
abnormality detection were robust across different workload and noise levels. Detection of
signal noise was not different for the two display types, suggesting the situation-augmented
display gained its benefit in UAV performance without any extra cost to the secondary task.
Fuchs, Borst, de Groon, Van Paassen, and Mulder (2014) contended that most UAV
studies focused on increasing the level of vehicle automation, and overlooked potential
positive influences of visual interface information presentation. Fuchs et al. performed a
work domain analysis and summarized the findings in an abstraction hierarchy model. Using
this analysis, they created a set of visualization enhancements to help UAV operators identify
deviations from mission, trace causes of deviations, and formulate alternative solutions. The
researchers observed users in problem-solving activities and assessed the effectiveness of the
enhancements. Through a post-test questionnaire, users considered coloring of flightpath
waypoints, and the coloring of lines connecting waypoints to be useful (Fuchs et al., 2014).
tools for deciding what information to display on a interface – however, these tools did not
inform the researchers of how to visualize the information on the interface.
Similar to Fuchs et al. (2014) disposition on UAV studies, Hobbs and Lyall (2016)
offered that, despite advances in unmanned aviation, control station and interface design
guidelines have not addressed some of the unique challenges faced by unmanned vehicle
operators. From a review of existing technologies, the following design problems were
identified across control interfaces: (a) a reliance on textual information, (b) complicated
menu sequences to perform tasks, (c) unguarded safety-critical controls that could be
accidently activated, and (d) pop-up windows that could obscure pilot view of critical
displays. Based off these design issues, they advocated for an augmentation of existing
system design guidelines to address unique operational requirements. Hobbs and Lyall
(2016) identified five types of information needed for expanding UAV guidelines, including:
(a) task descriptions, (b) display requirements, (c) control requirements, (d) properties of the
interface, and (e) general human factors principles. By developing and grouping guidelines
in such a manner, UAV designers can be provided with a compiled source of domain-specific
and generalizable criteria. There is a significant need in both commercial and military
domains for a comprehensive set of UAV interface design guidelines.
Table 2.1 provides a summary of the findings of the above human factors studies
identifying UAV interface deficiencies as well as their impact on pilot performance. These
studies discussed overall design standards and some provided recommendations based on
specific experiments and targeted at certain domains. One limitation of these studies is that
UAV interface designs. The studies provide an empirical basis/approach for determining
which interface may be better for operator performance and workload than another, but there
is no comprehensive quantitative method that integrates the results of all these studies to
justify the design of an UAV interface.
Table 2.1: Constrained Review of UAV Interface Design Deficiencies
Constrained Review of UAV Interface Design Deficiencies
Reference
Interfaces should highlight changes to the user. Olson & Wunnenberg, 2001 Lack of design consistency across controls and displays
as they were not designed off of established aviation principles.
Williams, 2004
Complicated multi-step sequences required to perform routine or time-critical tasks.
Williams, 2006
Non intuitive symbology; Improper color combinations;
Physical implements that were not sized for a human hand.
Pedersen et al., 2006
Lack of feedback on pilot control inputs or system states.
Tvaryanas et al., 2006; Williams, 2006; Neville et al., 2012 Difficult to detect and correct errors. Neville et al., 2012 Heavy reliance on memory to keep track of system
status and flight plan details.
Neville et al., 2012; Pedersen et al., 2006
Waypoints not colored. Fuchs et al., 2014
Reliance on text displays to the exclusion of other sources of information.
Hobbs & Lyall, 2016; Tvaraynas et al., 2006 Use of non-standard language in messages;
Poor hierarchy of presentation;
Complicated menus to perform critical or frequent tasks.
Mental Workload Measures
Mental workload is an idea with which many are familiar and consider to be
fundamentally complex; however, there are few clear definitions of the construct (Hancock
& Meshkati, 1988). Humans have limited mental resources, and because of this fact, mental
workload can be defined as the difference between the amount of available mental processing
resources and cognitive task demands (Hart & Staveland, 1988). For instance, a routine task
may require only 10% of a person’s available resources; whereas, a very difficult task might
require 90% of the same person’s mental resources. Mental overload occurs when there are
too few resources available to allocate to required tasks, increasing stress and errors;
whereas, underload occurs when tasks consume too few available resources, increasing
boredom. Both overload and underload can hinder overall performance (Nachreiner, 1995).
Mental workload can be measured using both subjective and objective measures.
Subjective measures include self-report surveys, such as the Multiple Resource
Questionnaire (Boles, Bursk, Phillips, & Perdelwitz, 2007) and the NASA Task Load Index
(Hart & Staveland, 1988). Subjective measures are useful for determining how much
workload a person “feels.” Some research has also demonstrated utility of multidimensional
rating scales to gain more information on the types of task demands that people perceive.
The most common subjective measure of workload is the NASA-TLX. Although the
measures requires substantial time to complete, it has been shown to be highly accurate
(Miller, 2001). The NASA-TLX uses six dimensions to assess workload: (a) mental demand,
(b) physical demand, (c) temporal demand, (d) performance, (e) effort, and (f) frustration. A
weighted based on paired comparisons of the various workload dimensions. Respondents
choose which dimension is more relevant to workload for a particular task across all pairs of
the six dimensions. The overall workload measure is obtained for a task by multiplying the
weights by the individual dimension scale ratings, summing across scales, and dividing by
the total weights. Generally, the NASA-TLX is useful multidimensional scale for measuring
mental workload (Hill et al., 1992).
Within the UAV domain, Lu, Horng, and Chao (2013) demonstrated the effectiveness
of the NASA-TLX. They used the NASA-TLX to compare workload responses in using a
situation-augmented display for UAV monitoring task performance. They concluded that the
new interface improved performance without increasing operator cognitive workload.
Subjective mental workload measurements, like those collected by Lu et al., can provide
insight into how respondents perceive demand, but typically must occur after completing a
task or subtask. By taking the measurement after a task is complete, there is a gap in
understanding of how mental workload may fluctuate during a task.
Objective metrics include measures of performance, spare mental capacity and
physiological responses. Task performance represents how well a person accomplishes a task
and is measured objectively by gauging error, efficiency, and/or accuracy when completing a
task (Gawron, 2008). One of the problems associated with strictly using task performance as
an indicator of workload is that it does not take into account spare mental capacity (Sirevaag
et al., 1993). For example, two tasks may be performed equally, but one person’s mental
capacity may be pushed to its limits while another person’s mental capacity is not pushed at
estimate workload is variation in motivation. When people are more motivated, their
workload may increase, but their performance might not increase to the same extent
(Vidulich & Wickens, 1986). Examples of task performance measures include how many
times a person accomplishes a task or subtask, how long it takes, whether or not the task was
successful, or how close the method of completion was to the correct method. It is also hard
to measure changes to performance due to workload, unless the workload is high; changing
from a “low” to “medium” level of workload probably will not produce a change in
performance even though workload is increasing.
Spare mental capacity can be measured through secondary task performance
(Gawron, 2008). Secondary tasks are separate from the primary work task and associated
metrics, such as accuracy and speed of response, can be used to indicate levels of participant
performance and mental workload. Secondary tasks can include activities such as
memorization, simple math, counting, or answering questions while also performing the
primary work task. Physiological metrics, such as heart rate, heart rate variability, and
respiration rate have also been identified as indicators of mental workload or demand
capacity (Miller, 2001). Although these measures can provide an indication of how workload
may fluctuation over time, they are influenced by a broad range of demands, including both
physical and cognitive activities, and, therefore, may not have the same level of diagnosticity
Existing Interface Evaluation Methods
Usability Testing
Usability testing is broadly defined as focusing on user needs and using empirical
measures to iteratively improve an interface (Nielsen, 1999). Usability testing is a
highly-used method to assess whether an interface presents users with adequate functional features
and whether they are easy to use (Dix, 2004). Usability testing involves a number of steps,
including: (a) engaging real users in testing; (b) giving users real tasks to accomplish; (c)
enabling testers to observe and record actions of users; (d) enabling testers to analyze data
and make changes to interface designs; and (e) improving product usability. There are many
different methods for testing usability, including heuristic analysis, cognitive walkthroughs,
design experiments, etc. Methods measure learnability, efficiency, memorability, errors, and
user satisfaction (Nielsen, 1999). Methods also vary in terms of using novices vs. experts.
However, testing has proven to be powerful when applied iteratively to interface designs.
Cavett, Coker, Jimenez, and Yaacoubi (2007) leveraged persons with no manned or
unmanned piloting experience to evaluate UAV interface designs. Eight participants
conducted usability tests by performing missions and accomplishing discrete tasks with two
different interfaces. Researchers watched and listened as the participants provided verbal
protocols during the experiment. Cavett et al. measured how long it took to train participants
to become proficient on the interface, the time to complete the tasks, number of errors for
each task, and the level of satisfaction with the interface. Researchers also collected user
UAV interfaces, they developed information necessary to improve functions and features.
The also proposed a follow-on experiment to test design revisions.
Experts are often relied upon to complete usability testing. Experts understand the
tasks required to accomplish a mission and they have experience with nominal and
off-nominal performance conditions. They can leverage these experiences to comment on
potential system usability issues. Within the manned aviation domain, Kaber, Riley, and Tan
(2002) conducted a usability inspection of commercial aircraft flight management system
with expert pilots. The pilots assessed a multifunction control display unit interface in terms
of usability principles. The expert pilot observations and assessments resulted in design
recommendations that increased consistency among interface screens, thereby reducing pilot
working memory requirements and cognitive workload.
Another common way that experts evaluate a system is through a heuristic evaluation.
A heuristic evaluation requires examination of every aspect of an interface to ensure that it
meets usability standards (Nielsen, 1993). Nielsen recommended having at least 3 evaluators
perform an evaluation in isolation from each other using design heuristics, such as: (a) simple
and natural dialogue, (b) speak the user’s language, (c) minimize the user’s memory load, (d)
be consistent, (e) provide feedback, (f) provide clearly marked exits, (g) provide shortcuts,
(h) provide good error messages, and (i) prevent errors. Each heuristic can be evaluated with
ratings of “satisfied”, “partially satisfied”, and “not satisfied”. Once complete, evaluators
should come together and aggregate their findings. From these evaluations, a usability expert
can predict performance – typically, the greater an interface adheres to design heuristics, the
Modified Cooper Harper – Unmanned Vehicle Device (MCH-UVD)
The Modified Cooper-Harper (MCH) scale is a 10-point rating scale of workload
(Hill et al., 1992). The MCH scale has been used to measure perceptual, cognitive, and
communications workload. Generally, the MCH has been found to be a reliable estimator of
overall mental workload. Currently, the FAA and the manned aviation domain accept the
MCH as a valid measure of cognitive workload.
Cummings, Meyers, and Scott (2006) extended the MCH as a usability evaluation
tool for application to unmanned vehicle devices (UVD), creating the MCH-UVD. The
researchers used the same general approach to administration of the MCH but applied
domain specific questions, shifting the emphasis away from evaluating physical controls of
an aircraft, to evaluating how well displays support basic operator information processing.
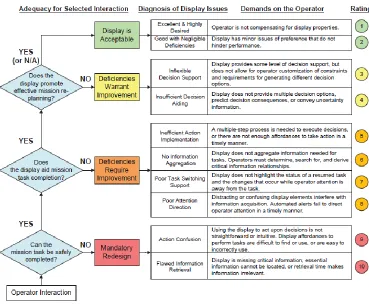
As shown in Figure 2.1, the MCH-UVD has 10 ratings separated into four distinct blocks.
These ratings address stages of a human information processing model and acceptable
display designs. Acceptable displays include two ratings: “good displays with negligible
deficiencies”, and “excellent and highly desired displays”. A display receives a rating of 1
when the operator is not compensating for any deficient display properties. Displays receive
a rating of 2 when they are considered to support information processing but have very minor
preference issues that do not hinder pilot performance (Cummings et al., 2006). In their pilot
study, Cummings et al. (2006) found that the MCH-UVD helped to identify what level of
information processing and decision support interfaces provide to UAV operators – activities
Figure 2.1: Modified Cooper Harper Scale for Unmanned Vehicle Displays
Donmez, Cummings, Brzezinski, and Graham (2010) empirically assessed the
validity of the MCH-UVD by having 60 participants use the tool as a post-test survey in
evaluation of two unmanned aerial and ground vehicle displays for performing multiple
missions. Most participants (86 %) found the MCH-UVD to help them identify display
deficiencies, and 32 % said they could not have identified deficiencies without the tool
(Donmez et al., 2010). The tool provides UAV users with a higher level cognitive
framework for evaluating an interface and is effective for identifying display issues.
fails to address the sensitivity and selectivity of the tool when used by experts and novices.
Moreover, the MCH-UVD does not provide a designer with concrete criteria as a basis for
either creating or re-configuring an interface to ensure that the design conforms to with
established domain norms and findings of previous empirical studies.
GEDIS-UAV
Lorite, Munoz, Torner, Ponsa, and Pastor (2013) created the Ergonomic Guideline for
Supervisory Control Interface Design – Unmanned Aerial Vehicles (GEDIS-UAV), which
was intended to evaluate the usability of an UAV interface in an objective manner and to
establish a “pedigree” for interface designs in terms of guidelines. Based on a set of industrial
and domain specific guidelines, 10 design indicators (features) were identified to
comprehensively evaluate interfaces, including: (a) architecture, (b) distribution, (c)
navigation, (d) color, (e) text font, (f) status and devices, (g) process values, (h) graphs and
tables, (i) data entry commands, and (j) alarms. Within each indicator, sub-indicators (feature
characteristics) were identified to address domain specific resources as shown in Table 2.2.
These indicators and sub-indicators are meant to provide a basis for comprehensively
evaluating every aspect of a UAV interface by applying domain conventions and established
HCI principles. The goal for the GEDIS-UAV evaluation tool is to help identify and correct
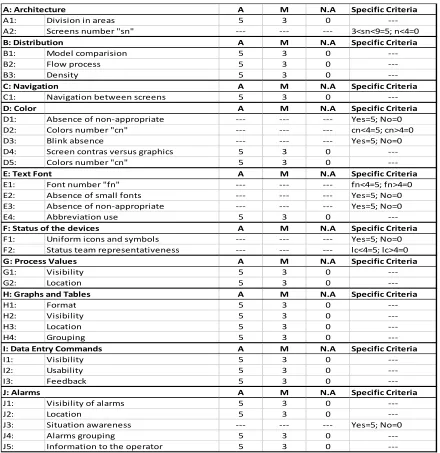
Table 2.2: GEDIS-UAV’s Indicators and Sub-Indicators
The GEDIS-UAV involves expert ratings of interface design conformance for each
sub-indicator on a scale from 0 (inappropriate) to 5 (appropriate). An evaluation index for
each indicator can be calculated based on the extent of interface conformance to sub-A M N.A Specific Criteria
A1: 5 3 0
A2: --- --- --- 3<sn<9=5; n<4=0
A M N.A Specific Criteria
B1: 5 3 0
B2: 5 3 0
B3: 5 3 0
A M N.A Specific Criteria
C1: 5 3 0
D: Color A M N.A Specific Criteria
D1: --- --- --- Yes=5; No=0
D2: --- --- --- cn<4=5; cn>4=0
D3: --- --- --- Yes=5; No=0
D4: 5 3 0
D5: 5 3 0
A M N.A Specific Criteria
E1: --- --- --- fn<4=5; fn>4=0
E2: --- --- --- Yes=5; No=0
E3: --- --- --- Yes=5; No=0
E4: 5 3 0
A M N.A Specific Criteria
F1: --- --- --- Yes=5; No=0
F2: --- --- --- lc<4=5; lc>4=0
A M N.A Specific Criteria
G1: 5 3 0
G2: 5 3 0
A M N.A Specific Criteria
H1: 5 3 0
H2: 5 3 0
H3: 5 3 0
H4: 5 3 0
A M N.A Specific Criteria
I1: 5 3 0
I2: 5 3 0
I3: 5 3 0
A M N.A Specific Criteria
J1: 5 3 0
J2: 5 3 0
J3: --- --- --- Yes=5; No=0
J4: 5 3 0
J5: Information to the operator 5 3 0
---Feedback
J: Alarms
Visibility of alarms Location Situation awareness Alarms grouping Visibility Location Grouping
I: Data Entry Commands
Visibility Usability ---Flow process
F: Status of the devices
Uniform icons and symbols Status team representativeness
G: Process Values
---Abbreviation use ---Visibility Location
H: Graphs and Tables
Format
Screen contras versus graphics Colors number "cn"
E: Text Font
Font number "fn" Absence of small fonts Absence of non-appropriate Density
Navigation between screens Absence of non-appropriate Colors number "cn"
Blink absence Division in areas Screens number "sn"
indicators. Aggregate indicator scores can be used for a comparison of competing UAV
interfaces. An overall score of 4 or more points for interface is considered as a criterion for
“positive” design; designs with global scores of 3 or less should be considered
“unacceptable” and re-designed to improve attributes yielding “inappropriate” scores. The
global GEDIS-UAV score, along with the various indicator and sub-indicator scores,
provides designers with specific feedback on where to focus design changes and
interventions to promote usability (Lorite et al., 2013).
The GEDIS-UAV does, however, have some limitations that detract from its goal of
objectively evaluating UAV interfaces. Zhang, Feltner, Shirley, Swangnetr, and Kaber
(2016) observed limited justification for usage of the various design indicators, as they were
directly taken from the industrial process control realm and failed to account for UAV
domain specific interface features. Additionally, the sub-indicators (or interface
characteristics) were not supported by detailed references to existing literature, making
selection appear arbitrary in nature. Lastly, the scoring criteria was subjective and provided
no justification for (or details on) the various levels of design conformance/deviation from
guidelines. The determination of “Appropriate,” “Medium,” “and “Non-Appropriate” ratings
are subject to analyst personal preference (Zhang et al., 2016).
Modified GEDIS-UAV (M-GEDIS-UAV)
Zhang et al. (2016) used the concept of the GEDIS-UAV and addressed the above
identified limitations (lack of justification of design indicators, sub-indicators, and scoring
system) to create a new UAV interface usability evaluation method. The Modified
guidelines and general interface usability principles. The researchers identified required
interface functions and necessary usability features as a comprehensive basis for evaluating
UAV supervisory control interfaces. Zhang et al. followed a “bottom-up” approach to
identifying interface design indicators/features by grouping established human factors and
domain specific design criteria. They also used a “top-down” approach for organizing all
indicators according to established usability heuristics. They ensured that all indicators were
clearly defined and uniquely classified by heuristic without overlap among heuristics. The
revised set of M-GEDIS-UAV macro-indicators include: (a) Display Layout, (b) Information
Presentation, (c) Color, (d) Text, (e) Map and Navigation, (f) Status and Devices, (g) Data
Entry Command, (h) Alarm, and (i) Physical Control (Zhang et al., 2016).
In order to develop a revised set of sub-indicators as part of the interface evaluation
tool, the researchers leveraged knowledge within the UAV domain and combined that with
other established human factors guidelines. Zhang et al. referenced: (a) the Human Factors
Design Standard (HFDS), (b) Man Systems Integration Standard (NASA-STD 3000), (c)
Nuclear Regulatory Guide (NUREG) 0700, (e) Military-Standard-1472, (f) Unmanned Aerial
System Ground Control System Human-Machine Interaction (UAS GCS HMI) guide, (g)
Joint Architecture for Unmanned Systems Human Machine Interaction (JAUS HMI) guide,
and (h) Norwegian Technology Centre’s (NORSOK) guidelines. Some prior research has
shown that established human factors standards for computer workstations and visual display
terminals can be applied as bases for effective design of UAV control stations and interfaces
(Waraich, Mazzuchi, Sarkani, and Rico, 2013). Therefore, Zhang et al. aligned these seven
create sub-indicators for detailed assessment of interface design conformance. Related to this
approach, Donmez et al. (2010) indicated that 15 % of users of the MCH-UVD suggested
using a checklist to grade displays. Zhang et al. (2016) used the criteria from established
guidelines to create a conformance checklist. Table 2.3 presents the set of sub-indicators, or
design criteria, targeting color features of an interface along with the source reference for
each criteria. Every other indicator (beyond color) has a separate spreadsheet and provides
The checklists for each indicator are applied in a binary manner; that is, an evaluator
determines whether an interface conforms to guidelines (1), does not conform (0), or the
guideline (sub-indicator) does not apply (N/A). Aggregation of sub-indicator scores leads to
indicator scores, and aggregation of indicator scores leads to an overall score for the
interface, as show in Table 2.4. At this point in the tool development, guidelines that are
N/A do not negatively impact the score for an interface and all indicators are equally
weighted; however, the tool has the flexibility to be modified with criteria weighting factors
based on expert evaluator perceptions of the importance of particular indicators and
sub-indicators.
Table 2.4: Global M-GEDIS-UAV Score
Application of the M-GEDIS-UAV involves an analyst independently evaluating an
interface, based on the features and functions presented. Video recordings of users can also
be used as a basis for analysis of identified interface functions. Preliminary testing of the tool
analyst use. This same testing involved multiple expert analysts and interface evaluation
results were used as a basis for assessing inter-rater reliability. An intra-class correlation
coefficient (ICC) was calculated based on the M-GEDIS-UAV indicator scores for three
analysts. The ICC had a “moderate” value of 0.429 with human factors experts and “low”
value (0.204) for novice analysts. Bliese (1998) considered ICC >= 0.7 to be acceptable for
clinical studies. The relatively low ICC was mostly attributable to disagreement among
analysts in identifying whether guidelines were applicable or not. That is, while one analyst
assigned a score for some criteria (“Y” or “N”), another analyst might have considered the
same design criteria to be not applicable to the system interface. In a follow-on assessment of
application of the new tool, an additional group of evaluators was required to have a meeting
and establish agreement on which evaluation criteria (sub-indicators) are applicable or not
applicable to UAV interface design. When this updated procedure was followed, results of
the additional human factors expert evaluations of interface yielded a “high” ICC of 0.83.
The primary limitation of the M-GEDIS-UAV is the use of the “N/A” grade for
sub-indicators and specific design criteria. The tool is presently designed to evaluate aspects of
an interface that are available but not penalize an interface for the absence of components.
For example, an evaluator would not grade the “Auditory Signal” sub-indicator as part of the
“Alarms” indicator as a “0” if an interface does not have an audio component; rather, the
evaluator assigns “N/A” because the component is not present and therefore cannot be
evaluated. Additionally, with over 300 individual criteria, it takes about 3 hours for an expert
Selection of Workload Measurements and Interface Evaluation Tool
Given its comprehensive framework and strong basis in the literature, the present
study utilized the M-GEDIS-UAV as a platform to objectively evaluate UAV interfaces. The
M-GEDIS-UAV was used to objectively grade components of prototype interfaces in a
systematic manner with a very high level of detail.
As a means by which to assess cognitive workload imposed by UAV interface
designs, the present study also applied the NASA-TLX. The NASA-TLX was chosen as it is
a multi-dimensional tool addressing mental demand, physical demand, temporal demand,
performance, effort, and frustration. The NASA-TLX has been found to be time-consuming
but accurate and it provides strong diagnosticity, making it the preferred choice for many
researchers (Miller, 2001). Moreover, the NASA-TLX has been used in the UAV domain
and has been found to be sensitive to different levels of task workload.
Beyond these tools and measures, in order to assess operator performance in UAV
control tasks, as mediated by various interface design variations, a battery of primary task
performance measures were identified, including accuracy and sub-task completion time.
These measures can provide indicators of the frequency of errors in each task as well as
operator efficiency during UAV missions. The responses can also be linked to operator use
of specific interface features for task performance. The NASA-TLX and these primary task
performance measures were used to characterize the impact of supervisory control interface
designs on operator performance and as basis for assessing the utility of the M-GEDIS-UAV
3. Problem Statement Research Motivation
With the increase in available UAV technology for civilian and military applications,
the present work sought to assess the validity of an objective methodology for UAV interface
design evaluation. A pilot’s ability to navigate, monitor vehicle status, and manipulate flight
parameters is essential for successfully accomplishing UAV missions – no matter what the
objective may be. Taking off, navigating a given flight path, and dealing with emergencies
are all actions UAV pilots are expected to be able to perform, and are especially important as
any error can have serious financial or even life-threatening consequences. The design of
UAV supervisory control interfaces mediates pilot capability to effectively complete such
tasks. Beyond this, pilot experience, or lack thereof, can also be a critical factor. The FAA,
under Part 107, licenses a 16 years old, who passes an aeronautical test, to fly a 55 pound
UAV up to 100 miles per hour (FAA, 2016) – with no live demonstration of competence;
basically, anyone can become an UAV pilot and occupy air space. This situation further
emphasizes the importance of development of system interfaces that make necessary
functions and features accessible and easy to use for operators; thereby minimizing cognitive
load and supporting performance.
According to the Air Line Pilots Association (2007), UAS vehicles and controls are
often fielded without a comprehensive assessment and mitigation of any human factors
issues; any number of simple issues could lead to mission failure, damaged equipment, or
even injury. Human Factors and Ergonomics standards need to be created and engineers
limitations (Waraich et al., 2013). At present there are no comprehensive human factors
guidelines for the design of UAV interfaces for civilian unmanned aircraft (Hobbs & Lyall,
2016). A guideline based interface evaluation tool could serve several functions: (a) assist
system developers to identify potential design problems, (b) objectively evaluate existing
systems, (c) promote interface design standardization, reducing the likelihood of
design-induced errors, and (d) supporting regulatory agencies in identifying guidelines when
developing regulations or advisory material (Hobbs & Lyall, 2016).
Researchers and designers need to create, compare, and re-design control interfaces to
minimize operator workload and improve performance. Designers need an empirically-based
tool to establish design pedigrees for interfaces, pinpoint targets for design improvements,
and provide the most effective user interface for an UAV pilot.
Objectives
The overarching objective of this research was to assess the validity of the
M-GEDIS-UAV interface evaluation tool for sensitivity and reliability in analysis of M-GEDIS-UAV interfaces
and for prediction of workload and performance outcomes of interface use. An experiment
was conducted to test the sensitivity of the tool to changes in UAV interface features and the
capability of the tool for identifying or selecting an interface that reduces cognitive demand.
Additionally, an objective was to identify the workload and performance response
differences among interface designs and to associate these differences with differences in
M-GEDIS-UAV scores. Lastly, the research sought to examine how different interface designs
may be more or less robust for supporting operators in dealing with different levels of