SURFACE STUDIES OF COMPLEX OXIDES
Lee Whitmore
Ph.D. Thesis
University College London
ProQuest Number: U642196
All rights reserved
INFORMATION TO ALL USERS
The quality of this reproduction is dependent upon the quality of the copy submitted.
In the unlikely event that the author did not send a complete manuscript and there are missing pages, these will be noted. Also, if material had to be removed,
a note will indicate the deletion.
uest.
ProQuest U642196
Published by ProQuest LLC(2015). Copyright of the Dissertation is held by the Author.
All rights reserved.
This work is protected against unauthorized copying under Title 17, United States Code. Microform Edition © ProQuest LLC.
ProQuest LLC
789 East Eisenhower Parkway P.O. Box 1346
Abstract
The surfaces o f two distinct crystalline oxide m aterials have been investigated using interatom ic potential techniques.
The hydroxylated (111) surface o f siliceous faujasite has been found to have two possible surface structures w ith very sim ilar surface and attachm ent energies. Both surfaces have been observed experim entally by others and this thesis shows that the two surfaces are calculated to be the m ost favourable from m any different surface term inations. Further to this, the adsorption on this surface o f benzene and para-xylene and also the penetration o f this surface by those m olecules has been studied, the first tim e such a study has been undertaken. Surface adsorption energies and barriers to m olecular transport through the surface layer o f the m icroporous crystal are reported. O ne surface affords adsorption positions and diffusion barriers equivalent to the bulk o f the m aterial and one surface has w eaker adsorption sites and low er diffusion barriers. Both surfaces show a significantly larger barrier to transport out o f the crystal host than they do to transport into the crystal.
The prim ary surfaces o f zinc oxide crystals have been investigated using a new interatom ic potential w hich w as created for the purpose. In particular, the (10Î0) surface has been studied in detail, including its com m on defect structures. The findings from this w ork resolve an apparent conflict betw een theoretical and experim ental observations about this particular surface.
Acknowledgements
I w ould like to thank Professor Richard Catlow for giving m e the possibility to study at the Royal Institution including all o f the curtesies afforded to m e during m y tim e there, and for the opportunity to w ork on an stim ulating project. A lso, I w ould like to thank Dr. A ndrew Rohl o f Curtin U niversity, Perth, for the m ore than generous invitation to spend tim e working w ith him and to M olecular Sim ulations Inc. (as w as) for their kind hospitality. Professor D avid Price, m y co-principal supervisor is w arm ly thanked for his invaluable assistance.
This w ork was funded by the EPSRC, to w hom I am indebted, thank you.
I am grateful to m y advisors. Dr. Ben Slater and Dr. A lexey Sokol for the guidance and assistance they have both given over the past four years and to Dr. Furio Cora, Dr. M aria A lfredsson, Dr. A lexandra Simperler, Dr. D avid Coom bes, Dr. M ark Calm iano, Carolyn Barker, Dr. Julian Gale, Dr. Sam French, Dr. D avid Gay, Dr. R obert Bell, Dr. Scott W oodley, Dr. Robin Grimes, Dr. M ark O gden and Dr. M artin N ygren for various help, discussions, chats, m usings and advice.
Table o f Contents
1 Chapter 1 : Introduction and aim s 1
1.1 Introduction to Surface M odelling o f Com plex O xides 2
2 Chapter 2 : O xide m aterials 5
2.1 Introduction 6
2.2 Silicon D ioxide 6
2.2.1 Introduction to zeolites 7
2.2.2 Chem ical com position 8
2.2.3 N atural form ation 10
2.2.4 Synthesis 10
2.2.5 M icroporosity 11
2.2.6 Structures 13
2.2.7 A pplications 16
2.3 Zinc O xide 17
2.4 References 18
3 Chapter 3 : M odelling at the atom ic level 21
3.1 Introduction to C om puter M odelling 22
3.1.1 Typography o f M odelling 23
3.2 The role o f M odelling 23
3.3 Theory o f m odelling using Interatom ic Potentials 25 3.3.1 Energy calculations in E nergy m inim isations 26
3.3.2 Param eterisation 27
3.3.3 G eom etry optim isation in M olecular M echanics 28
3.4 M olecular M odelling in this study 30
3.5 The M A R V IN program 31
3.6 References 32
4 Chapter 4 : Faujasite Surfaces 33
4.1 Introduction to faujasite 34
4.1.1 Faujasite crystal m orphologies 35
4.1.2 Synthetic com position o f Faujasite type m aterials 3 5 4.1.3 Faujasite type m aterials : crystallite m orphologies 35
4.2 Surface M odelling 36
4.2.1 Surface M odel Preparation 36
4.2.3 D eterm ination o f cleavage plane by calculation 37 4.2.4 D eterm ination o f cleavage plane by com parison to
experim ent
40
4.2.5 Selection o f candidate surface models 41
4.3 Relaxation o f hydroxylated surface m odels 42
4.3.1 Relaxation o f ‘Type I ’ surface 44
4.3.2 Relaxation o f ‘Type IT surface 44
4.3.3 Relaxation o f ‘Type IIT surface 46
4.4 Surface Dynamics 46
4.5 A tom ic coordinates for different surfaces 47
4.6 References 53
5 C hapter 5 : M olecular Penetration into Faujasite 55
5.1 Introduction 56
5.1.1 Introduction : A dsorption and penetration studies 56
5.1.2 Introduction : Surface openings 58
5.2 Potential sets 62
5.2.1 Sanders potentials for zeolites 63
5.2.2 CVFF forcefield for organic m olecules 65
5.2.3 H enson et al. param eters for benzene and siliceous faujasite
65
5.2.4 Sastre et al. Param eters for benzene and xylenes in zeolites 66
5.3 A dsorption calculations : benzene 68
5.3.1 A dsorption on the type I surface 69
5.3.2 A dsorption on the type III surface 71
5.4 Penetration calculations : benzene 72
5.4.1 Contiguous M inim isation technique 75
5.4.2 Penetration o f the type I surface 78
5.4.3 Penetration o f the type III surface 79
5.4.4 Penetration o f the type II surface 81
5.5 A dsorption calculations : para-xylene 81
5.5.1 A dsorption on the type I surface 82
5.6 Penetration calculations : para-xylene 83
5.6.1 Penetration o f the type I surface by para-xylene 83 5.6.2 Penetration o f the type III surface by para-xylene 85
5.7 Sum m ary 86
6.1 Introduction 91
6.2 Experim ental D ata available 93
6.3 M ethod o f developm ent o f the potential 93
6.4 Finalised potential param eter set 98
6.5 Structures and properties predicted by the new param eter set
99
6.6 Zinc Oxide phase diagram using the new potentials 100
6.7 References 101
7 ZnO Surface studies 103
7.1 Introduction 104
7.2 (1 0 Î0 ) surface 106
7.2.1 Surface Energies o f the two cuts o f the (1 0 Î0 ) surface 107 7.2.2 R eported surface structures o f the (1 0 Î0 ) surface 108
7.2.2.1 Structure described by ion location 108
1 2 . 2 2 Structure as described by ion distribution 110 7.2.3 Surface structure o f the (10 Î0 ) surface using the new
potentials
111
7.2.3.1 Sim ulation detail 111
1 .2 .2 2 Relaxed surface structure 112
7.2.4 D efects in the (lOTO) surface structure 114
7.2.4.1 Sim ulation details 114
1 .2 .4 2 Single layer defects 118
7.2.4.3 D ouble layer defects 121
7.2.4.4 C om binations o f defects 126
7.2.5 R ationalisation o f surface structures 127
7.3 ( l l 2 0 ) , (0001) and (0001) Surfaces 128
7.4 References 129
8 C hapter 8 : N aC l grow th inhibition 133
8.1 Introduction 134
8.1.1 Introduction - Inhibition o f the grow th o f N aC l faces 134 8.2 Potential Param eters for NaCl and (Fe“^(CN)6)^' 137 8.3 D ocking the inhibitor com plex into the surface 138
8.4 D ocked structures on the (100) surface 140
8.5 Transferability o f the method 146
9 C hapter 9 : Conclusions and future directions 149
9.1 Conclusions 150
9.2 Conclusions from the siliceous faujasite study 150 9.3 Future directions for the siliceous faujasite study 151
9.4 C onclusions from the zinc oxide study 151
9.5 Future directions for the zinc oxide study 151
9.6 C onclusions from the sodium chloride grow th inhibition study
152
9.7 Future directions for the sodium chloride grow th inhibition study
L is t o f F ig u r e s
Fig. 2.1 Proton truncated fragm ent o f zeolite fram ew ork 9 Fig. 2.2 Part o f the structure o f the zeolite M ordenite 12
Fig. 2.3 A Si0 4 tetrahedral unit 13
Fig. 2.4 A sodalite unit 14
Fig. 2.5 4 sodalite cages joined fused together to form a unit cell o f 14 sodalite
Fig. 2.6 Zeolite A - sodalite cages linked by bridges 15 Fig. 2.7 Faujasite showing the sodalite unit in ball and stick 16
representation
Fig. 2.3.1 The unit cell o f zinc oxide 18
Fig. 4.2 The three types o f surface term inations, as described by 41 Terasaki.
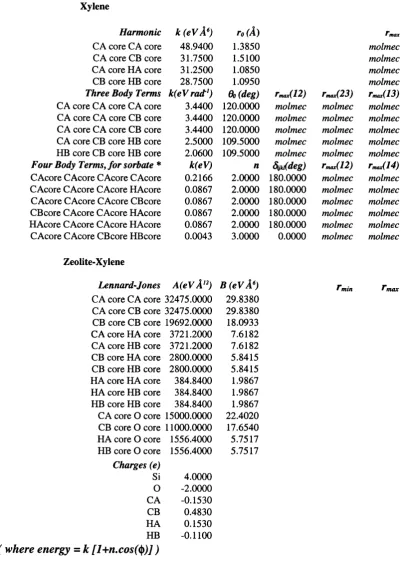
Fig. 4.3 A fram ework outline o f the Type II surface structure. 46
Fig. 5.1.1 Step structure o f (111) face, in profile, created by 60 inspection
Fig. 5.1.2 Step structure o f (111) face, create by inspections. 61-62 Fig. 5.3.1 6M R Surface adsorption position on the type I surface 70 Fig. 5.3.2 Open Sodalite Cage Surface adsorption position on the 70
type I surface
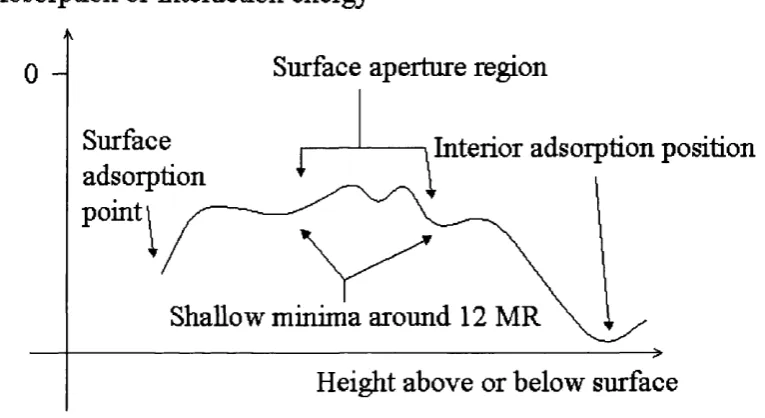
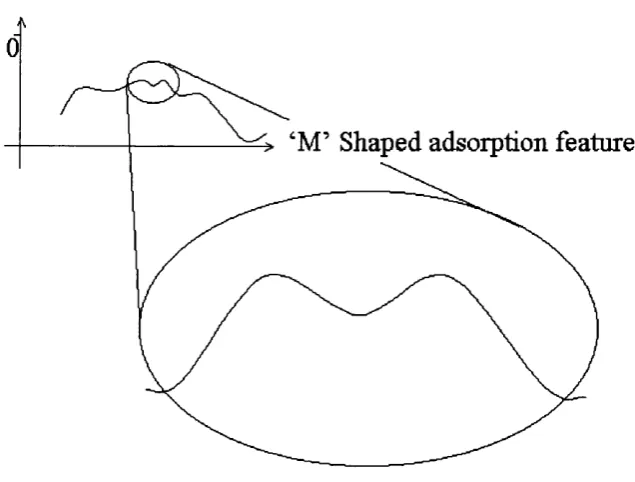
Fig. 5.3.3 12M R surface aperture adsorption site on the type I surface 71 Fig. 5.4.1 Profile o f a stylised “route A ” adsorption energy plot. 74 Fig. 5.4.2 Profile o f a stylised “route B ” adsorption energy plot. 74 Fig. 5.4.3 D etail o f a schem atic adsorption energy m inim a around the 75
surface aperture.
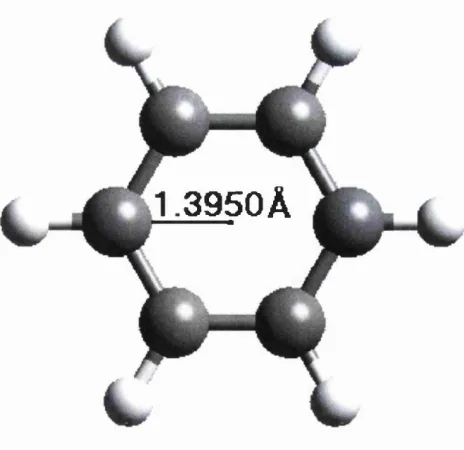
Fig. 5.4.4 Benzene m odel w ith a pseudo atom placed at the centre o f 77 mass
Fig. 5.4.5 Para-xylene m odel w ith a pseudo atom placed at the centre 78 o f mass
Fig. 5.4.6 Plot o f the adsorption energy for the parallel benzene as a 81 function o f the position o f the pseudo atom w ithin the
m odel o f the Type III surface.
Fig. 5.5.1 Incom plete 6M R surface adsorption site on the type I 82 surface for para-xylene.
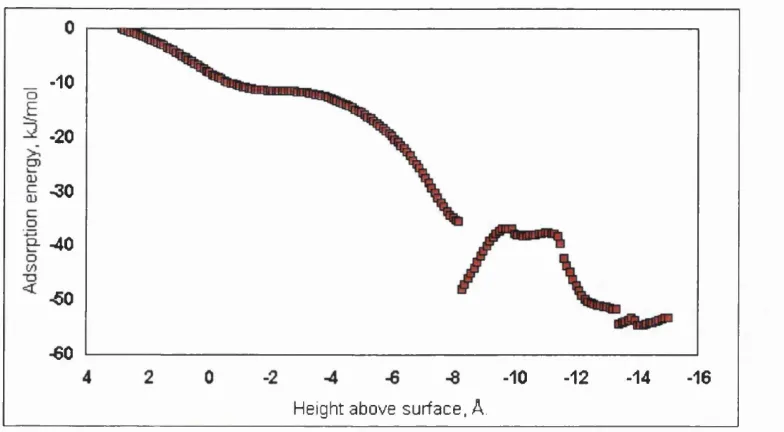
Fig. 5.6.1 A dsorption energy o f the m inim ised geom etry o f 84 para-xylene on the Type I surfaces a function o f the height
o f the pseudoatom above the surface.
on the Type III surfaces a function o f the height o f the pseudoatom above the surface.
Fig. 6.1.1 W urtzite structure o f Zinc Oxide. 92
Fig. 6.6 Energy o f the hexagonal and Cubic phases at varying pressures and 0 Kelvin.
101
Fig. 7.2.1 The two possible cuts for the (lO lO ) surface 107 Fig. 7.2.2. Surface relaxation o f the (1 0 Î0 ) surface 109 Fig. 7.2.3 B ulk-truncated surface m odel used as a starting position
for minimisations.
112
Fig. 7.2.4 R elaxed surface m odel o f the (1010) surface, in profile 113
Fig. 7.2.5 D im er vacancy 117
Fig. 7.2.6 D ifference betw een adjacent and non-adjacent vacancies 117 Fig. 7.2.7 Layer two dim ers relax as layer one dim ers w hen exposed 120 Fig. 7.2.8 A rrangem ent o f V acancies in Surface Patterns 120 Fig. 7.2.9 Linear vacancies in [010], [010] and [001] directions. 121 Fig. 7.2.10 Relaxed structure o f clustered defect w ith five vacant
dimers.
125
Fig. 7.2.11 Relaxed structure o f clustered defect w ith three vacant 126 dimers.
Fig. 8.1.1 Only one type o f ion is exposed in each (111) surface o f a m aterial w ith rocksalt structure.
135
Fig. 8.1.2 The hexacyanoferrate(lll) ion, (F elll(C N )6)3-, the CN ligands are octahedrally arranged
137
Fig. 8.3.1 One and two layer docking o f the inhibitor com plex. 139 Fig. 8.4.1 A llow able positions for placing sodium ions on their
projected lattice sites around a docked inhibitor ion.
140
Fig. 8.4.2 The six possible distributions o f non-lattice sodium ions around the com plex in position A.
141
Fig. 8.4.3 N on-lattice sodium ions tend to pull nearby chlorine ions out o f the surface, disrupting the local surface structure
143
Fig. 8.4.4 N a2Fe(C N6) '’ ion, relaxed geom etry o f cluster w ell aw ay
from its counter ion.
144
Fig. 8.4.5 The m ost favourable configuration features one sodium ion associated w ith three o f the cyano ligands.
145
Fig. 8.4.6 R epresentation o f the m ost favourable distribution o f sodium ions about a docked hexacyanoferrate ion.
L is t o f T a b le s
Tab. 4.1.1 D etails o f N atural Faujasite 35
Tab. 4.2.1 The representative dipole values o f the different valid 39 cuts for the siliceous faujasite cell.
Tab. 4.2.2 Surface and attachm ent energies for valid cuts o f the 40 siliceous faujasite cell.
Tab. 4.3.1 Surface energies o f relaxed hydroxylated surfaces. 42 Tab. 4.3.2 RM S values for the displacem ents o f silicon ions. 43 Tab. 4.5.1 A tom ic coordinates for surface m odels. 53
Tab. 5.1.1 A dsorption energies for SIX and w indow sites in faujasite 58 m aterials
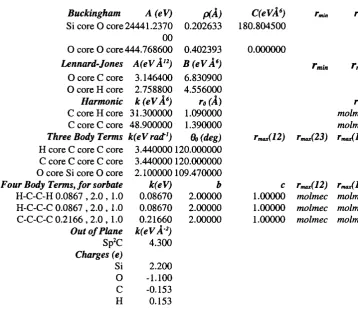
Tab. 5.2.1 Potential param eters from Sanders et al. 64 Tab. 5.2.2 Relevant potential term s from the CVFF forcefield 65 Tab. 5.2.3 Param eters from the forcefield o f H enson et al. 66 Tab. 5.2.4 Param eters from the forcefield used by Sastre et al. 58
Tab. 6.2.1 Experim ental data used to form ulate potential param eters 93 Tab. 6.3.1 Input param eters for an optim isation cycle in the fitting 95
procedure.
Tab. 6.4.1 Potential param eters derived from the fitting process 99 Tab. 6.5.1 Com parison o f calculated values and original 100
experim ental values.
Tab. 7.2.1 Previous data for surface relaxation. 110
Tab. 7.2.2 Significant values for relaxations aw ay from 113 bulk-term ination positions
Tab. 7.2.3 Energy o f different patterns o f single layer defects at 0.75 121 occupancy
Tab. 7.2.4 E nergy o f defects for double layer vacancies using the 124 1x16 model.
Tab. 7.2.5 E nergy o f defects for step defects using the 1x16 m odel. 124
Tab. 8.2.1 Potential Param eters used by B aetzold and in this study. 138 Tab. 8.4.1 System energies generated from the starting positions 142
Chapter 1
C h apter 1 : Introduction a n d aims
1.1 Introduction to Surface Modelling of Complex Oxides
C om puter m odelling o f m atter at the atomic level has becom e, in recent years, a standard and trusted scientific technique, com plem entary to the experim ental and theoretical disciplines. M any papers and articles now are published w hich are the product o f w holly com putational investigations, or com binations o f experim ental and com putational work. Com putational m odelling is now accepted as a valid tool for research and investigation.
This thesis applies m odelling techniques to tw o particular oxide systems where experim ental data are difficult to collect, and not always conclusive. As the range o f oxide com pounds is diverse, so the two oxides in question show distinctly different qualities. The first material in question, siliceous faujasite, is a polym orph o f SiO i and exhibits very low density and high surface area crystals, w hereas the second m aterial, ZnO , exists in am bient conditions as a dense crystal, adopting the w urtzite structure.
C oncerning siliceous faujasite, there is considerable interest in the surface region of the crystal. In the catalytically active faujasite m aterials such as zeolite X and zeolite Y, the active sites are buried deep within the crystal, in the supercages o f the internal structure. M uch w ork has been done to study the bulk parts o f this system, m easuring and calculating quantities such as adsorption energies, diffusion coefficients and the effects o f loading and pressures on the system. H ow ever, little is know n about how the adsorbates and the catalytic reagents gain entry to the interconnected supercages. This is a com m on problem for all zeolites, as little study has been conducted on the properties o f surface transport for any o f the systems. To address the question of surface properties, siliceous faujasite may be taken as a m odel for m aterials w ith the faujasite topology.
C h apter 1 : Introduction a n d aim s
be reviewed, and develop models for the surface o f the crystal which can be corroborated with recent experim ental evidence.
Further to the basic model, Chapter 5 w ill exam ine the interactions o f the surface w ith simple adsorbates at minimal loadings in order to elucidate the fundam ental processes which occur in the surface region. M any aspects can be considered and quantities such as surface adsorption energies, surface transition energies and m inim um energy pathways for surface penetration will be reported for the first time. A nalogous quantities for the equivalent bulk processes obtained in other studies can be used to com pare and contrast the surface and bulk phases in order to show the particular properties of the surface region.
The second m ajor part of this thesis concerns the surface structures o f the various faces of zinc oxide crystals which are expressed. A ccurate inform ation about these surfaces is needed as there is currently debate concerning the catalytic activity o f zinc oxide and recent experim ental and com putational findings for one particular face appear to contradict each other.
In order to investigate correctly the surfaces o f the zinc oxide crystals, an im proved set o f com putational param eters is needed in order to reproduce the effects o f ionic under-coordination in the surface region. C hapter 6 will deal with the creation o f a suitable “forcefield” for the model and will show that the new param eters are sufficiently robust to accomplish the task.
C hapter 7 will show the application of the new forcefield to the surface structures of the main surfaces o f the zinc oxide crystal. In particular, the apparent discrepancy between previously reported structures for one particular surface will be addressed and an appraisal o f the apparently stable dipolar surface w ill be given.
C h apter 1 : Introduction an d aim s
crystal surface and then assess the technique for transferability to com plex systems, such as zeolites and zinc oxide.
Chapter 2
C h apter 2 : O xide M aterials
2.1 Introduction
O xides are hugely im portant to mankind, occurring in large quantities in the E arth ’s com position, and on sm aller scales having various desirable and undesirable qualities for basic and industrial and highly technical use. O xide m aterials are often characterised by a crystalline m orphology and robust physical qualities such as high m elting points and densities. Exam ples can be found right across the periodic table, w ith instances such as sodium oxide, Na%0, m agnesium oxide, M gO , alum inium oxide, A I 2 O 3 , tin oxide, Sn02. Often, real exam ples of oxide m aterials w ill be
non-stoichiom etric, often with a net lack o f oxygen. It is com m on also for m ixed m etal oxides to be formed, with varying com positions of tw o or three types of m etals, such as strontium titanate, SrTiOsLl], and the catalyst support material, Lai-xSrxMn0 3[2]. M etalloid atoms also form oxides, with m uch the same result as
m etals, the m ost ubiquitous exam ple being silicon dioxide, Si0 2, with quartz being
the prim ary material in the E arth ’s crust. O xides o f non-m etals exist also, although the properties o f these materials are m arkedly different from the metal and m etalloid oxides. The oxides of chlorine for exam ple are all liquid or gaseous in am bient conditions and are very reactive.
In this chapter, tw o particular oxides o f im portance will be discussed. The first, that o f silicon, has m any polym orphs; such polym orphs now include m icroporous (zeolitic) solids, which usually exist as m ixed m etal oxides, w ith num erous im purities and are o f particular interest to m any industries. The second, that o f zinc, is a m aterial of im portance in several fields also. N otably it has applications in catalysis, being a useful support material, and debatably, a catalytic m aterial in its own right. Scientifically, zinc oxide is an interesting m aterial irrespective o f its applications, as it exhibits stable crystal surfaces w hich should have polar characteristics - an intriguing topic which is discussed in C hapter 7.
2.2 Silicon Dioxide
C h apter 2 : O xide M aterials
them selves may have both crystalline and am orphous phases; com m on sand and glass being the m ost obvious exam ples, w hilst noting that im purities play a part in m ost naturally occurring com pounds. These m ore com m on phases are relatively dense and have a low surface area. The phases o f interest in this study are m uch less dense and have high surface areas, due to a m icroporous structure w hich makes internal as well as external surfaces accessible. The m aterials w hich adopt this m icroporous nature are found in natural environm ents also and exist in num erous structure types. M icroporous SiO : based com pounds, know n as zeolites, occur in m uch sm aller quantities than dense phase SiOz com pounds and often particular m icroporous structure types are found in very few locations.
2.2.1 Introduction to zeolites.
Zeolites are solid m aterials with well defined m icroporous crystalline structures. Zeolites occur naturally, although many o f the 135[3] know n fram ew ork topologies are exclusively synthetic. Actual zeolites may share fram ew ork topologies but have different chem ical com positions. The first naturally form ed zeolite to be discovered was Stilbite in 18th century[4]. The nam e ‘zeolite’ is from an am algam ation o f the G reek words ‘zeein ’ (m eaning ‘to b o il’) and lithos (m eaning ‘stone’)[5]. The reference to boiling com es from the observation that m any zeolites swell when heated.
It has been shown, initially by Tschaufeser and P ark er[6][7], that som e zeolites exhibit negative therm al expansion. A ttfield and Sleight[8] conducted experim ents w hich showed that siliceous faujasite (the m ain subject o f the m odel in this report) is one such zeolite. M oreover, siliceous faujasite has a strong negative expansion effect in the tem perature range 25 to 573K.
C h apter 2 : O xide M aterials
com m on too and Hutchings and W illock[10] show that m odified zeolite Y can preferentially dehydrate either the R or S enantiom er of b u ta n -2 -o l[ll][1 2 ] (depending upon the m odifier which is either the R or S version of 2-phenyl-1,3-dithiane 1 oxide). Zeolite catalysed reactions are being used to replace m ore traditional synthetic routes as they exhibit superior selectivity and often increase yields. R am Reddy and co-w orkers have recently show n that various zeolite Y ’s facilitate the production o f 2-m ethylquinoline w ith m inim al reagents and no unw anted side products.[13] The fine control over selectivity w hich can be brought about using zeolites has also been recently shown by Thom as, Raja, Sankar and Bell with a reaction to selectively oxidise the term inal carbon atom in linear alkanes.[14]
2.2.2 Chemical composition
Zeolites are principally alum ino-silicate m aterials, and although they may contain various im purities, they have the basic, general atom ic form ula AkSiyOz. In practice, zeolites will contain levels of metals and m etalloids other than silicon and alum inium , the inclusion of the non-silicon atom s require charge stabilisation com pared to totally siliceous zeolites. The charge com pensation is readily achieved by the uptake of cations, which are often protons and/or interstitial m etal cations. In faujasite, a com m on cation is sodium, giving rise to the m aterial denoted N a-Y or Na-X, depending upon the Si/Al ratio.
Chapter 2 : Oxide M aterials
used to indicate a structure where the central atom could be any one of the metal atoms available to the system.
Figure 2.1 : Proton truncated fragment of zeolite framework incorporating aluminium substituted for silicon and a charge com pensating proton, (red = oxygen, gold = silicon, magenta = aluminium, brown = hydrogen)
Although the source of the acidic properties of zeolites is known, Corma et. al. claim that differences between the “strength” of the sites in different zeolites still can not be explained.[16] They explain that ZSM-5 (medium pore size) exhibits stronger acid sites than zeolites with large pores. Also, zeolites exhibit greater acidic strength than amorphous silica-alumina com pounds.[17] A possible reason for the apparent increase in acidity may be explained by the phenomenon of electronic confinement[\%] Electronic confinement refers to situations where the guest molecule feels an enhanced electric field within the cage like framework due to a close fit between framework and guest. The enhanced field affects the energies of the molecular orbitals of the guest and leads to higher reactivity. In this way, the smaller pore zeolites should be thought of not as having acidic sites of greater acidity, but as
‘activators’ of guest molecules.
C h apter 2 : O xide M aterials
class o f materials, alum inophosphates, or A lP O ’s. The building blocks o f the AlPO m aterials are the AIO4 and PO4 units, w hich link together by sharing oxygen atoms
and are analogous Si0 4 groups in the zeolite structures. R ecent w ork by Cora has
shown that there is m uch m ore o f an ionic character to the A lPO bonds, than there is in the S i-0 bonds o f zeolites. [19] By incorporating silicon back into the AlPO m aterials, it is possible to create silico-alum inophosphates (SAPO s).
Considering acid strengths in iso-structural materials, i.e. zeolites and a related class o f m aterials, silico-alum inophosphates (SAPO s), Sastre and Lew is[20] state that no general rule can be form ulated to determ ine which m aterial will provide the greater acidity. Sastre, Lew is and C atlow [21] also note that the strength o f acidic sites in SAPO may be increased by increasing the am ount o f silicon in the fram ew ork or prom oting the occurrence of silicon islands within the fram ew ork.
2.2.3 Natural Formation
The zeolite m aterials w hich form naturally generally have been subjected to a com bination of extrem e tem peratures and pressures. The m ajority o f natural zeolites crystallise from the m aterials derived from volcanic glasses[22].
Even m ore specialised conditions are apparently required for som e zeolites to form naturally. Singh and D utta[23] propose that natural faujasite w ould only remain stable if exposed to either Mg^^ or Ca^^ ions during its form ation stage. Such precise requirem ents w ould be expected to occur rarely w hich is supported by faujasite having been discovered in only a handful o f sites w orldw ide.
2.2.4 Synthesis
C h apter 2 : O xide M aterials
control the intergrowth o f the FA U and EM T structures by m eans o f m anipulating the tem plate and reaction conditions. A com puter program , ZEBED EB, written by Lew is et al.,[25] has proved successful at predicting the tem plates required to form specific zeolites.
A typical preparation for zeolite Y is described by Singh and D utta in their argum ent about the stabilisation processes of natural faujasite.[26] A gel is prepared by first dissolving a small am ount o f sodium alum inate in sodium hydroxide solution and then adding 30% silica solution. The gels are aged at room tem perature and then heated (w ithout stirring and at 90°C for 36 hours in this case) and zeolite Y crystallises from the solution.
O f course, the general m ethod of synthesising zeolites is not always the best method. T he conventional gel m ethod for synthesis is not optim al for producing large single crystals. Nadim i et al. reported a m ethod for producing large and pure single crystals in 1994[27] which involves only reagent quantities o f water. They explain that the quality o f crystals produced is dependent upon the com position o f the reaction m ixture and by suppressing convection currents, secondary nucléation is elim inated and crystal growth is made uniform.
O ther synthetic m ethods are known. Less generalised techniques include the “Instant Zeolite A ” pow der that Norby et al.[28] studied. The ‘pow der’ is produced by fusing natural sodalite with N aO H at 400°C, rem oving the gel stage described in the preparation o f faujasite (above). By adding the correct am ount o f water, and heating at 70°C, crystallisation o f zeolite A begins after 30 m inutes. The crystallisation is tim e dependent, and N orby’s group show that zeolite A subsequently degrades and sodalite is reformed.
2.2.5 Microporosity
Chapter 2 : Oxide M aterials
than 50 Angstroms. There appears to be a curious lack of materials with pores with diameters between the microporous and mesoporous ranges; a satisfactory explanation for this observation has yet to be found.
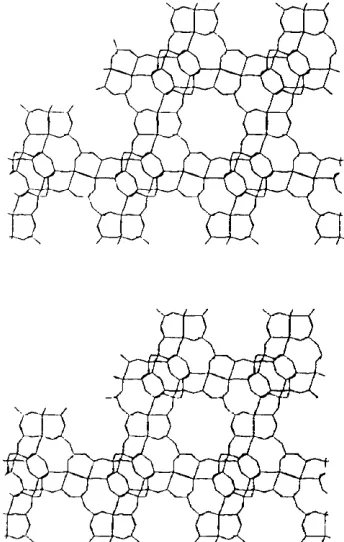
Zeolites are microporous, allowing them to absorb water and small organic molecules into their framework structures according to the dim ensions of the surface apertures. Many zeolite structures have channels into which larger species may diffuse. Figure 2.2 shows part of the structure of M ordenite which has straight channels. Other zeolites exhibit sinusoidal channels (ZSM-5 for instance) and some can be seen to contain different sets of channels running in different directions such as CIT-1 which was chosen by Sastre et al.[29] for a study of aromatics in zeolites with both 10 and 12 membered ring (lOMR and 12MR) channels. These channels allow transport of the absorbed molecules through the crystal and are essential to most of the commercially exploitable properties of zeolites.
Figure 2.2 : Part of the structure of the zeolite M ordenite, showing the channel structure.
C hapter 2 : Oxide M aterials
limited by shape to those molecules which are able to diffuse through the channels to the site of the activity. The speed of transport within channels is governed by the dimensions and shape of the channel.
2.2.6 S tru c tu re s
The structures of zeolites are related as they contain common building blocks. The most basic structural unit is the Si0 4 tetrahedron (see Figure 2.3) which is common to more condensed phases of silica such as sand. The Si0 4 tetrahedra each share all of their comers. The connectivity of the com er sharing, along with the bond angles, determines the overall structure of the material. Generally, when describing zeolites, the units are referred to as TO4 tetrahedra in reference to the fact that the tetrahedral 1 y bonded atom could be a silicon aluminium or other atom, as previously described.
Figure 2.3 : A Si0 4 tetrahedral unit and its corresponding tetrahedral representation.
There are many common arrangements of linkages between tetrahedra observed in zeolites which are known as Secondary Building Units (SBU)[30]. Several, more com plicated, organisations of tetrahedra are also recognised as higher units, although they are not actually SBU ’s. The most im portant exam ple of a higher unit is the sodalite unit or P cage (see figure 2.4). The sodalite unit comprises a cubooctahedron of T atoms and is large enough to surround small molecules.
Chapter 2 : Oxide M aterials
cavity left in the centre of 8 sodalite units (joined as in the structure of sodalite) is equivalent to a sodalite unit. The largest window consists of a six-ring of T atoms. When describing zeolites, it is common to refer to the connected rings of atoms by the number of T atoms that they contain. For instance, a ring containing the atoms : Si-O-Si-O-Si-O-Si-O-Si , where the bold type signifies the same atom, would be described as a 4 membered ring (4MR), even though it contains eight atoms.
Figure 2.4 : A sodalite unit, shown with 50% A1 substitution, com pensators omitted.
C hapter 2 : Oxide M aterials
Joining sodalite units together in different ways allows greater cavities to be formed. The structure of Zeolite A exhibits sodalite cages joined together by bridges between the 4-rings of T atoms, (see figure 2.6) resulting in cavities that are larger than sodalite cages and the windows between cavities are now created from an 8-ring of T atoms.
Figure 2.6 : Zeolite A - sodalite cages linked by bridges.
Chapter 2 : Oxide M aterials
materials to be classified as siliceous. As siliceous faujasite is the subject of the investigations in chapters 4 and 5, it is important to stress here that references to faujasite, are meant in the sense of the framework type, rather than the actual mineral.
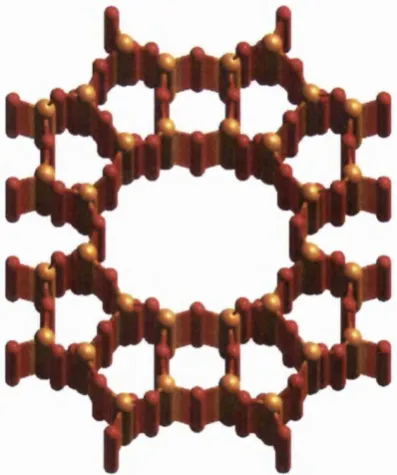
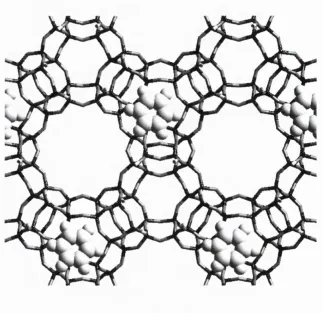
Figure 2.7 : Faujasite (part of the structure) showing the sodalite unit in ball and stick representation and the bridges to other sodalite cages in ribbon representation. The directions of the bridges form a tetrahedron.
2.2.7 A pplications
C h apter 2 : O xide M aterials
ZSM -5 type zeolites, whereas zeolite Y presents no steric barriers to the diffusion of cym enes. This is an excellent exam ple o f the ability o f zeolites to exhibit shape selectivity in their chemistry. Reactions which can be perform ed with greater control over the products form ed are of obvious im portance to industry.
The m ore interesting physical properties o f m aterials w ith sodalite cages occur when the trapped m olecules are charged. Exam ples o f sodalite cages containing ions include the ultram arine dye in which S3 ions are trapped w ithin sodalite cages. [32]
M ore exotically, the sodalite analogue, Z n G aP -S O D l, w hich exhibits sodalite cage units, but contains T atoms o f Ga Zn and P, contains tetram ethyl am m onium ions which stabilise the gallophosphate m aterial.[33] No applications are yet known for Z n G aP -S O D l, though the overall charge per cage o f these sodalite analogues is -1.
2.3 Zinc Oxide
Zinc oxide is a sem iconductor material, with a large band gap o f 3.37 eV at room tem perature[34] which puts it on the borderline o f being an insulator.[35] M any actual and potential uses have been described for zinc oxide, either in the form of thin film s[36], isolated “quantum dots” [37], nanow ires[38], piezoelectric films[39] or m icrocrystallites[40].
The zinc oxide crystal exhibits three m ain surfaces in the crystal m orphology, <1010>, <1120> and < 0 0 0 1>. Nyberg et al. also report that stable faces also result from cleaving the crystal in the (401) and (501) directions, although the stability of these faces is not great enough to allow them to be expressed in the crystal habit.[41]
Chapter 2 : Oxide M aterials
Figure 2.3.1. The unit cell of zinc oxide is hexagonal, with dim ensions a,b = 3.249Â and c= 5.205Â
2.4 References
[1] Noguera. C, Physics and Chemistry at Oxide Surfaces, Cambridge University Press, Cambridge, 1996.
[2] Mitani, M.M., Keller, A.A., Golden, S.J., Hatfield, R. and Cheetham, A.K., 2001,
Applied Catalysis-B, Environmental, in press.
[3] Baerl ocher. Ch., Meier, W.M. and Olson, D.H., ''Atlas o f Zeolite Framework Types", 5th ed., Elsevier: Amsterdam, 2001.
[4] Feijen, E.J.P, Martens, J.A. and Jacobs, P.A., in Zeolites and related M icroporous Materials: State o f the A rt 1994, Studies in Surface Science and Catalysis, Vol. 84. (Ed. W eitkamp et. al.) Elsevier Science 1994.
[5] The Chambers Dictionary, Chambers Harrap Publishers Ltd, Edinburgh 1993. [6] Tschaufeser, P. and Parker, S.C., J. Phys. Chem., 101 (1995), 10609-10615 [7] Couves, J.W., Jones, R.H., Parker, S.C., Tschaufeser, P. and Catlow, C.R.A., J. Phys.: Condensed M atter S, (1993) L 329-332
[8] Attfield, M.P. and Sleight, A.W., Chem. Commun. (1998) 601 - 602
C h apter 2 : Oxide M aterials
[10] H utchings, G J . and W illock, D J ., Topics in Catalysis
5
(1998) 177-185 [11] As reference 10.[12] Feast, S., Rafiq, M., Siddiqui, H., W ells, R.P.K ., W illock, D .J., K ing, P., Rochester, C.H., Bethell, D ., Page Bulm an, C. and H utchings, G J ., J. Catalysis
167
(1997) 533 - 542[13] R am Reddy, P., Subba R ao, K.V., & Subrahm anyam , M ., C a ta l Lett.
56
(1998) 155-158[14] Thom as, J.M ., Raja, R., Sankar, G. and Bell, R .G ., N ature,
398
(1999) 227 - 230[15] Loew enstein, W ., Am. M ineral. 39 (1954) 92 [16] As reference 9.
[17] S astre, G. and Lewis, D .W ., J. Chem. Sac. Faraday Trans.,
94
(1998) 3049 - 3058[18] As reference 16.
[19] Cora, P., personal com m unication. [20] As reference 10.
[21] S astre. G., Lewis, D.W . and Catlow, C. R. A., J. Molec. Catal. A-Chem ical,
119
(1997) 349 - 356[22] Sm ith, J.V ., A rnold Jr., P.P., Parsons, I., Lee, M R., Proc. Natl. Acad. Sci. USA
96,
(1999), 3479 - 3485.[23] Singh, R. and D utta, P.K ., Microp. and M esop. M ater.,
21
(1998) 103 - 109 [24] Hanif, N ., Anderson, M .W ., Alfredsson, V. and Terasaki, O., Physical Chem istry Chem ical Physics, 2 (2000) 3349 - 3357.[25] Lew is, D .W ., W illock, D .J., Catlow, C.R.A ., Thom as, J.M . and H utchings, G.J.,
N ature
382
(1996) 604 - 606C h apter 2 : Oxide M aterials
M icroporous M aterials: State o f the A rt 1994, Studies in Surface Science and Catalysis, Vol. 84. (Ed. W eitkam p et. al.) E lsevier Science 1994.
[29] Sastre, G., Raj, N., Catlow, C.R.A., Roque-M alherbe, R. and Corm a, A., J. Phys. Chem. B
17
(1998) 3198 - 3209[30] Catlow, C.R.A. in M odelling o f structure an d reactivity in zeolites. (Ed. Catlow) Academ ic Press, London 1992.
[31] W eyrich, P.A ., H olderich, W ., van D aelen, M .A .and G orm an, A.M ., Catal. Lett.,
52
(1998) 7 - 12[32] A s reference 25.
[33] Bu, X., Feng, P., Gier, T.E. and Stucky, G.D., M icroporous and M esoporous M aterials,
23
(1998) 323-330[34] Kubo, M., O um i, Y., Takaba, H., Chatterjee, A., M iyam oto, A., K aw asaki, M., Y oshim oto, M. and Koinuma, H., Physical Review B
61
(2000) 16187 - 16192 [35] A s reference 1.[36] Gorla, C.R., Em enetoglu, N .W ., Liang, S., M ayo, W .E. and Lu, Y., Journal o f Applied Physics,
85
(1999) 2595 - 2602[37] A j reference 34.
[38] Huang, M .H ., M ao, S., Feick, H., Yan, H., W u, Y., K ind, H ., W eber, E., Russo, R., and Yang, P., Science,
292
(2001) 1897 - 1899[39] D eV oe, D.L., Sensors and Actuators A, 88 (2001) 263 - 272
[40] Yu, B., Zhu, C., Gan, P., H uang, Y., M aterials Letters,
33
(1998) 247 - 250. [41] Nyberg, M ., Nygren, M .A., Pettersson, L.G.M ., Gay, D.H. and R ohl, A.L.,Chapter 3
C h apter 3 : M odellin g a t the atom ic level
3.1 Introduction to Computer Modelling
Com puter m odelling is a rapidly expanding com ponent o f scientific research. Indeed, com puter m odelling is now becom ing a com m only used tool in chem ical, physical and biological investigations. As with all scientific m ethods, it is a tool which requires the investigators to develop the appropriate understanding o f the underlying principles and m ethodologies. U sed correctly, it m ay aid in understanding experim ental observations and, to an increasing extent, it can predict results of experim ents w hich have not or can not be perform ed. D ata can be used to show w here experim ents may be im proved, how experim ental data m ay be refined or indeed which experim ents need not be perform ed.
In the past, m odelling and other com putational techniques in science have been prim arily em ployed to corroborate or explain experim ental data. Q uite rightly, researchers have been reluctant to take data from com puter m odelling calculations as the prim ary source o f inform ation. The num ber and nature o f approxim ations used in the com puter codes which are used to calculate inform ation have been such that it has been unclear w hether the results can stand alone as being representative of the system they are attem pting to model. Also, and m ore fundam entally, the level of theory on which the procedures are based will give an absolute lim it to the accuracy and reliability o f the calculations, but does not guarantee that individual calculations will achieve this limit.
C h apter 3 : M odellin g a t the atom ic level
3.1.1 Typography of Modelling
M odelling of m atter can occur at many different levels o f scale, w here each level can be seen to correspond to a particular level o f structure w ithin the matter. For com puter m odelling at any level of scale, the core principles are sim ilar; particular units o f m atter are assigned and given characteristic properties. T he interaction o f the units o f m atter can then be investigated using equations w hich describe the relationship betw een the properties o f the units. This m ay seem to be a broad concept, but all direct m ethods o f m odelling m atter are im plem ented in this m anner, from the very large to the very small. For instance, in even a sim ple m odel o f our solar system, the units of m atter are the sun, and the planets and the characteristic properties that each w ould need w ould be position, velocity, and mass. In this sim ple case, the units o f m atter can then be m odelled using equations pertaining to m otion and gravity. On a sm aller scale, the m ovem ents o f the plates in the earths crust can be m odelled by giving the plates and the m antle on w hich they sit attributes such as m ass, velocity and viscosity. Equations o f m otion can then be applied to the plates to m ake predictions about their m ovements. On a sm aller scale o f m atter still, fluid dynam icists use the same basic principle, assigning properties to the particles o f fluid and to any environm ent that the particles are flow ing through, and using equations relevant to those properties to investigate the system as a whole. This pattern continues right dow n to the sub-atom ic level, with chem ists and physicists assigning properties to electrons, neutrons and protons and utilising the equations borne o f quantum theory.
3.2 The role of Modelling
C h apter 3 : M odellin g a t the atom ic level
routinely calculated to a finite range only. Theoretically these interactions contribute at all distances. The range to which non-bonded interactions are calculated has often been set alm ost arbitrarily in the past, in order to fit the size o f the problem to the m achine com puting it. Periodic Boundary Conditions also prohibit the “c u t-o ff’ distance from being equal to or greater than half o f the repeat unit. Typically these approxim ations are shown to be valid by perform ing a test with greater ranges and showing that the quality o f the findings does not significantly im prove with the increased calculations.
H owever, there are questions which can not be answ ered by experim ent (or at least not with current experim ental techniques). There are other questions which can only be answ ered with exceptional difficulty by experim ent. There are also further questions which can only be answ ered with exceptional cost by experim ent.
Surfaces are a notable area of interest where experim ent is not always able to give a full picture. U nlike bulk properties, surfaces are generally lim ited to a thickness of a few atoms. Special techniques are required to gather data from atom s specific to the surface. M icroscopy can be em ployed in various form s to probe surfaces, although in some cases, perform ing Scanning Electron M icroscopy (SEM ), Scanning Tunnelling M icroscopy (STM ) or Atomic Force M icroscopy (A FM ) m ay either dam age or tem porarily distort the surface which is being investigated and give misleading results. The advances and lim itations o f A FM for studying surfaces are discussed by Y am am oto et. a l.[l] in their paper concerning A FM im ages o f the surface o f natural heulandite. The group present im ages which they claim show surface hydroxyl groups.
C h apter 3 : M odelling a t the atom ic level
3.3 Theory of modelling using Interatomic Potentials
Interatom ic potential m ethods for atomic m odelling attem pt to reduce the com plete problem to a problem with less variables. The com plete problem w ould o f course include each o f the electrons in each o f the atoms in the m odel. It m ight be feasible to include every electron in the m odel, but it is im possible to create a basic calculation based on electron-electron interactions because the precise location o f the electrons is not know n and cannot be measured. Therefore, an approxim ation to the electron-electron interactions m ust be form ed, and this is indeed w hat electronic calculation m ethods attem pt to address; the various m ethods each provide an approxim ation for the electron-electron interactions, or correlation. H owever, interatom ic potential m ethods assume that the electrons are spread evenly around the nucleus o f the atom and act as if they were a point-charge at the centre o f their sphere. Thus, the com plete problem may be reduced to treating each atom as a single point and using the potential param eters to describe the attractive and repulsive forces which the atom possesses.
Energy m inim isation using specified potentials is the m ethod o f choice for the m ajority of the calculations presented in the follow ing chapters. Energy m inim isation is an aspect of M olecular M echanics (M M). An understanding o f how and why the technique works is required to understand fully the softw are and the results w hich it produces.
C h apter 3 : M odellin g a t the atom ic level
3.3.1 Energy calculations in Energy minimisations
Once the system has been created, an energy calculation m ay be performed. Equations describing the energy profile of atom ic interactions are em ployed to calculate the energy o f the system in relative term s; an absolute value is not obtained in m ost cases as the equations such as the H arm onic functions are designed to provide an energy relative to the equilibrium state. The equations are known as “potentials” . Enough potentials m ust be included in the m odel to describe every significant inter-atom ic interaction.
Typical and com m on term s for the forms o f potentials[3] are shown below. The exam ples are not an exhaustive list, as m any equations w ould adequately describe the energetic relationship between atoms. H ow ever, the exam ples include the com m only used types of potentials which are know n to reproduce the attractive and repulsive forces between atoms.
B ond Stretching
M orse function Harm onic function B ond A ngle Oscillations
Harm onic function Core-Shell connection function
Spring (harmonic) D ihedral A ngle V ariations
Fourier Series Van der W aals Interactions
Lennard Jones function B uckingham function Electrostatic function
Coulom b function
= S D «[1 - e x p { - a ( r - r o ) } ] ^ [Eqn. 3.1]
Ebond = ^ k r { r - r Q Ÿ [Eqn. 3.2]
Eangle = 'Z k e ( 6 - ÔqY
Espring = S [ - |( r - ro)^ + j ( r - ro)"^]
Etorsion — ^ V/i(l H" SCOSfVUj')
E v d w =
- (-^)]
Evdw = I A ex p (-B r) - (-^)
Eelectronic ~~ ^ rii
[Eqn. 3.3]
[Eqn. 3.4]
[Eqn. 3.5]
[Eqn. 3.6] [Eqn. 3.7]
C h apter 3 : M odellin g a t the atom ic level
In equations 3.1 to 3.8 : E represents energy, q represents charge, r represents distance, theta and om ega represent angles, k, alpha, A, B, C, D, V a n d s are constants. A subscript of 0 represents the equilibrium value. The spring potential is not always im plem ented to include the quartic term , k/4(r-roX, but this term is of considerable use in sensitive systems as a m ethod o f fine tuning the potential.
The summation o f all o f the energy contributions gives an energy value which num erically is not representative but rather can be used as a basis for com parison. Typical com parisons w ould include calculating energy changes as a function of atom ic displacem ents or calculating the difference in relative energy between different conform ations o f the sam e system.
3.3.2 Parameterisation
The constants which are utilised in the potentials are usually assigned in one o f three main ways. Em pirical fitting involves taking know n values for physical properties and using an iterative procedure to refine the potential param eters in order to reproduce the physical properties, the structural properties are obvious choices to base potential param eters on, but m any other quantities m ay be used such as dielectric and elastic constants. Ab-initio energy surface fitting is a m ore recent technique which takes the energy hypersurface generated by ab-initio calculations and extracts the values o f the potential param eters. Electron gas interaction fitting uses isolated atom pairs in the gaseous state, and calculates the interactions o f the pair across a range of distances using ab-initio m ethods. T he coefficients for potential param eters can then be extracted from the plot o f the changing interaction energy of the tw o species.
C h apter 3 : M odellin g a t the atom ic level
3.3.3 Geometry optimisation in Molecular Mechanics
G eom etry optim isation is a highly desirable goal in m any m odels, the geom etry of the model can be optim ised by m inim ising the energy o f the system. To undertake energy m inim isation, the atomic co-ordinates m ust be varied. In efficient m inim isations, the gradients o f the energy profile are calculated by differentiating the potential equations with respect to the Cartesian directions separately. This derivative is the Force on the atom. A tom ic co-ordinates are then altered in the direction o f the Force. An iterative procedure o f these steps theoretically leads to a point o f convergence. At convergence successive iterations do not lead to a reduction in the energy o f the system. The system is then be said to be in an “energy m inim um ”, where no further energy decreases m ay be achieved by finding the Force on the atoms. C om plicated systems may have m any m inim a, each with a different energy value. If an energy m inim um has the low est possible energy, it is said to be the “Global M inim um ”, all other m inim a are “Local M inim a” . It is often difficult to distinguish between the global m inim um o f a com plicated system and its local m inim a.
C h apter 3 : M odellin g a t the atom ic level
Steepest D escents = X . - X i - g [Eqn. 3.9]
' — ;
W here X is the set o f co-ordinates for each o f the atom s in x, y and z, X is the step size o f the m inim iser (a scalar quantity), g is the Jacobian M atrix (stores all o f the negative values of the gradient vectors) and i is the cycle num ber.
An im provem ent to Steepest D escents is to use C onjugent G radients. This method converges usually much faster than Steepest D escents as each step takes into account the direction o f the force o f the previous step. As before, a direction o f force is found each cycle but now, the direction is m odified by the addition o f a fraction o f the previous direction. This has the effect o f ‘steering’ the m inim isation continually tow ards the energy m inim um (global or otherw ise) rather than suffering from the overshoot problem s of Steepest Descents. Equations 3.10 and 3.11 show how Conjugent G radients is performed.
Conjugent G radients X,+i = X. - Ài • h. [Eqn. 3.10]
w here [E q n -3.11]
Sym bols as Eqn. 3.8, h is the new conjugent gradient, for the first cycle of calculation it will be the same as g.
O ther m ethods, which can be grouped under a broad heading o f “Q uasi-N ew tonian” tend to perform poorly with high gradients but bring a system w ith sm all gradients to convergence quickly. These m ethods generally require the second derivatives of the Force as well as the first derivatives. (Com m only the second derivatives are stored in a m atrix called the Hessian matrix - for all but the sim plest o f systems, creating, storing and updating the H essian is com putationally very expensive.)
C h apter 3 : M odelling a t the atom ic level
the “Q uasi-N ew tonian” heading applies to m ethods derived from NR. The full NR m ethod is described in equation 3.12.
N R m ethod X,+i = X - [ g ' • g ] [Eqn. 3.12]
I — (
Sym bols as Eqn. 3.8 plus H represents the H essian m atrix, we have to use the inverse H essian because we actually want to divide the Jacobian m atrix by the Hessian matrix. G rant and Richards give a derivation o f the basis o f this equation. [4]
In practice, sim plifications o f and approxim ations to the full N R m ethod are em ployed. A com m on m ethod is called “Block D iagonal” and this involves considering all o f the cross term s in the H essian m atrix to be zero and only considering the diagonal elem ents o f the H essian to be non zero. This significantly reduces the cost o f several steps in the calculation.
A further m ethod o f m inim isation is som etim es em ployed. M onte Carlo modelling incorporates a random elem ent into the updating procedure o f the atom ic positions. M onte Carlo is not used in this study.
3.4 Molecular Modelling in this study
C h apter 3 : M odellin g a t the atom ic level
3.5 The MARVIN program
The M ARV IN program facilitates the calculation o f all o f the above equations and m ethods and specifically to do this in a surface environm ent. T he basic m ethodology o f the program is to store the atoms and ions o f the m odel in tw o regions. O ne region contains the ions which are to be the surface and the other region contains a continuation of the crystal structure beneath the surface w hich is kept fixed and only serves the purpose to represent the bulk o f the crystal and to provide the correct electrostatic field. The first region o f the model is allow ed to m ove during the sim ulation or m inim isation and is subject to the forcefield described by the potential param eters supplied to the calculation. Periodic boundary conditions are applied to the model in two dim ensions, to create an infinite surface region, but the third dim ension is not replicated as there needs to be a clear distinction betw een the lattice and vacuum regions.
C h apter 3 : M odellin g a t the atom ic level
3.6 References
1] Y am am oto, S., Sugiyama, S., M atsuoka, O., H onda, T., Banno, Y. and Nozoye, i., M icroporous and M esoporous M aterials
21
(1998) 1 - 62] D ick, E.G . and O verhauser, A.W ., Phys. Rev.
112
(1958) 90 - 1033] A dapted from Grant, G.H. and Richards, W .G., C om putational Chemistry,
O xford U niversity Press 1995.
4] G rant, G.H. and Richards, W .G., C om putational Chemistry, O xford U niversity ^ress 1995.
5] Gay, D .H ., Rohl, A.L. J. Chem. Soc., Faraday Trans., 91 (1995) 925 - 936. 6] Ew ald, R.P., Ann. Physik.,
64
(1921) 2537] Tosi, M .P., Solid State Physics,
16
(1964) 5178] D eem , M .W ., Newsam , J.M . and Sinha, S.K., J. Phys. Chem.,
94
(1990) 8356 9] Parry, D .E., Surf. Sci.,49
(1975) 43310] Parry, D.E., Surf. Sci.,
54
(1976) 195Chapter 4
C h apter 4 : F aujasite Surfaces
4.1 Introduction to faujasite
Faujasite is a com m on exam ple o f a zeolite, exhibiting features as described in C hapter 2. The structure is built from sodalite cages connected by bridges betw een 6 m em bered rings (MR). This arrangem ent results in cavities that are m uch larger than the sodalite cages from which they are constituted. The larger cavities are know n as supercages and adjacent supercages are connected by 12 m em bered ring apertures. The four connecting 12MR w indow s betw een supercages are distributed tetrahedrally around each supercage, m eaning that no straight channels are present in the bulk lattice. A sinusoidal pathway does exist through the crystal if one could follow a particular path o f 12MR window s, but any adsorbates w ould be unlikely to follow such a route as each supercage allow s for three equally favourable exits, even discounting m olecules leaving through the same w indow as they entered. In practice, adsorbates have longer residence times inside each supercage and shorter periods of inter-supercage travel[l][2 ][3 ], giving a virtually random choice o f exits from each supercage. As such, it is preferable to think o f adsorbates roam ing random ly in the bulk as opposed to following a particular channel-directed pathway. M olecular D ynam ics calculations in faujasite show such behaviour[4], w hich is different from the channel directed diffusion[5] [6].
C h apter 4 : F aujasite Surfaces
4.1.1 Faujasite crystallite morphologies
A ccording to the Atlas o f Zeolite Structures[10], natural faujasite has a com position as described in Table 4.1.1 and the generic classification given by the A tlas for m aterials which are isostructural to faujasite is FAU. O f course, natural faujasite is not particularly useful for industrial catalytic processes due to the lack o f hom ogeneity both inside samples and between various sources.
Com position : X29 (HiOjiw Al5gSii34 O384
Crystal : cubic U nit cell : a = 24.74 Â
D ensity : 12.7 Si or A1 ions / 1000Â ^
Where X can be a mixture from range of cations, such as Ca2+, Mg2+ or 2(Na+)
T able 4.1.1 D etails o f Natural Faujasite
4.1.2 Synthetic composition of Faujasite type materials
T he FA U structure can tolerate a wide ratio o f silicon to alum inium and the associated cations which counterbalance the Si/Al substitutions. A com m on way to characterise zeolites is to report the silicon to alum inium ratio and to note w hich type o f cations are the predom inant charge com pensators. Silicon to alum inium ratios in faujasite may range from (low Al) to 1.4 (high Al), and com m on cations are protons and group one and two elements.
4.1.3 Faujasite type materials : crystallite morphologies
C h apter 4 : F aujasite Surfaces
distribution o f the 12MR around the supercages, this gives the opportunity for 12MR to lie parallel to each o f the <111 > crystal faces and thus present an aperture to the exterior o f the crystal. D ue to the predom inance o f the face type, the (111) face was selected for study.
4.2 Surface Modelling
M odelling a zeolite surface is not a sim ple task. D ue to the large unit cell exhibited by the structure, there are a num ber of alternative places to cleave the crystal to make a surface. Further to that, zeolites in aqueous and alkaline environm ents or which have been exposed to such conditions tend to have a hydroxylated term inating layer at their surfaces. In the context of creating a surface m odel using the com puter code M A RV IN [13], care also has to be taken to ensure that the m odel has no net charge and further that the surface has no dipole m om ent across it.
4.2.1 Surface Model Preparation
Previous faujasite surface models have been presented for the (111) face, in works which were predecessors to this study[14][15]. The M A R V IN program was used to determ ine all o f the possible ways to cut the m odel to present the (111) surface. The selection o f surface model is discussed below in section 4.2.3.
In each m odel, the M ARV IN program was again used to extend the crystal ’downwards', perpendicular to the surface in order to create a m odel o f sufficient depth for the surface. In each case, the models contained 48 Si ions and 192 O ions (including shells) in the unit cell, which was replicated to provide a model which was 8 unit cells deep and contained 1920 ions.
4.2.2 Hydroxylation of surfaces
C h apter 4 : F aujasite Surfaces
proton (in the case o f O ions) or a hydroxyl group (in the case o f Si ions). This m ethod o f term ination leaves a charge neutral surface saturated by hydroxyl groups. In som e cases, the cut o f the surface w ould leave an unequal num ber o f unfilled silicon and oxygen valences which w ould necessarily result in a charged model. In such cases, the excess charge could be neutralised by rem oving an equivalent charge from the bulk end of the m odel (the bottom o f the fixed region). This m ethod w ould produce charge neutral m odels, but generally a large residual dipole w ould be left across the surface when term ination was achieved in this way. To avoid this undesirable situation, such m odels were extended by an appropriate fraction o f a unit cell in the fixed region in order to create a charge neutral m odel w here a surface dipole is avoided because the extended end o f the m odel counteracts the truncated end through sym m etrical considerations.
4.2.3 Determination of cleavage plane by calculation
Candidate hydrated surfaces were analysed on several criteria for suitability as model surfaces, including the dipole normal to the surface, surface energy and attachm ent energy. The M A RV IN program calculates surface energy and attachm ent energy according to procedures which are now discussed.
Calculation o f the Surface Energy is achieved by taking the difference between the energy o f a unit cell which is in the bulk and the total energy o f a unit cell which is in the form o f a slab model (i.e. is not periodic in the surface direction). Because we are interested in the energy o f only one surface, and not o f both sides o f the slab, we halve the value.
Esurf — ((Ebulk ~ Eslab) / 3reaslab_surface) ( 1 ) ,
C h apter 4 : F aujasite Surfaces
C alculation o f the A ttachm ent Energy is achieved by calculating the energy required to attach one unit cell to the surface.
Eatt = ZEsUce (2 ),
w here Eatt is the attachm ent energy and Esuce is the sum o f the interaction energies betw een a slice o f the crystal surface o f fixed depth and all o f it’s underlying slices [16].
A rranging a m odel crystal so that the <111> faces are at the top and bottom , we find that several valid cuts o f the crystal occur, assum ing that the final surface will be relatively flat, and that a com plete horizontal layer o f atom s is exposed as the surface, rather than portions o f different horizontal layers. As there has been no evidence o f faceting o f the surfaces from either A FM [17] or H RTEM [18], it is unlikely that we need to consider faceted surfaces as candidate m odels for analysis. F or our purposes, these possible cutting heights can be thought o f as a set o f “valid cuts” .
A com puter script called “G etsurfaces” written by D. Gay[19] provides an autom ated way to produce a M ARV IN calculation on each o f the valid cuts, which can be achieved w ithout creating a defective or charged m odel because a shift value may be applied to the unit cell. The shift applied to a unit cell is m erely a percentage, used to alter the position o f the edges o f the cell. F or exam ple, a shift o f 0.5 applied to a cell : “A B C D ” w ould result in a cell “CD A B”, w hich is entirely the sam e when considered under periodic boundary conditions but has an alternative surface to the original cell. A shift o f 0.0 or 1.0 w ould not change the description o f the cell as the cell w ould be shifted by either no unit cells or by a w hole unit cell.